Vol. 43 (2000) 471–485
Confidence lost and — partially — regained:
consumer response to food scares
Andreas Böcker
a,∗, Claus-Hennig Hanf
baDepartment of Agricultural Policy and Market Research, Justus-Liebig-University,
Senckenbergstr. 3, 35390 Giessen, Germany
bChristian-Albrechts-Universität zu Kiel, Kiel, Germany
Received 11 August 1998; received in revised form 9 March 2000; accepted 9 May 2000
Abstract
In a model of individual information processing a two step risk perception process is proposed. First, differences in the reliability between single types of suppliers are captured by subjective failure probabilities. Second, trust in an individual supplier is defined as the subjective probability that he is a reliable one. This contrasts the standard assumption of a single step risk perception process based on ‘objective’ probability information. The analysis shows that the typically observed consumer response to food scares, i.e. a sharp decline in demand, followed by a slow and often incomplete recovery, may thus be explained. Furthermore, implications concerning the information strategies of suppliers with respect to food safety are derived. © 2000 Elsevier Science B.V. All rights reserved.
Keywords:Consumer trust; Consumer response; Food scares
JEL classification:D83 — Search, learning, and information; D11 — Consumer economics: theory
1. Introduction
In the past two decades, the food industries of high-income countries have experienced an increasing number of food scares and food safety crises. These incidents usually cause rather typical patterns of response by consumers. First, there is a sharp and immediate drop in aggregate demand. Then, despite established safety and intense reassuring communication by business or political representatives, follows a slow and often incomplete recovery toward previous consumption levels again (Liu et al., 1998).
Explanations for this typical response pattern are usually found in the domain of media and communication research. Biases in the media coverage toward dramatic events or
ex-∗Corresponding author. Tel.:+49-641-99-37037; fax:+49-641-99-37029. E-mail address:[email protected] (A. Böcker).
aggeration of technological dangers are identified as possible reasons for drastic response by consumers (Sharlin, 1987; Maney and Plutzer, 1996). Furthermore, Slovic (1992) and Frewer et al. (1996) found that the level of trust in different information sources influence individual risk perception. Such media-related studies provide valuable insight in the mech-anisms of risk perception and communication. From an economic perspective, however, the impact of information on purchasing behavior is the relevant issue. In a number of exper-imental studies this link has been analyzed to measure consumers’ willingness to pay for increased food safety. In these studies technical information on fatality likelihood or safety levels has been usually applied as experimental input.
Here, we argue that an important link between perceived risk and purchase decision has so far been neglected in economic analyses on food safety evaluations: the consumer’s trust in a supplier’s reliability. We provide both theoretical and empirical support for taking this element of food purchase decisions into account. Hence, the objective of this paper is to analyze the effects of incorporating trust in a consumer’s risk perception on food purchase decisions. For this purpose, a model of individual information processing is pro-posed in which trust in a supplier of a potentially unsafe product is revised according to Bayes’ rule. Perceived differences in the reliability of supplier types are captured by subjective probabilities of product failure. The model analysis shows that the typically ob-served response pattern of consumers need not result from possible media-related effects. This pattern rather is a ‘rational’ response to information on food scares, when trust in suppliers matters. Furthermore, implications concerning the information strategies of food producers or retailers with respect to information on reliability can be derived from the results.
The remaining paper is organized as follows. In Section 2, our basic assumptions with respect to individual behavior are delineated alongside three key aspects. The purpose of that part is to underscore the empirical relevance of the formal model, which is then presented in Section 3. The model analysis follows the typical path of information release in a food safety crisis: negative information, e.g. on product contamination or food poisoning, is followed by positive information in the supplier’s effort to restore confidence. Finally, implications of the model results for aggregate demand, with specific respect to the role of the mass media, and for suppliers’ information strategies are discussed in Section 4.
2. Basic assumptions about risk perception and food purchase behavior
Consumers have incomplete information on food supply and limited information process-ing capacities. Characterized by bounded rationality, they often exhibit shoppprocess-ing behavior that is termed ‘routine response behavior’. (Howard, 1977, p. 10; Kaas, 1982) Based on ex-perience, personal and mass media communication, consumers apply decision rules which are supported by satisfactory results, until they receive a signal strong enough to make them revise their prior beliefs or established decision rules. In the following, we assume that in case of food safety three specific elements enter the purchase decision:
1. the perceived severity of a hazard;
Contrary to previous analyses of food safety valuation (Shin, 1991; Eom, 1994; Caswell, 1995; Hayes et al., 1995), accurate or technical figures on morbidity or mortality likeli-hood will not explicitly be considered. Instead, such figures might enter the individual’s perception process of the first two elements.
2.1. Severity of hazard
A key finding of recent psychometric research on food safety related risk perception processes is that the public comprehend risk in a way quite different from scientific prob-abilistic assessment, for which fatality likelihood plays a key role (Fife-Shaw and Rowe, 1996, p. 488). Subjecting individual hazard judgments to principal component analysis, Slovic et al. (1980), Sparks and Shepherd (1994) and Fife-Shaw and Rowe (1996) report that the most important component was related to the severity of a hazard. The second most important component comprised of characteristics related to familiarity and awareness of the hazard. In the first two of these studies, characteristics related to the probability or number of people being exposed, however, loaded on the factor that was only third most important. Fife-Shaw and Rowe (Fife-Shaw and Rowe, 1996, p. 492) found that these characteristics did not load on a separate third factor. Instead, the number of people being harmed, which might serve as a probability proxy measure, loaded highly on the first component, which related to perceived severity. The finding that technical information on fatality likelihood is not fully or not correctly considered by consumers is also supported by experimental studies. Shin (Shin, 1991, p. 20) notes that there may exist a lack of response to specific risk measures such “. . . that participants were responding to the presence of risk rather than to the level of risk.” This view is supported by Eom (Eom, 1994, p. 769), who concludes that “. . . high price premiums may simply reflect consumers’ desires to assure that the food is safe rather than reflect particular amounts of risk reduction.”
2.2. Different types of suppliers with respect to reliability
be identified, while a whole set of other factors might have contributed to that outcome, too. And even in cases of acute infections, consuming the bad food is not the only neces-sary condition for contracting the disease. The consumer must also have had some specific predisposition to contracting it at the time of consumption. So, if he does not contract the disease he will never know, whether this was because the item he ate was safe or because he just was not susceptible to infection at that time.
Second, due to this strong credence component, the consumer usually cannot rely on personal experience for evaluation of suppliers. Information, other than that on final prod-uct quality, becomes thus more valuable for risk assessment, e.g. indicators of attitude and behavior of suppliers. For example, judgments of a seller’s reliability might then range from: “He is reliable, because he takes consumer protection serious and does all he can to avoid putting the buyer at risk” to “He’s unreliable or even opportunistic, because he deliberately takes the chance of putting consumers’ health at risk, if direct financial losses do not result.” Major advantages of such indicators are that they are much less complex than information on hazard likelihood and that they help to identify the most promising alterna-tives for directed search. Furthermore, due to the great number of suppliers, consumers can reduce complexity further by assigning reliability judgments to types of suppliers rather than individually. This conforms with the tendency in human information processing to think in categories rather than in continuous dimensions (Grunert, 1982; Ozanne et al., 1992).
2.3. Trust in individual suppliers
The previous two assumptions reflect the consumers’ attempt to reduce the complexity of food purchase decisions when food safety is relevant. This is rational when considering the volume of information that would be necessary for fully informed choices. According to Ravenswaay and Hoehn (Ravenswaay and Hoehn, 1996, p. 1293), this would require expert knowledge of marginal product contamination levels, the effects of adequate averting actions, health effects of exposure to contaminants and of corresponding mitigation. This is unrealistic and would not even eliminate the strong credence component. Halk (Halk, 1992, p. 20), therefore, identifies trust as a necessary means to reduce uncertainty to an acceptable level and to simplify decisions in all areas of an ever more complex life2. With respect to food safety in particular, this view is supported by empirical evidence that consumers differentiate amongst brands, retailers or product origins with respect to reliability. In a consumer survey, Becker et al. (1996) found that ‘trust/safety’ was the fourth most important reason to choose a particular retailer for meat products. Henson and Northen (Henson and Northen, 1998, p. 5), presenting data from a telephone survey in six EU countries, report that German respondents ranked the country of origin as most helpful for assessing the safety of beef. A more general differentiation between countries of origin with respect to trust is also reported by Haase (1998).
In addition to the three elements described above, the revision process after receiving relevant information has to be outlined. We assume that such learning processes can be
accurately portrayed by Bayesian revision processes, as has been applied to mortality risk perception by Hakes and Viscusi (1997), and to food safety in particular by Eom (1994) and in a slightly modified way by Liu et al. (1998). These studies underscore the importance of the dynamic aspects of risk perception and the usefulness of Bayesian models as an optimizing framework for economic analysis.
3. An adaptive model of consumer’s food safety assessment
To capture individual behavior as described above a model is developed which describes the change in trust of consumerKin the so far preferred supplier3 Jafter receiving infor-mation about the safety of productXsold byJorJs conduct with respect to food hygiene regulation.
3.1. Assumptions
K distinguishes between two different groups of suppliers,A and B, with respect to reliability. TypeAis regarded as reliable, while typeBsuppliers are regarded as less reliable or even opportunistic. Thus,Kjudges the probabilityP(G|A) of purchasing an unsafe unit
XG from type A suppliers to be smaller than P(G|B), the respective failure probability assigned to typeB. As a result of previous information and experience,Kalways purchases from supplierJ, which he believes to be of typeA. But since Kdoes not possess perfect information, he cannot be sure thatJactually belongs to that group. Therefore, his trust in
Jto be reliable is represented by the probabilityPJ, leaving a residual probability of 1−PJ
forJbelonging to typeB. The probability of the eventPGto purchase an unsafe item from Jis:
PG=PJP (G|A)+(1−PJ)P (G|B) (1)
Due to the variety and availability of food items,Kcan always replaceXwith the substitute
Y(say, beef with pork), whose health risk he regards as negligible. For this decision, in addition to subjective probabilities he needs to know:
UX+: utility from a normal, i.e. safe unit ofX,
UX−: (dis-)utility from a hazardous unitXG;UX−<0, and
UY utility from a unit ofY;UY<UX+.
For simplicity of analysis,UX+andUYare deterministic and defined as utility net of price.
Both utility figures are rather small, as only a marginal food purchase is considered. |UX−| is the perceived severity of a food safety hazard4, which can be expected to be much larger thanUX+, if the consumer is aware of the hazard.
3‘Suppliers’ may refer either to different brands, different product origins, or different retailers offering a generic product. While this distinction is rather obvious for brands and origins, some explanation is in order for retailers. For example, most fresh meat in Germany is marketed as a generic product. Since the producer remains anonymous, reliability judgements can only apply to retailers, as is also the case for their own label products.
4SinceU−
3.2. Model analysis
The model analysis follows the typical path of information release in a food safety crisis: negative information, i.e. on a food safety incident concerningJs supply ofX, is followed by positive information in Js effort to restore confidence. But first, we will explore the conditions under which a potentially unsafe product will be bought at all.
3.2.1. Conditions for purchasing potentially unsafe food products
AssumeKs state-dependent preferences are represented by an expected utility function into which his health state after consuming a unit ofXorYenters as an argument.Xwill only be bought, if its expected utility is greater than that of the substituteY:
UX++UX−PG> UY (2)
ReplacingPGwith Eq. (1) and rearranging yields:
UX+−UY
(−1)UX− > PJP (G|A)+(1−PJ)P (G|B) (3)
Both sides of the inequality are strictly greater than zero. On the left hand side, the numerator is quite small, while the denominator is large. Therefore, the entire ratio is positive, but very small. Thus, forXto be bought at all, the right hand side must be even smaller. As can be seen from Eq. (3), the purchase likelihood increases:
• asP(G|A) decreases; • asP(G|B) decreases; and • asPJ increases.
Hence, a small failure probability ofbothtypes of suppliers increases the probability that
Kpurchases a unit ofXfromJ. Only whenKs confidence inJis absolute, i.e. 1, the failure probability of the less reliable supplier type looses its impact on Ks purchase decision, which then solely depends onP(G|A) to be small.
3.2.2. Consumer confidence after product failure
Assume one or more units ofXsold byJhave caused health problems orJhas violated health regulation, andKlearns about that — either through personal experience, personal communication or media reports. He now revises his prior belief about the reliability ofJ
according to Bayes’ Rule to the posterior probabilityPPJ. This is the conditional probability
of the state ‘Jis of typeA’ after having observed the event ‘Xis unsafe’:
PPJ =
PJP (G|A)
PJP (G|A)+(1−PJ)P (G|B)
(4)
DefineDas the difference betweenKs trust inJbefore and after this new information:
D=PJ−PPJ (5)
Dis always greater than zero (Appendix A), so that a loss of trust is the (expected) result of receiving negative information on food safety. The partial derivative ofDwith respect to
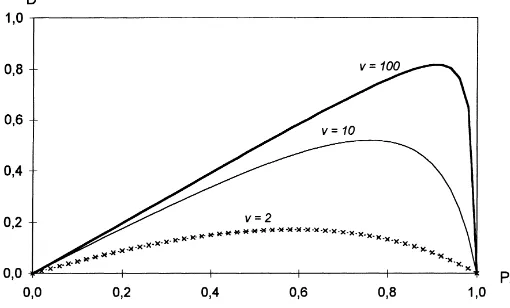
Fig. 1. Loss of confidenceDafter a food scare depending on prior confidencePJand reliability ratiov.
impact of the two subjective failure probabilities results an increase in the loss of confidence, as the ratiovbetween the two probabilities increases:
v= P (G|B)
P (G|A); with v >1, as P (G|B) > P (G|A). (6) The maximum of the partial derivative ofDwith respect toPJ is determined by this
relia-bility ratio and, of course, the prior level of trust (Appendix C). Thus, both the extent of the confidence loss and the value ofPJwhere the maximum is situated, increase, asvincreases
(see Fig. 1). The smaller the perceived discrepancy in subjective failure probabilities be-tween different types of suppliers, i.e. asvapproaches 1, the smaller the loss in trust after a food scare. And only when the prior confidence is very close to 1, the loss of confidence after a food scare is small. These interdependencies create a dilemma for food suppliers, i.e. processors, retailers or generic marketing agencies. They are forced to adapt quality and information strategies to growing health concerns. They can do so by building up a high a priori reliability reputation for their products, thus increasingPJ. Additionally, they
can position themselves as having a much smaller failure probability than competitors, thus increasingv. The dilemma arises, as information on the actual levels ofPJ andvcreated
by marketing efforts is incomplete ex ante. If, e.g.PJ has increased but still is not close
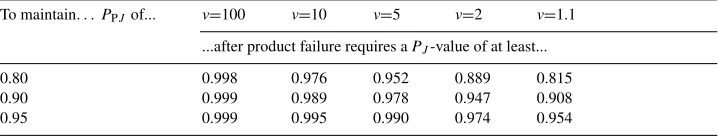
enough to one, and/or ifvhas become too large, these efforts might very well lead to a critical loss in confidence after product failure, instead of protecting the producer against it. This situation is shown in Table 1. It exhibits the minimum level ofPJ that is necessary
to guarantee a certain level ofPPJ after product failure. The figures appearing in Table 1
clearly show that, asvincreases,PJhas to increase, too, in order to safeguard the producers’
reliability reputation against product failure.
3.2.3. Regaining consumer confidence
Table 1
Minimum values of prior confidencePJnecessary for maintaining posterior confidencePPJafter product failure To maintain. . .PPJof... v=100 v=10 v=5 v=2 v=1.1
...after product failure requires aPJ-value of at least...
0.80 0.998 0.976 0.952 0.889 0.815
0.90 0.999 0.989 0.978 0.947 0.908
0.95 0.999 0.995 0.990 0.974 0.954
J, with the posterior probabilityPPJ entering the Bayesian revision process as the new a
priori probability. The result is the posterior probabilityPPPJ, which can also be interpreted
as the conditional probability of the state ‘Kis of typeA’, after having observed the two consecutive events ‘Xis unsafe’ and ‘Xis safe’:
PPPJ =
PPJ(1−P (G|A))
PPJ(1−P (G|A))+(1−PPJ)(1−P (G|B))
(7)
Confidence is always — at least partially — regained:PPPJ>PPJ always holds (Appendix
D). Under the conditionP(G|A)+P(G|B)<1, however, trust is not fully restored:PJ>PPPJ
(Appendix E). Although this confines the general assumption 1>P(G|B)>P(G|A)>0, the outcome of only partial recovery is still quite likely, when considering thatP(G|A) has to be rather small forXto be bought in the first place. Then, to violateP(G|A)+P(G|B)<1, would requireP(G|B) to be very close to 1. Although this cannot be excluded a priori, it has to be characterized as a rather extreme subjective judgment.
Now define DD as the remaining loss in trust, i.e. the difference between the original and the twice revised confidence:
DD=PJ−PPPJ (8)
To create a measure for the effort that is necessary for regaining consumer confidence, this remaining loss in confidence has to be compared to the first one,D. This is expressed in the ratioR:
R= DD
D =1−
P (G|A)P (G|B)
PJP (G|A)(1−P (G|A))+(1−PJ)P (G|B)(1−P (G|B))
(9)
AssumingP(G|A)+P(G|B)<1 holds, values ofRrange from 0 to 1. The closerRis to one (zero), the greater (smaller) is the amount of positive information necessary for restoring the original level of consumer confidencePJ.
The partial derivative ofRwith respect toPJ is negative (Appendix F). Thus, increasing
levels of confidence prior to a food scare generally help to regain confidence, while the impact on losses in confidence in the first place is ambiguous. The partial derivatives of
Rwith respect toP(G|A) andP(G|B) are both negative, too (Appendix F). This points to a potential dilemma inherent in the management of food safety crises. On the one hand,
4. Discussion
The first part of the discussion is directed at establishing the link between individual risk assessment in a marginal purchase situation, as modeled above, and aggregate demand response. The role of the media in this link is highlighted. In the second part implications are derived from the model analysis for information strategies of food suppliers.
As discussed under Section 3.2.1, demand response to negative information on food safety requires consumers to be aware of a food safety-related hazard, i.e. the potential damage is perceived to be large. The above analysis would not apply to consumers who are convinced to be resistant to a specific hazard or are not aware of it. If, however, consumers are aware of a potential health threat, there is good reason to expect that the potential damage will probably be perceived as very high by a considerable number of consumers. Food shopping is usually done by one person for the entire household. A potential hazard is thus not restricted to the buyer himself, but is instead multiplied. Herrmann (Herrmann et al., 1997, p. 518), for example, found that the presence of young children in the household lead to reduced apple consumption during the Alar crisis in the late 1980s. Closely related is the finding of Fife-Shaw and Rowe (1996), that the perception of hazard severity includes also concern for others, especially vulnerable groups. Additionally, the risk from unsafe food is usually taken involuntarily and cannot be controlled, which intensifies the perception of hazard severity (Jungermann and Slovic, 1993).
Herrmann (Herrmann et al., 1997, p. 513) point out that there are a number of typical characteristics of a food safety incident which make intensive media coverage likely. There-fore, the media play a key role for the speed and massiveness of consumer response to a food safety crisis: through the media many more people hear of and might thus potentially react to such an incident than could realistically be actually harmed. But this immediacy of news reports is not only linked with the damage of food safety hazard to be perceived as large by a great number of people. In many cases it also has an impact on the creation of subjective probabilities, i.e. especially the confidence that a supplier is reliable. Usually, awareness of a potential health risk is originally created by news reports, so that consumers, often for the first time ever, face the task of assessing their trust in a supplier’s reliability. Only in extreme cases of brand loyalty, this trust can be expected to be absolute. It is much more likely that due to the lack of previous information, initial confidence in the supplier will be moderate, with further information sought for an improved assessment of the supplier. But as shown above, it is exactly in this medium range of consumer confidence in a supplier that the loss of confidence is largest, the extent of it depending on the constellation of subjective failure probabilities assigned to reliable and less reliable types of suppliers.
lead to a lesser weight of positive news in the revision process. News on product failure or misbehavior of suppliers are usually perceived as factual evidence of misconduct within the supplier’s responsibility. Contrary to that, information on the same supplier’s compliance with food safety regulation just cannot serve as a proof for his supply being unobjectionable, the remaining doubt being due the credence character of food safety. Additionally, media communication research revealed that sources of information are trusted differently by the public. Frewer et al. (Frewer et al., 1996, 479 ff.), for example, point out that both government and business representatives are only moderately trusted, if their statements are perceived to be made in an obvious self-interest.
Finally, the results have some implications for a supplier’s information strategy with respect to food safety. Demand analyses, as for example in Liu et al. (1998), have identified the impacts of a food safety crisis at an aggregate level. At the aggregate, however, the option to shift from one brand or retailer to another, as implied by our analysis, cannot be accounted for. There is strong evidence for such shifts in case of BSE in Germany: the share of local butcheries in fresh beef sales rose from 13 to 20 percent between March and May 1996 (Loy, 1999, p. 254). Consumer surveys indicate that these changes in the supply structure are primarily based on the local butchers’ being personally trusted for providing safe products of regional origin.
As our model analysis indicates, such a very high level of trust is the most effective protection against loss in trust. So single companies or producers’ organizations at a national or regional level have an incentive to target their information strategies at reaching such levels. Here, the model analysis offers one clearly interpretable prescription: in their attempt to create trust, suppliers should not discriminate competitors on the grounds of food safety, while highlighting their own reliability. As this will increase the perceived discrepancy between different supplier types, consumer confidence and thus purchase probability will be greatly reduced in case of a food safety crisis.
Appendix A
For the sake of tractability and readability the following shall hold for the appendix:
P (G|B)=B; P (G|A)=A.
To show thatPJ>PPJ, first the opposite is assumed:PJ<PPJ
PJ <
PJA
PJA+(1−PJ)B ⇔
PJA+(1−PJ)B < A⇔B−A < PJ(B−A)
(A.1)
This cannot be the case, because: 0<PJ<1 andB−A>0. Therefore,PJ>PPJ holds.
Appendix B
D=PJ−
PJA
PJA+(1−PJ)B
∂D
Under the model assumptions, numerator and denominator are each greater than zero. So the entire ratio is greater than zero, too. By multiplying the ratio with (−1), the derivative becomes smaller than zero.
Under the model assumptions, numerator and denominator are each greater than zero. So the entire ratio is greater than zero, too.
Appendix C
First, to show thatD, aside ofPJ, only depends on the reliability ratiov,Bis replaced
byvAin formula (4) forPPJso thatDbecomes:
Then, to show that for a givenPJ,Dincreases withv, Eq. (C.1) is differentiated:
∂D
The denominator is always greater than zero, under the model assumptions the numerator is so, too. So the entire ratio, and thus the derivative ofDwith respect tovis greater than zero, too. Finally, it is to be shown that the position of the maximum loss of confidence alongsidePJ moves towards 1, asvincreases. For this purpose, Eq. (C.1) is rearranged:
D=PJ−
In a second step,Dis differentiated with respect toPJ:
This is a global maximum which is always positioned in the [0 1] interval ofPJ, wherePJ∗
smaller than or equal to zero, the following condition would have to hold:
z≤pz2−z⇒z2
≤z2−z (C.6)
Sincez>1, this cannot be the case. Therefore,PJ∗>0 holds. On the other hand, were PJ∗ greater than or equal to 1, the following condition would have to hold:
z−pz2−z≥1⇒(z−1)2≥z2−z⇒z2−2z+1≥z2−z⇒z≤1 (C.7) This contradicts the fact thatz>1. Therefore,PJ∗is always smaller than 1.
In a fourth and last step, it is shown that P∗
J, the position of the maximum loss of
confidence increases withv. For this purpose,PJ∗is differentiated with respect toz:
∂PJ∗
∂z =1−
(2z−1)
2√z2−z (C.8)
For the partial derivative to be negative (positive), the ratio to the right of the minus sign must be greater (smaller) than 1. For it to be smaller than 1, the following would have to hold:
(2z−1)
2√z2−z <1⇔z− 1 2 <
p
z2−z⇒z2−z+1 4 < z
2
−z (C.9)
This would imply that 1/4 be smaller than zero, an obvious contradiction. Therefore, the partial derivative ofPJ∗with respect tozis always smaller than zero. Sincezdecreases asv
grows larger, however, the position of the maximum loss of confidence increases, i.e. moves towards 1, asvincreases.
Appendix D
To show thatPPPJ>PPJ, first the opposite is assumed:PPPJ<PPJ. SubstitutingPPPJ by
Eq. (7):
PPJ(1−A)
PPJ(1−A)+(1−PPJ)(1−B)
< PPJ (D.1)
Dividing byPPJ and rearranging yields:
(1−A) < PPJ(1−A)+(1−PPJ)(1−B)⇔(1−A) < (1−B) (D.2)
This would requireAto be greater thanB, which contradicts our assumption.
Appendix E
For simplification Eq. (7) is divided byPPJ.
PPPJ =
1−A
(1−A)+(1/PPJ −1)(1−B)
Since the findings of the model analysis relate to the starting situation,PPJ has to be
replaced with Eq. (4) soPPPJ can be expressed as function ofPJ,BandA:
PPPJ =
1−A
(1−A)+(PJA+(1−PJ)B/PJA)−(PJA/PJA)(1−B)
(E.2)
PPPJ =
PJA(1−A)
PJA(1−A)+(1−PJ)B(1−B)
(E.3)
To show thatPJ>PPPJ, given thatA+B<1 holds, first the opposite is assumed:PJ<PPPJ
PJ <
PJA(1−A)
PJA(1−A)+(1−PJ)B(1−B) ⇔
PJA(1−A)
+(1−PJ)B(1−B) < A(1−A) (E.4)
PJ ⇔B(1−B) < A(1−A) (E.5)
The maximum of a functionQ=C(1−C) is atC=0.5. The larger |0.5−C| becomes, the smallerQgets. Due to the basic assumption 1 >B>A> 0, Eq. (E.5) holds, if:
(a)B>A≥0.5 or if
(b)B> 0.5and A<0.5and B> 1−A
Each of these cases violatesB+A<1. Therefore,PJ>PPPJ is only true, ifB+A<1 holds.
Appendix F
R=PJ−PPPJ PJ −PPJ =
(PJ −(PJA(1−A))/PJA(1−A)+(1−PJ)B(1−B))
PJ−(PJA/PJA+(1−PJ)B) ⇔
R=(A(1−A)(PJ−1)+(1−PJ)B(1−B))(PJA+(1−PJ)B) (PJA(1−A)+(1−PJ)B(1−B))(A(PJ −1)+(1−PJ)B) ⇔
R= (B(1−B)−A(1−A))(PA+(1−PJ)B) (PJA(1−A)+(1−PJ)B(1−B))(B−A) ⇔
R= (1−A−B)(PJA+(1−PJ)B) PJA(1−A)+(1−PJ)B(1−B)
=PJA+(1−A)+(1−PJ)B(1−B)−AB PJA+(1−A)+(1−PJ)B(1−B)
(F.1)
R=1− AB
PJA+(1−A)+(1−PJ)B(1−B)
(F.2)
∂R ∂PJ =
AB(A(1−A)−B(1−B)) (PJA+(1−A)+(1−PJ)B(1−B))2
Under the given model assumptions, the partial derivatives ofRwith respect toAandB
Andersen, E.S., 1994. The evolution of credence goods: a transaction approach to product specification and quality control, MAPP Working paper No. 21, Aarhus.
Becker, T., Benner, E., Glitsch, K., 1996. Wandel des Verbraucherverhaltens bei Fleisch (Changing consumer behavior: the case of meat). Agrarwirtschaft 45, 267–277.
Caswell, J. (Ed.), 1995. Valuing Food Safety. Westview Press, Boulder.
Caswell, J., Mojduszka, E., 1996. Using information labeling to influence the market for quality in food products. American Journal of Agricultural Economics 78, 1248–1253.
Darby, M.R., Karni, E., 1973. Free Competition and the Optimal Amount of Fraud. Journal of Law and Economics 16, 67–88.
Eom, Y.S., 1994. Pesticide residue risk and food safety valuation: a random utility approach. American Journal of Agricultural Economics 76, 760–771.
Fife-Shaw, C., Rowe, G., 1996. Public perceptions of everyday food hazards: a psychometric study. Risk Analysis 16, 487–500.
Frewer, L.J., Howard, C., Hedderley, D., Shepherd, R., 1996. What determines trust in information about food-related risks? Underlying psychological constructs. Risk Analysis 16, 473–486.
Grunert, K., 1982. Informationsverarbeitungsprozesse bei der Kaufentscheidung: Ein gedächtnispsychologischer Ansatz (Information processing in purchase decisions). Peter Lang Verlag, Frankfurt.
Haase, M., 1998. Ausgewählte Ergebnisse der aktuellen Studie zum Image der Landwirtschaft (A study on the image of agriculture: selected results). Berichte über Landwirtschaft 76, 615–631.
Hakes, J.K., Viscusi, W.K., 1997. Mortality risk perceptions: a Bayesian approach. Journal of Risk and Uncertainty 15, 135–150.
Halk, K., 1992. Bestimmungsgründe des Konsumentenmisstrauens gegenüber Lebensmitteln (Determinants of Consumers’ Distrust toward Food). IFO, Munich.
Hayes, D.-J., Shogren, J.F., Shin, S.Y., Kliebenstein, J.B., 1995. Valuing food safety in experimental auction markets. American Journal of Agricultural Economics 77, 40–53.
Henson, S.J., Northen, J., 1998. Consumer Perceptions of beef safety and the implications for the quality policy, Manuscript of presentation at the 56th EAAE-Seminar Long term prospects of the beef industry, Paris, 26–27 February 1998.
Herrmann, R., Warland, R.H., Sterngold, A., 1997. Who reacts to food safety scares? Examining the Alar crisis. Agribusiness 13, 511–520.
Howard, J.A., 1977. Consumer Behavior: Application of Theory. McGraw-Hill, New York.
Jungermann, H., Slovic, P., 1993. Charakteristika individueller Risikowahrnehmung (Characteristics of individual risk perception). In: Bayerische Rück (Ed.), Risiko ist ein Konstrukt (Knesebeck, Reihe Gesellschaft und Unsicherheit, Munich 2, 89–108.
Kaas, K.-P., 1982. Consumer habit forming, information acquisition and buying behavior. Journal of Business Research 10, 3–15.
Liu, S., Huang, J.-C., Brown, G.L., 1998. Information and risk perception: a dynamic adjustment process. Risk Analysis 18, 689–699.
Maney, A., Plutzer, E., 1996. Scientific information, elite attitudes, and the public debate over food safety. Policy Studies Journal 24, 42–56.
Nelson, P., 1970. Information and consumer behavior. Journal of Political Economy 78, 311–329.
Ozanne, J.L., Brucks, M., Grewal, D., 1992. A study of information search behavior during the categorization of new products. Journal of Consumer Research 19, 453–463.
Ravenswaay, E.O., Hoehn, J.P., 1996. The theoretical benefits of food safety policies: a total economic value framework. American Journal of Agricultural Economics 78, 1291–1296.
Sharlin, H.I., 1987. Macro-Risk, Micro-Risk, and the Media: the EDB-Case. In: Johnson, B.B., Covello, V.T. (Ed.), The Social and Cultural Construction of Risk — Essays on Risk Selection and Perception. Reidel, Dordrecht. Shin, S.Y., 1991. The economics of food safety: an experimental approach, Ph.D. Iowa State University, IA. Slovic, P., 1992. Perceptions of risk: reflections on the psychometric paradigm. In: Krimsky, S., Golding, D. (Ed.),
Social Theories of Risk. Praeger, Westport.
Slovic, P., Fischhoff, B., Lichtenstein, S., 1980. Facts and fears: understanding perceived risk. In: Schwing, R.C., Albers, W.S. (Eds.), Societal Risk Assessment: How Safe is Safe Enough? Plenum, New York.