256 (2001) 85–97
www.elsevier.nl / locate / jembe
Longevity determines sizes of an adult intertidal barnacle
,1 *
C.J. Jeffery , A.J. Underwood
Centre for Research on Ecological Impacts of Coastal Cities and Institute of Marine Ecology,
Marine Ecology Laboratories, A11, University of Sydney, Sydney, NSW 2006, Australia Received 25 May 2000; received in revised form 16 October 2000; accepted 17 October 2000
Abstract
The small honeycomb barnacle Chamaesipho tasmanica Foster and Anderson often forms continuous sheets covering the substratum at mid-shore levels of sheltered rocky shores but also occurs in sparse distributions on exposed shores, and on higher levels of sheltered shores, in south-eastern Australia. Larger barnacles are generally found in more exposed and higher areas. Effects of each site on ultimate sizes of barnacles were therefore examined by measuring growth of barnacles of the same cohort at sheltered and exposed shores from the end of 1989 to the end of 1992. Because Chamaesipho varied in size among sites, and because size was not necessarily representative of age, three growth models were proposed to explain this size differential. While rates of growth and periods of growth did not differ, differences in longevity were found to influence size so that larger barnacles survived longer and were more abundant on the more exposed shores. In fact, when barnacles were aged, it was found that a greater proportion of older barnacles (.3 years of age) occupied these exposed areas. It seems that site-specific characteris-tics influenced longevity in some places so that larger Chamaesipho continued to predominate in these areas. Crown copyright 2001 Published by Elsevier Science B.V. All rights reserved.
Keywords: Australia; Barnacle; Chamaesipho; Growth; Longevity; Models
1. Introduction
Environmental cues influence growth of barnacles (Crisp, 1960; Bertness, 1989; Bertness et al., 1991; Shkedy et al., 1995; Calcagno et al., 1997). Rates of growth in barnacles will vary under differing conditions of wave-exposure (Bertness, 1989;
*Corresponding author. Tel.:161-2-9385-1825; fax:161-2-9662-7995.
E-mail address: [email protected] (C.J. Jeffery).
1
Present address: Centre for Marine and Coastal Studies, University of New South Wales, Sydney, NSW 2052, Australia.
0022-0981 / 01 / $ – see front matter Crown copyright 2001 Published by Elsevier Science B.V. All rights reserved.
Bertness et al., 1991; Shkedy et al., 1995) and will also vary in species of barnacles where adjoining walls fuse (Connell, 1961; Luckens, 1975; Hui and Moyse, 1987). Bertness et al. (1991) recorded greater growth in Semibalanus balanoides in low tidal areas where barnacles were dense and where water velocity and wave-exposure were large, rather than in upper habitats or those with smaller wave-exposure or velocities. Crisp (1960) also found an association between increased current flow and growth of barnacles. Increased growth of Semibalanus in exposed habitats (Hatton and Fischer-Piette, 1932; Moore, 1934, 1935) can also be linked to reduced algal cover in these areas (Barnes, 1955). Similarly, Luckens (1970) found that the barnacle Chamaesipho
brunnea in New Zealand grew faster when submerged for longer periods but rates of
growth were density-dependent. That is, the more dense populations in the upper range of distribution of this species had slower rates of growth than sparse populations lower on the shore. In addition, Shkedy et al. (1995) showed that growth of Balanus amphitrite was fastest on upper levels with greatest exposure, rather than on middle and lower levels of the shore where barnacles were more dense.
Considerable variation in distribution and abundance of populations of the small honeycomb barnacle Chamaesipho tasmanica exists from place to place at the Cape Banks Scientific Marine Research Area (Sydney, Australia); small patches of larger barnacles often inhabit exposed areas, and higher levels of sheltered shores, whereas large numbers of smaller barnacles carpet the mid-littoral substratum on sheltered shores. It may be, therefore, that larger barnacles are generally found on these upper and more exposed shores because growth is fastest here. Apart from faster growth, adults may be of different sizes in different areas because they grow for longer periods or because they survive longer in some areas. Three models were therefore proposed to explain the differences in size of adult Chamaesipho in different sites at Cape Banks. The first model is that barnacles may grow faster at some sites — therefore finishing growth at a larger size in these areas. It was predicted that, if the same cohort of
barnacles were measured from juvenile (,1 mm) to adult sizes, rate of growth of these
juveniles in different areas should be correlated with the sizes of adults in these areas. The second model proposed that barnacles grow at the same rate, but have longer periods of growth in some areas. It was predicted that, if juveniles from the same cohort were measured from settlement, the periods during which barnacles in different areas grew should be correlated with sizes of adults in these areas. The third model is that barnacles keep growing, but live longer at some sites. Therefore, if juveniles from the same cohort were measured there should be a correlation between longevity of these juveniles and size of adults. Greater longevity will be recorded in areas where barnacles are relatively large.
2. Materials and methods
2.1. Study area
Chamaesipho tasmanica were studied on the mid-littoral shore of the Cape Banks
Australia (348009S, 1508159E). The study area faces south and is subjected to South-East winds, especially in winter (Short and Trenaman, 1992), which are associated with major pulses of cyprids arriving (Jeffery and Underwood, 2000).
Chamaesipho were therefore studied at six sites with different degrees of exposure,
varying from exposed to semi-exposed to protected sites. Each site in the mid-shore area was also divided into three vertical areas (low, mid and upper), determined by the distribution of Chamaesipho: the lower and upper levels delimited the distribution of this barnacle. These levels were not at the same sea level for each site (see Table 1), due to differences in exposure to wave-action. Barnacles were at higher levels on exposed shores with greater wave-action (Underwood, 1981). The six sites varied in height from 0.08 m above MLWS at low sheltered sites, to 3.00 m above MLWS at upper exposed sites (see Table 1).
Sites 1 and 2, exposed sites, were located on the western side of Cruwee Cove, facing south-west and south-east, respectively. Sites 3 and 4 were at sheltered sites in Cruwee Cove and faced south. Site 5, on the sheltered side of the headland, faced west and was semi-exposed. Site 6, an exposed site, was located on the eastern side of the northern headland of Botany Bay.
2.2. Size
In 1989, 6cm diameter replicates (n53) of mixed cohorts of barnacles were marked
with an inscribed metal tag cemented into the substratum at six sites and three heights (low, mid, upper) of Chamaesipho’s distribution on mid-shore levels at Cape Banks. These replicates were photographed in the field with a 35mm camera attached to a 26cm high brass tripod. The metal tags were used to match up and identify individual barnacles on processed black and white negatives in the laboratory. To do this, black and white negatives were mounted on an Image Analyser: Tracor Northern TN8502 / B computer with binocular microscope and camera attachments. The image of each field of
view of the binocular microscope at power 32.5 and equivalent to the size of the
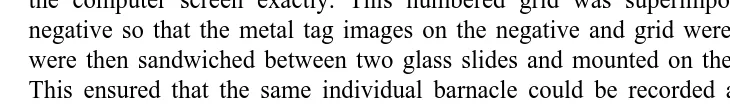
computer screen was 2.66 mm. A black and white negative of a grid (100 squares) was then prepared so that each grid square, when projected through the microscope, matched the computer screen exactly. This numbered grid was superimposed over the field negative so that the metal tag images on the negative and grid were matched up. Both were then sandwiched between two glass slides and mounted on the microscope stage. This ensured that the same individual barnacle could be recorded and measured over time. Populations of barnacles were mapped with this procedure so that at the end of each year, new or missing barnacles could be recorded.
Table 1
Height of sites sampled (m above Low Water Springs)
Site 1 Site 2 Site 3 Site 4 Site 5 Site 6
Low 2.07 1.64 0.08 1.02 1.17 2.95
Mid 2.29 1.74 1.31 1.17 1.24 3.00
Earlier studies used basal-length of barnacles as a measure of size and growth (Barnes and Powell, 1950; Crisp, 1960). In dense populations of Chamaesipho, shells of adults fuse, sometimes making shell measurements difficult. Aperture-length along the rostro-carinal axis was, however, used in studies on other local barnacles (Denley and Underwood, 1979; Otway and Anderson, 1985; Otway and Underwood, 1987). To determine whether aperture-length, rather than basal-length, is a good estimator of size and growth for Chamaesipho, aperture-lengths and shell-lengths of 10 barnacles selected randomly from each of low, mid and upper heights of Chamaesipho’s distribution at each of six sites were measured from black and white negatives photographed in October, 1989.
To determine the sizes of Chamaesipho in different places at Cape Banks, five barnacles were randomly selected and measured from black and white negatives of each of the three replicates nested in low, mid and upper heights of Chamaesipho’s distribution at six sites each year in October / November from 1989 to 1992.
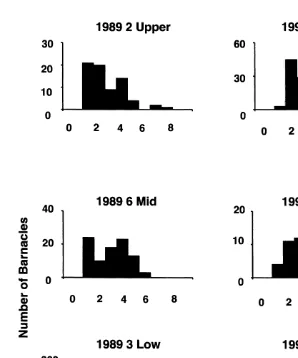
Size-frequency distributions of Chamaesipho at Sites 3, 6 and 2 at low, mid and upper heights, respectively, within the barnacles’ range, were also measured from black and
white negatives of each replicate (n53) in October, 1989 and October, 1992. Again,
aperture-lengths were measured with an Image Analyser.
2.3. Growth
Using an Image Analyser and black and white negatives of each replicate at low, mid and upper heights at six sites, barnacles were sampled independently at the end of each year from 1989 to 1992. Barnacles were also mapped so that they could be aged at the end of 1992, so that longevity (the numbers of years that individual barnacles survived from when first measured in 1989) could be recorded. Growth was therefore calculated over 3 years from first settlement in 1989.
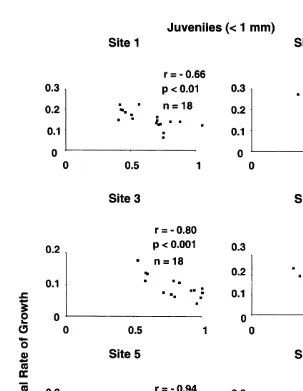
To test hypotheses derived from model 1, correlations were first calculated between
annual rates of growth and aperture-lengths for data at separate sites for juveniles (,1
mm) first measured in 1989 and the same cohort measured again in 1992. (Because in most places very few barnacles settled in 1989 and survived to the end of 1992, only two
juveniles in each replicate (n53) could be followed through adulthood over 3 years.
Data are incomplete for Sites 4, 5 and 6 because juveniles that settled in some replicates in 1989 failed to survive to the end of 1992 (see Fig. 3). The slope of regression b for
growth-rate of these juveniles (,1 mm) was used as the measure of growth-rate. So,
correlations were calculated on b (see Fig. 3) at each of six sites from 1989 to 1992 and
mean size of 30 adults (.1 mm) randomly chosen from low, mid and upper heights
within Chamaesipho’s distribution at each site. Correlations were also calculated between mean annual growth-rates of seven juveniles (because only seven juveniles
survived at Site 6 in 1992) and mean size of 30 adults (.1 mm) at each of six sites.
To test hypotheses derived from model 2, aperture-lengths of two juveniles (,1 mm)
from each replicate (n53) at low, mid and upper heights of Chamaesipho’s distribution
extrapolating down to the x-axis from where each graph line first decreased in slope (see Fig. 5). A correlation between periods of growth and size of adults at each site was then calculated.
To test hypotheses derived from model 3, 15 small (1–2 mm) barnacles were randomly selected at each site and were traced from maps of replicates from 1989 to 1992. The number of years that each of these barnacles survived (longevity) was recorded. Correlations were then calculated between mean number of years that these
barnacles survived and mean size of 30 adults (.1 mm) randomly selected from six
sites. Also, the percentage of older barnacles (.3 years of age) in 10 places in areas
where barnacles were relatively large was compared with 10 places in those areas where barnacles were relatively small.
Annual rates of growth were calculated as: R5log(L /L ) /t where R, rate of growth;t 0
L , aperture-length at time t; L , aperture-length at time zero; and t, time in years (seet 0
Denley and Underwood, 1979; Underwood, 1984).
3. Results
3.1. Size
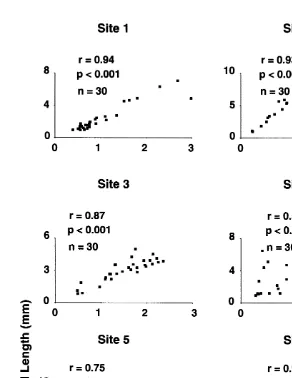
Aperture-length was positively correlated with shell-length (Fig. 1) indicating that aperture-length is a good estimator of size and growth in this species. The largest barnacles were found at exposed Site 6 and the smallest at sheltered Site 3. Barnacles were generally larger on mid and upper heights at Cape Banks (Fig. 2; Tables 2 and 3). Size differences were recorded among sets of replicates on semi-exposed Site 5 and exposed Sites 1, 2 and 6 (see Table 1).
3.2. Growth
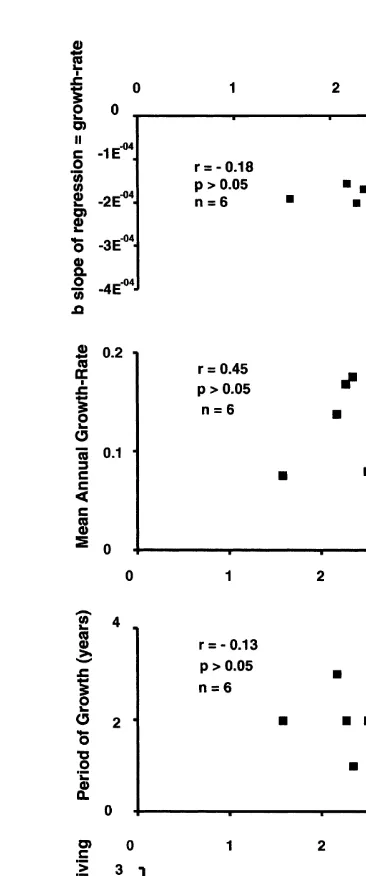
When correlations were calculated on b the slope of regression from Fig. 3 and
between mean size of adults (.1 mm) at each site, no significant relationship was found
(Fig. 4a and Spearman’s rank correlation, r5 20.2, P50.35). Nor was there a
significant correlation between annual growth-rates of juveniles first measured in 1989 and later in 1992 and mean size of adults at each site (Fig. 4b and Spearman’s rank
correlation, r50.37, P50.23).
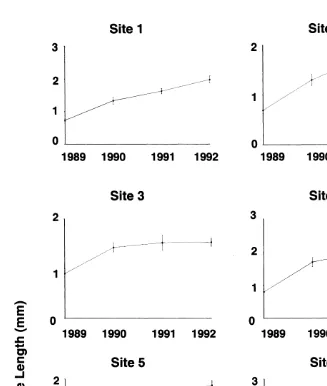
When juveniles (,1 mm) were first measured at the end of 1989 and individuals of
the same cohort were measured at the end of each year up to the end of 1992 so that periods of growth (years) at each site could be estimated (see Fig. 5), periods of growth
were found not to vary among sites (Fig. 4c and Spearman’s rank correlation, r5 20.34,
P50.26).
There was a relationship between years surviving (longevity) of small (1–2 mm) barnacles and mean size of adults at each site, although not statistically significant (Fig.
4d and Spearman’s rank correlation, r50.66, P50.08). That is, where barnacles were
Fig. 1. Relationship of shell-length (mm) and aperture-length (mm) of Chamaesipho at six sites. Correlations were calculated separately for each site on pooled raw data from 10 barnacles randomly sampled from black and white negatives photographed in October, 1989 on low, mid and upper heights at each site.
recorded at the end of 1992 were compared in areas predominated by large and small
barnacles, respectively, a greater mean percentage of older barnacles (.3 years of age)
was found in areas predominated by large barnacles (60.36%; S.E.54.04) than in areas
with mainly small barnacles (19.27%; S.E.53.45). These results indicate that longevity
Fig. 2. Size-frequency distributions of Chamaesipho measured in three replicates on low, mid and upper heights at Sites 3, 6 and 2, respectively, in late 1989 and again in late 1992.
4. Discussion
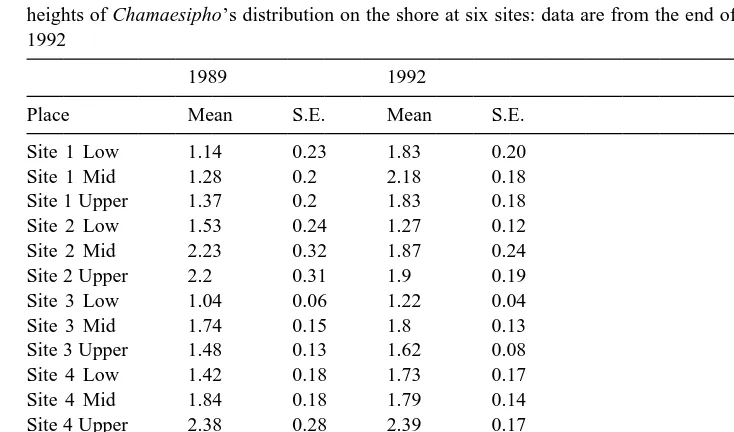
Table 2
Mean size (mm) of mixed cohorts of barnacles (n55) in each of three replicates nested in low, mid and upper heights of Chamaesipho’s distribution on the shore at six sites: data are from the end of each year in 1989 and 1992
1989 1992
Place Mean S.E. Mean S.E.
Site 1 Low 1.14 0.23 1.83 0.20
Site 1 Mid 1.28 0.2 2.18 0.18
Site 1 Upper 1.37 0.2 1.83 0.18
Site 2 Low 1.53 0.24 1.27 0.12
Site 2 Mid 2.23 0.32 1.87 0.24
Site 2 Upper 2.2 0.31 1.9 0.19
Site 3 Low 1.04 0.06 1.22 0.04
Site 3 Mid 1.74 0.15 1.8 0.13
Site 3 Upper 1.48 0.13 1.62 0.08
Site 4 Low 1.42 0.18 1.73 0.17
Site 4 Mid 1.84 0.18 1.79 0.14
Site 4 Upper 2.38 0.28 2.39 0.17
Site 5 Low 1.95 0.17 1.72 0.16
Site 5 Mid 2.1 0.31 1.87 0.15
Site 5 Upper 1.67 0.22 1.98 0.11
Site 6 Low 2.45 0.22 2.32 0.18
Site 6 Mid 3 0.41 2.56 0.26
Site 6 Upper 1.73 0.23 2.06 0.14
While variation in rates of growth and in periods of growth did not determine that larger barnacles occupied some areas at Cape Banks, longevity was found to influence the size differential of Chamaesipho. For example, longevity of small barnacles was correlated with mean size of adults at each site. Also, a greater percentage of older
barnacles (.3 years of age) occupied areas predominated by large barnacles, especially
Table 3
Fig. 3. Relationships between annual growth-rate and initial size of barnacles at each of six sites when two juveniles (,1 mm) were measured from each of three replicates on low, mid and upper heights at the end of 1989 and individuals in the same cohort were measured at the end of 1992. Numbers of cases varied because, in some replicates at Sites 4, 5 and 6, juveniles that settled in 1989 did not survive to the end of 1992.
on upper and exposed shores. That is, in areas with predominantly large barnacles, survival is greater and barnacles live longer. Differential longevity therefore functions to determine size distributions of Chamaesipho.
Fig. 5. Mean size of juvenile (,1 mm) barnacles (n518) measured at the end of each year from 1989 to 1992 in each of six sites at low, mid and upper heights of Chamaesipho’s distribution.
exposure and associated water column food concentrations (Bertness et al., 1991; Shkedy et al., 1995).
marginalba influenced distributions of Chamaesipho at sheltered Site 3 Low so that only
small barnacles of one or two cohorts inhabited these low areas. In very exposed areas
Morula are swept away by waves (Moran, 1985). Perhaps barnacles are generally larger
on exposed and upper shores such as Site 6 because there are fewer Morula to prey on barnacles. Larger barnacles may also be better equipped to withstand the greater physical extremes of temperature and desiccation in these exposed areas. It could also be that, because other studies have found that differential availability of food may influence growth in barnacles (Bourget and Crisp, 1975; Otway and Anderson, 1985; Bertness et al., 1991), availability of food may also influence longevity of Chamaesipho, and therefore the size differential. In fact, because these larger barnacles live in sparsely populated areas, it may be that an increased availability of food in relatively uncrowded conditions actually enhances longevity rather than growth. Overall, this research has found that site-specific influences are possibly important in processes determining longevity, resulting in site-specific differences in sizes of Chamaesipho at Cape Banks, but these processes are as yet unknown. Obviously more research is necessary to clarify these underlying processes.
Acknowledgements
This research was part of Carolyn Jeffery’s PhD thesis at the University of Sydney and was financed by the University Research Grants, funds from the Institute of Marine Ecology at the University of Sydney and an Australian Museum Postgraduate Grant. We thank Dennis Dwarte and Francis Chee at the University of Sydney’s Electron Microscope Unit for assistance with image analysis and Malcolm Ricketts from the School of Biological Sciences at the University of Sydney for his help with photographic work. Many thanks also to Marti-Jane Anderson for her comments on an earlier draft of the manuscript. [RW]
References
Barnes, H., 1955. The growth rate of Balanus balanoides (L). Oikos 6, 109–113.
Barnes, H., Powell, H.T., 1950. The development, general morphology and subsequent elimination of barnacle populations, Balanus crenatus and B. balanoides, after a heavy initial settlement. J. Anim. Ecol. 19, 175–179.
Bertness, M.D., 1989. Intraspecific competition and facilitation in a northern acorn barnacle population. Ecology 70, 257–268.
Bertness, M.D., Gaines, S.D., Bermudez, D., Sanford, E., 1991. Extreme spatial variation in the growth and reproductive output of the acorn barnacle Semibalanus balanoides. Mar. Ecol. Prog. Ser. 75, 91–100. Bourget, E., Crisp, D.J., 1975. Factors affecting deposition of the shell in Balanus balanoides (L.). J. Mar.
Biol. Assoc. UK 55, 231–249.
Calcagno, J.A., Lopez Gappa, J., Tablado, A., 1997. Growth and production of the barnacle Balanus amphitrite in an intertidal area affected by sewage pollution. J. Crustac. Biol. 17, 417–423.
Connell, J.H., 1961. The influence of interspecific competition and other factors on the distribution of the barnacle Chthamalus stellatus. Ecology 42, 710–723.
Denley, E.J., Underwood, A.J., 1979. Experiments on factors influencing settlement, survival, and growth of two species of barnacles in New South Wales. J. Exp. Mar. Biol. Ecol. 36, 269–273.
Hatton, H., Fischer-Piette, E., 1932. Observations et experiences sur le peuplement des cotes rocheuses par les Cirripedes. Bull. Inst. Oceanogr. Monaco 592, 1–15.
Hui, E., Moyse, J., 1987. Settlement patterns and competition for space. In: Southward, A.J. (Ed.), Barnacle Biology Crustacean Issues 5. Balkema, Rotterdam, pp. 363–376.
Jeffery, 1997. The ecology of the rocky shore intertidal barnacle Chamaesipho tasmanica in New South Wales, Ph.D. thesis, University of Sydney.
Jeffery, C.J., Underwood, A.J., 2000. Consistent spatial patterns of arrival of larvae of the honeycomb barnacle
Chamaesipho tasmanica Foster and Anderson in New South Wales. J. Exp. Mar. Biol. Ecol. 252, 109–127.
Luckens, P.A., 1970. Breeding, settlement and survival of barnacles at artificially modified shore levels at Leigh, New Zealand. N.Z. J. Mar. Freshwater Res. 4, 497–514.
Luckens, P.A., 1975. Competition and intertidal zonation of barnacles at Leigh, New Zealand. N.Z. J. Mar. Freshwater Res. 9, 379–394.
Moore, H.B., 1934. The biology of Balanus balanoides I. Growth rate and its relation to size, season and tide level. J. Mar. Biol. Assoc. UK 19, 851–868.
Moore, H.B., 1935. The biology of Balanus balanoides IV. Relation to environmental factors. J. Mar. Biol. Assoc. UK 20, 279–307.
Moran, M.J., 1985. Distribution and dispersion of the predatory intertidal gastropod Morula marginalba. Mar. Ecol. Prog. Ser. 22, 41–52.
Otway, N.M., Anderson, D.T., 1985. Variability of shell growth and morphology of the wall-plate junctions of the intertidal barnacle Tesseropora rosea (Cirripedia: Tetraclitidae). Mar. Biol. 85, 171–183.
Otway, N.M., Underwood, A.J., 1987. Experiments on orientation of the intertidal barnacle Tesseropora rosea. J. Exp. Mar. Biol. Ecol. 105, 85–106.
Shkedy, Y., Safriel, U.N., Keasar, T., 1995. Life-history of Balanus amphitrite and Chthamalus stellatus recruited to settlement panels in the Mediterranean coast of Israel. Israel J. Zool. 41, 147–161. Short, A.D., Trenaman, N.L., 1992. Wave climate of the Sydney region, an energetic and highly variable ocean
wave regime. Aust. J. Mar. Freshwater Res. 43, 765–791.
Underwood, A.J., 1981. Structure of a rocky intertidal community in New South Wales: patterns of vertical distribution and seasonal changes. J. Exp. Mar. Biol. Ecol. 51, 57–85.