Micrometeorological measurements of net ammonia fluxes over
oilseed rape during two vegetation periods
M.A. Sutton
a,∗, E. Nemitz
a,b, C. Milford
a, D. Fowler
a, J. Moreno
c, R. San José
c,
G.P. Wyers
d, R.P. Otjes
d, R. Harrison
e, S. Husted
f, J.K. Schjoerring
faCentre for Ecology and Hydrology (CEH), Edinburgh Research Station, Bush Estate, Penicuik, Midlothian, EH26 0QB, UK bDepartment of Physics, UMIST, Sackville Street, Manchester, UK
cDepartment of Computer Science, Technical University of Madrid (UPM), Madrid, Spain dNetherlands Energy Foundation (ECN), Petten ZG1755, Netherlands
eADAS Boxworth, Cambridge, UK
fPlant Nutrition Laboratory and Centre for Ecology and Environment, Royal Veterinary and Agricultural University (RVAU), Thorvaldsenvej
40, Frederiksberg C, Copenhagen, Denmark
Received 1 February 1999; received in revised form 19 May 2000; accepted 20 June 2000
Abstract
Ammonia fluxes were measured semi-continuously over oilseed rape (Brassica napus) as part of the EXAMINE North Berwick experiment during ripening of the growing plants and following cutting prior to harvest. The first period was investigated intensively, including flux measurements by continuous wet denuders at six heights, as well as by filter packs and passive flux samplers.
The aerodynamic gradient method and eddy covariance were applied to estimate friction velocity (u∗), sensible heat fluxes
(H) and latent heat fluxes (λE), with best estimates provided by inter-comparisons for each. The measurements represent a major exercise in data acquisition and processing, and provide approximately 30 days of semi-continuous fluxes. The largest errors in estimating the NH3fluxes arise from the concentration profile measurements. Fluxes from the ripening canopy were
bi-directional, varying in the range−150 to 180 ng m−2s−1, with the largest emission fluxes during the day, and both emission
and deposition occurring at night. Larger net emissions were measured following cutting of the rape (up to 620 ng m−2s−1),
with an overall mean of 57 ng m−2s−1compared with 16 ng m−2s−1prior to cutting. The patterns may be explained in relation to the expected major driving forces controlling exchange (cuticular fluxes, foliar compensation point, leaf litter emissions), the link to temperature/wetness, and the potential for overlying leaves to recapture emissions from leaf litter. The comparison with the passive estimates indicates that continuous measurements of several months duration are required to make a reliable assessment of the passive approach. © 2000 Elsevier Science B.V. All rights reserved.
Keywords:Aerodynamic gradient method; Eddy covariance; Continuous ammonia denuders; Bi-directional fluxes; Passive flux samplers
∗Corresponding author. Fax:+44-131-445-3943.
E-mail address:[email protected] (M.A. Sutton).
1. Introduction
Work on the quantification of atmospheric am-monia (NH3) exchange with crop canopies has been motivated both by the need to address the potential for nitrogen (N) losses from farming systems, as well as
net atmospheric budgets and atmospheric transport of NH3(e.g. Denmead et al., 1978; Harper et al., 1987; Schjoerring, 1991; Sutton et al., 1993b,c). The ear-lier studies were primarily driven by the agronomic interest, particularly since indirect measurements had often suggested large NH3 emissions (e.g. 10 up to >20 kg N ha−1yr−1) from the tops of plants (e.g. Wetselaar and Farquhar, 1980; Schjoerring et al., 1989). More recently it has become apparent that net fluxes of NH3with fertilized crop canopies are gener-ally smaller than 10 kg N ha−1yr−1 and therefore of less agronomic concern (Sutton et al., 1994; Schjo-erring, 1997). The result is that the primary current interest in quantifying plant–atmosphere NH3 fluxes with arable crops is to determine atmospheric bud-gets. From an atmospheric perspective, even where emissions are small, it is necessary to quantify net fluxes with agricultural surfaces since the amount either added to the atmosphere or removed by dry deposition affects the amounts available for transport further afield to sensitive ecosystems.
Although direct measurements of NH3fluxes have often shown increased emissions from senescing fo-liage compared with growing leaves (e.g. Farquhar et al., 1979; Harper et al., 1987; Husted et al., 1996), these tend to be smaller than estimated by the indi-rect approaches. One reason to explain this applies to studies estimating NH3fluxes from changes in15N. It is now clear that NH3fluxes with crops are generally bi-directional, both at different times for net fluxes, as well as for a given time, being the balance of upward and downward component fluxes (e.g. Sutton et al., 1995a,b, 1998). As a result, studies inferring NH3 losses using15N, may experience an isotopic substitu-tion of14NH3for15NH3(e.g. Janzen and Gilbertson, 1994; Harper and Sharpe, 1998), providing the com-ponent15NH3flux rather than net fluxes.
Direct field measurements of NH3fluxes with vege-tation have often been limited by the difficulty to cover extended time periods. Measurements using simpler batch NH3sampling methods, such as filter packs or bubblers (impingers) have been limited to sampling every few hours either covering a few consecutive days (e.g. Sutton et al., 1993b), or sampling occasional days through the growing season (e.g. Harper et al., 1987). More recent developments of continuous NH3 anal-ysers, such as the AMANDA system (Wyers et al., 1993), have permitted a more detailed temporal
anal-ysis of NH3fluxes with crops, e.g. considering fluxes over diurnal periods with averages being calculated for 10 min periods (e.g. Sutton et al., 1995a). While this approach has provided data with a temporal structure sufficiently detailed for model development, it has of-ten been limited to measurements for a few key days during short campaigns. The extensive resources re-quired for longer term continuous flux measurements (e.g. Plantaz et al., 1996; Erisman et al., 1998; Fowler et al., 1998; Wyers and Erisman, 1998) have so far not been applied to croplands.
Each of these sampling methods apply classical mi-crometeorological techniques to determine the NH3 fluxes from vertical concentration gradients measured above the canopy. The most usual approach is the aerodynamic gradient method, which requires deter-mination of the stability corrected turbulent diffusion coefficient for entrained properties such as heat and trace gases (KH) (e.g. Fowler and Unsworth, 1979; Sutton et al., 1993a). One of the constraints is that the individual sample runs should not include periods of significantly changing stability orKH, which effec-tively limits runs to a few hours at most, thereby multi-plying the effort required in long-term measurements. Recently, however, a new ‘passive flux sampling’ ap-proach has been proposed that permits sampling inte-gration with runs of several days or weeks (Schjoer-ring, 1995). The objective of this approach is to pro-vide a long-term, low-cost method, making compar-ison of fluxes between several different fields possi-ble. This method is recognized as an approximation, since effects of stability are only partly treated. Cur-rently, there is a need to test the performance of this approach against the classical aerodynamic gradient method.
from different sampling techniques. Fluxes measured before and after cutting are compared, and an initial inter-comparison is also made between the classical flux estimates and those from the passive flux sam-plers. The objective of this inter-comparison was to see whether the passive approach could reproduce the net flux over the campaign as measured by the classical aerodynamic gradient method. The microm-eteorological parameters and continuous NH3 fluxes presented here form the basis for further analysis and modelling as reported by Nemitz et al. (2000a–c).
2. Micrometeorological theory
2.1. Classical aerodynamic gradient method
The principle of the aerodynamic gradient method as applied here has been described in detail by Sutton et al. (1993a,b). The flux of NH3was calculated from vertical concentration profiles of NH3 coupled with turbulence information from either combined wind and temperature profiles or ultrasonic anemometers providing direct estimates of friction velocity (u∗),
sensible heat flux (H). The NH3concentration profile was used to determine a friction concentration (χ∗)
from which the micrometeorological flux estimate (F) was calculated as
where χ (z−d) is the air concentration at height z above the zero plane displacement (d),kthe von Kár-man constant (0.41), L the Monin–Obukhov length, andψH a semi-empirical correction for atmospheric stability being a function of(z−d)/L. A similar func-tion to Eq. (1) was applied for the wind profile esti-mate ofu∗.
whereψM is the stability correction relevant for mo-mentum transfer andz0is the roughness length of the
canopy. A combination approach to the aerodynamic gradient method was applied when using the ultra-sonic anemometer estimates ofu∗, which were
calcu-lated by eddy covariance. This was found as the mean of the product of the deviations of instantaneous net vertical (w′) and horizontal (u′) windspeed from the mean values
u∗= q
−u′w′ (4)
The aerodynamic gradient method and eddy covari-ance were similarly applied to determine fluxes of both sensible heat (H) and latent heat (λE), from gra-dient or fast-response measurements of temperature and vapour pressure, respectively. In the case of eddy covariance measurements of entrained properties the flux was calculated as
Fc= −q′w′ (5)
whereq is the scalar of the entrained property. For further details, see Moncrieff et al. (1997).
2.2. Passive flux sampling approximation to the aerodynamic gradient method
In the classical gradient method, NH3 is sampled at a constant rate, providing time-weighted aver-age concentrations. This contrasts with the passive flux sampling approach, where the NH3 denuders sample NH3 in proportion to windspeed, resulting in windspeed-weighted averages. The method uses hollow samplers, coated internally with an NH3 ab-sorbing surface, which are placed horizontally at several heights, either mounted in four fixed direc-tions (from which average concentradirec-tions may be calculated, Schjoerring, 1995) or mounted on a wind vane and thereby kept facing into the wind (Hansen et al., 1998). Given the tube dimensions, a known relationship is established between windspeed and sampling rate allowing estimation of the horizontal flux at a particular height (Fhz). In the simplest case of a denuder directly oriented into the wind
Fhz= M π r2K11t
(6)
the flow rate through the tube in relation to windspeed as constrained by the hole at one end (determined at 0.77 by wind tunnel studies, Schjoerring et al., 1992). Since the denuders sample directly in proportion to windspeed, division ofFhzby the mean windspeed for a sampling period, provides the windspeed weighted concentration (χu)
Net vertical fluxes of NH3are then estimated using the mean profiles ofχu(z−d)andu(z−d)
substi-tuted into Eqs. (1) and (3), respectively. In order forM to be sufficiently accurate, sampling periods are typi-cally >3 days, and the stability termsψHandψM are therefore neglected. Stability effects are partly dealt with, however, by preferentially sampling during peri-ods of higher windspeeds, when the error of neglecting the stability correction is smallest. It is acknowledged that this approach contains large approximation and empiricism. Nevertheless, it is of interest since it pro-vides a much cheaper means of estimating long-term fluxes than the classical approaches.
3. Methodology
The following sections describe briefly the sam-pling systems applied to determine NH3 concentra-tions, windspeed, temperature and humidity, from which the turbulent exchange parameters and fluxes of NH3, sensible and latent heat were calculated.
3.1. Active ammonia sampling systems
The core measurement technique applied for deter-mining concentration gradients of NH3 in this study was the AMANDA (ammonia measurement by annu-lar denuder sampling with on-line analysis) continuous wet denuder system (Wyers et al., 1993). Two indepen-dent systems were operated (CEH, UPM), each pro-viding determination of NH3concentrations with three separate inlets. This allowed for replicate sampling by the two systems independently at three heights, or having established agreement (or inter-calibrated) be-tween the systems, at six heights. The latter approach was applied for parallel measurements of above- and
within-canopy concentration profiles as reported by Nemitz et al. (2000a).
Each of the AMANDA systems used consists of three annular wet rotating denuders (sampling air at approximately 25 l min−1), connected to a com-mon detection and switching system for analysis and logging of the amount of NH3 trapped into acidic solution as NH4+. Air flow rates through the de-nuders are controlled by critical flow orifices, with flow rates checked regularly by dry gas meters. The wet denuders are oriented horizontally, and supplied with a solution of 0.5 g l−1NaHSO
4·H2O containing 0.2 ml l−1 38% (v/v) HCHO as a biocide. A con-stant liquid level in the denuder is maintained by the use of two peristaltic pumps, one of which empties the denuder at a constant rate, while the other one, controlled by electrodes determining conductivity along the denuder, refills the denuder to a constant level. The collection solution is typically abstracted from the denuders at a rate of 1.5 ml min−1, and NaOH is added to the sample, thereby converting the NH4+ to NH3 in solution. The sample is then passed over a Teflon membrane with NH3 diffusion into a counter flow of deionized water; the NH3 re-ionizes to NH4+ and is detected by conductivity. As it has been established that the sampling efficiency of the denuder inlets is close to 100% (Wyers et al., 1993), calibration is performed using aqueous NH4+ standards.
3.2. Passive ammonia sampling systems
Two types of passive horizontal flux samplers were applied: the oriented denuder system of Schjoerring (1995) (operated by RVAU) and a wind-vane mounted ‘shuttle’ system following the design of Leuning et al. (1985) (operated by ADAS). The denuder system pro-vided fluxes using four double denuders (angled at 90◦
to each other, each 2×0.1 m2long and 6 mm i.d.) at each height, with the profile measured at four heights (16 samplers per profile). In these samplers NH3 is captured onto the inner wall of the denuders which is coated with 3% (w/v) oxalic acid in acetone. For the shuttles (one shuttle at each of eight heights), a sim-ilar coating is used, but in this case the surface is a mesh of oriented stainless steel foil. Three consecu-tive runs were made with the RVAU passive denuders and one run with the ADAS shuttles, with each group using two replicate masts per run.
3.3. Determination of micrometeorological parameters
Windspeed and turbulent exchange parameters were measured using both a combination of wind and tem-perature profiles, and several ultrasonic anemometers. The wind profile (CEH) was measured at five heights above the canopy using Vector A100R cup anemome-ters (Vector Instruments, Clywd, UK). Two point pro-files of temperature above the canopy were obtained using a Campbell system (Campbell Scientific, Lough-borough, UK), which also provided profile measure-ments of water vapour pressure from a cooled mirror sensor. This system (operated by CEH) was also used to measure net radiation (Rn) and soil heat flux (G), with data recorded on a Campbell 21X datalogger.
Three different ultrasonic anemometers (type So-lent Research 1012RA, Gill Instruments, Lymington, Hants., UK) were available, which because of different logging systems provided four estimates of windspeed, u∗ andH. Two systems (CEH) were logged digitally
using the eddysol software (Moncrieff et al., 1997), while the signal of one of these was also processed by an analogue data acquisition system (UMIST). The third anemometer was recorded by ECN software.
In addition to the profile estimates of λE a fast-response Krypton hygrometer (KH2O, Campbell Scientific, Loughborough, UK) was connected to the
ECN ultrasonic anemometer and referenced against a Rhotronic combined temperature and humidity sen-sor (ECN). Further independent estimates ofλEwere calculated assuming closure of the energy balance (λE=Rn−G−H).
Additional cup anemometer wind profiles (using four heights) were made in parallel to the passive flux samplers (RVAU, ADAS), and these provided the time averaged windspeed over the duration of each passive sampling run.
3.4. Field site and micrometeorological restrictions
Measurements were carried out over an extensive (ca. 30 ha) oilseed rape field (B. napus — cv. Ex-press), which had received 285 kg N ha−1, mainly as ammonium nitrate, since the previous autumn. A plan of the measurement site has been provided by Sutton et al. (2000), indicating that the main wind sectors for the measurements were in the SW–NW and NE–SE. This resulted in insufficient fetch for either N or S winds, although these only occurred for a small fraction of the experiment. During the first measurement period (7–25 June 1995) the crop was rather even at 1.38 m tall (measured using a plastic plate resting lightly on the canopy). The microme-teorological measurements were mostly made in the range 0.2–2 m above canopy (or 1.6–3.4 m above ground). The canopy during this period was at the fi-nal stages of flowering, with seed filling progressing. Following cutting on 22 July, the field was banded with E–W oriented rows of alternately 0.8 m high cut crop (1.8 m wide) and 0.25 m high (1.5 m wide) standing stems (see Sutton et al., 1996, cover pho-tograph). To ensure measurements were above the roughness sublayer, profiles were determined in the range 1.8–3.9 m above ground. The sensors for the gradient measurements were spaced exponentially within the height ranges stated to maximize the ability to determine the expected log-linear profiles (see e.g. Fig. 4).
correc-tion would apply if fluxes are not conserved due to gas–particle reactions above the canopy. This issue is addressed separately by Nemitz et al. (2000c), where it is shown that above-canopy reactions would have had little effect on the calculated NH3 fluxes during the North Berwick experiment. For the analysis of the measured fluxes, three levels of data filtration and cor-rection were considered:
1. A general filtering of data to remove major prob-lems, such as fetch interruptions and denuder mal-functioning.
2. A more rigorous filtering to exclude conditions where the flux is likely to be estimated with less certainty, such as very stable conditions or where the contribution of the rape field to the flux at the top height was less than a defined value, according to a foot-print analysis.
3. Application of correction procedures to the remain-ing data to account for storage errors and density corrections.
For the foot-print analysis (Schuepp et al., 1990) data were accepted if the field contributed to the top NH3 sampling height by 65% or more, equivalent to almost 100% at the middle and bottom sampling heights.
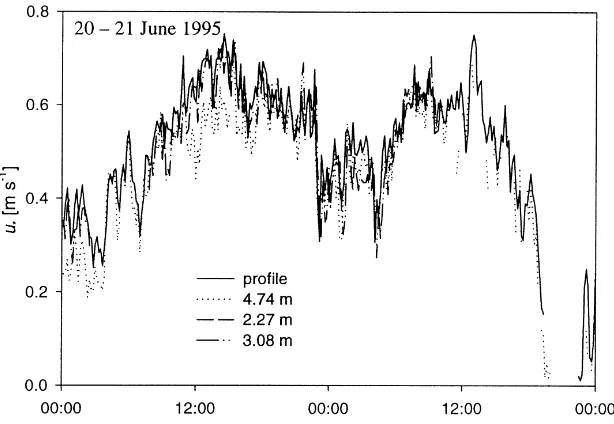
Fig. 1. Comparison of friction velocity (u∗) as measured with three ultrasonic anemometers logged digitally and an anemometer profile
during the main campaign (20–21 June) after filtering. For clarity, the mean of estimates is not shown. Heights are shown above ground. 4. Results
4.1. Micrometeorological exchange parameters
The comparison of several different measurement methods provided a powerful technique to establish reliable estimates of the micrometeorological parame-ters. This is shown in Figs. 1 and 2, which illustrate the comparisons foru∗ andH, respectively. Good
agree-ment was obtained between the different determina-tions of u∗, with the weighted mean of the relative
standard deviation of the filtered values being 14% for the overall dataset. Close agreement was also found for sensible heat fluxes using the different systems (Fig. 2), with the weighted mean of relative standard deviation being 26%. In both these cases, best esti-mates of the parameters were established by means of the available estimates, which were used in the subse-quent analysis. The canopy was found to have a zero plane displacement of around 1.11 m, with typical val-ues ofz0in the range 65–125 mm.
Fig. 2. Comparison of sensible heat flux (H) measured with three ultrasonic anemometers and stability corrected anemometer/temperature profile (20–21 June). For clarity the mean of estimates is not shown. Heights are shown above ground.
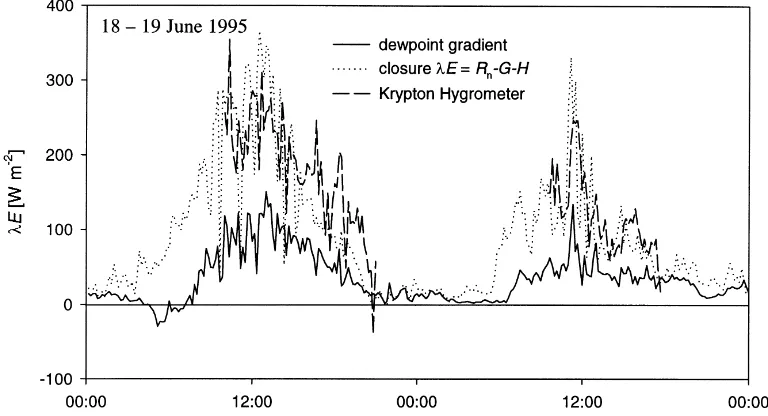
between the two sampling heights, so the stabiliza-tion time was longer than the switching time of 2 min. This resulted in underestimation of vertical vapour pressure gradients and hence of λE by this method. These data were therefore not used in further analy-sis. Despite this limitation, good agreement (Fig. 3)
Fig. 3. Comparison of the latent heat flux (λE) measured with the Krypton hygrometer (by eddy correlation), the profile system and dew point meter (by aerodynamic gradient method), and an estimate required to close the energy balance of the surface (18–19 June).
4.2. Determination of ammonia concentration gradients and fluxes by continuous denuders and filter packs
As expected, the determination of concentration gradients (and hence χ∗, Eq. (1)) represented the
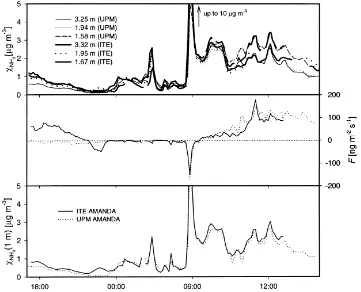
largest uncertainty in calculating fluxes. The avail-ability of the two AMANDA systems allowed for im-proved estimates where both systems were function-ing acceptably well, although denuder malfunctionfunction-ing occurred frequently. The quality of the measurement estimates for both the concentration profiles and the estimation ofχ(1 m) is shown in Fig. 4, together with estimates of the flux using the best estimates of u∗
andH. This therefore shows the uncertainties due to the AMANDA gradient measurements.
The estimates of air concentration by the two sys-tems were close, while periods of good agreement of
Fig. 4. Ammonia concentration as measured at six heights above the canopy by two (3-point) AMANDA systems operated by the Centre for Ecology and Hydrology (CEH) and the Technical University of Madrid (UPM) (22–23 June). Sampling heights noted are referenced above ground level.χ(1 m) refers to NH3 concentration at 1 m above the zero plane;F, net NH3 flux (emission is positive). Canopy height
was 1.38 m. Sampling heights are shown above ground.
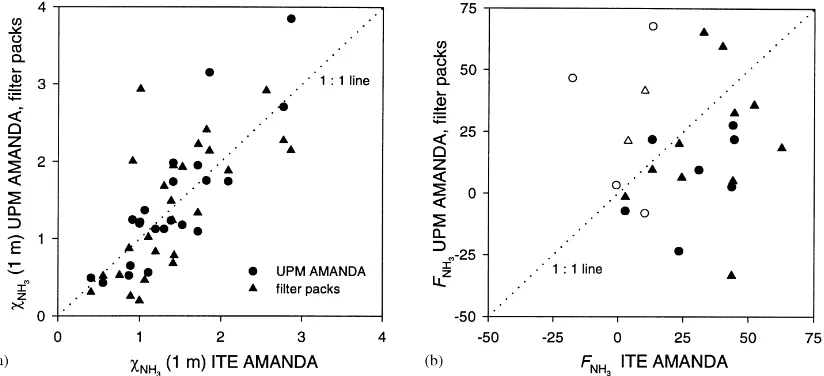
Fig. 5. Comparison of the CEH AMANDA system against the UPM AMANDA system and filter packs for periods where filter pack runs were made, showing: (a) NH3 concentrations (z−d=1 m); (b) NH3 fluxes. Open symbols show values filtered for either UPM
AMANDA malfunctioning or where AMANDA data was available for<60% of a filter pack run. Units aremg m−3 for concentrations
and ng m−2s−1 for fluxes.
established for similar conditions on other days (e.g. 23 June). In addition, although no filter packs runs were made on this day, comparisons on other days (see below), supported by co-sampling tests, indicated that the UPM system repeated this behaviour in some other runs. A detailed filtering of the AMANDA data was therefore made in order to establish best estimates for subsequent analysis.
A total of around 25 concentration profiles were made with the filter packs (each of around 2 h du-ration), providing an independent estimate of the NH3 fluxes. In many cases the scatter from these runs was very high (S.E. of the flux estimates typi-cally ±20 ng m−2s−1). The comparison is shown in Fig. 5, and indicates a typical agreement between NH3 concentration estimates of ±25% and between flux estimates of±50%, although it is not possible to say whether the errors lie mainly with the denuders or filter packs.
4.3. Filtering of measured ammonia fluxes and best estimates from continuous denuder sampling
A summary of the filtering and correction proce-dures applied to the data and the effect on the data re-duction is shown in Table 1. Out of the first
measure-ment period, which was studied most intensively, the general data treatment provided 2880 flux estimates, equivalent to flux continuous measurements for around 2
3 of the time. Micrometeorological corrections were made depending on data availability (2270 data points) and the second stage filtering reduced the dataset to around 1500.
Table 1
Filter criteria and corrections applied to the NH3 fluxes (points are 10 min mean estimates)a
Correction Corrections/filter criteria No. of valid data
points remaining
(a) General u∗,Hfiltered for obstructed wind sectors 2880
Hfrom profile discarded as systematically different (possible radiative heating) u∗from profile discarded foru(1.68 m) <0.5 m s−1(anemometer stalling)
NH3 concentration data filtered for periods of malfunctioning systems
(b) Filtering Discard data for
0< L <5 m 2240
CNF(top NH3concentration) <65% 1710
u(1 m) <0.8 m s−1 1598
Obstructed wind sector for NH3 sampler 1528
(c) Corrections Correction for 2270b
Storage errors Temperature gradients Humidity gradients
au
∗: friction velocity; H: sensible heat flux; u(z−d): mean horizontal windspeed at height above the canopy displacement height
(z−d);L: Monin–Obukhov stability length; CNF: the cumulative normalized contribution to the flux measurement denotes the fraction to which the flux measured at the top height is influenced by the fetch (Section 3.4).
bIndicates the number of data points for which sufficient data were available to apply the correction procedures.
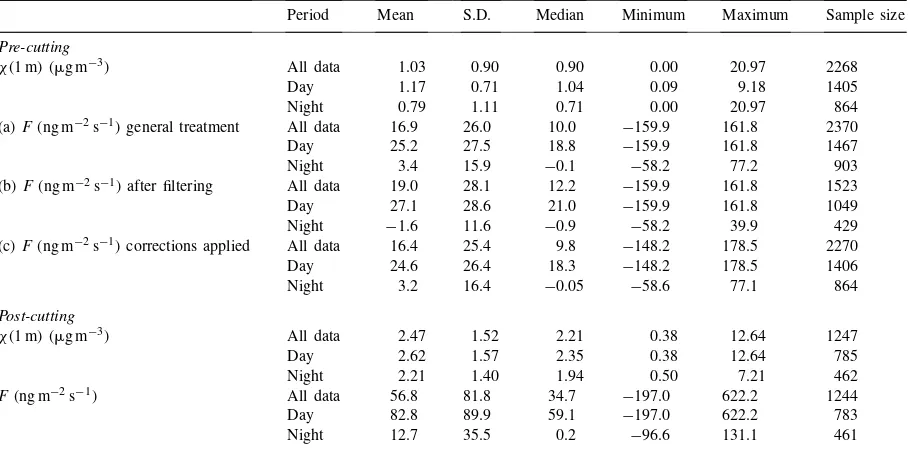
Table 2
Means and variability of 10 min AMANDA NH3flux estimates for the pre- and post-cutting measurement periods, noting the influence of
filtering and correction procedures (daytime is defined as 04:30–20:00 GMT)a
Period Mean S.D. Median Minimum Maximum Sample size Pre-cutting
χ(1 m) (mg m−3) All data 1.03 0.90 0.90 0.00 20.97 2268
Day 1.17 0.71 1.04 0.09 9.18 1405
Night 0.79 1.11 0.71 0.00 20.97 864
(a)F(ng m−2s−1) general treatment All data 16.9 26.0 10.0 −159.9 161.8 2370
Day 25.2 27.5 18.8 −159.9 161.8 1467
Night 3.4 15.9 −0.1 −58.2 77.2 903
(b)F(ng m−2s−1) after filtering All data 19.0 28.1 12.2 −159.9 161.8 1523
Day 27.1 28.6 21.0 −159.9 161.8 1049
Night −1.6 11.6 −0.9 −58.2 39.9 429
(c)F(ng m−2s−1) corrections applied All data 16.4 25.4 9.8 −148.2 178.5 2270
Day 24.6 26.4 18.3 −148.2 178.5 1406
Night 3.2 16.4 −0.05 −58.6 77.1 864
Post-cutting
χ(1 m) (mg m−3) All data 2.47 1.52 2.21 0.38 12.64 1247
Day 2.62 1.57 2.35 0.38 12.64 785
Night 2.21 1.40 1.94 0.50 7.21 462
F(ng m−2s−1) All data 56.8 81.8 34.7 −197.0 622.2 1244
Day 82.8 89.9 59.1 −197.0 622.2 783
Night 12.7 35.5 0.2 −96.6 131.1 461
aχ(1 m): NH
trace gases. For ammonia, the fluxes are rather large in relation to concentrations, so that the corrections become trivial (Sutton et al., 1993a).
4.4. Average and ranges of fluxes for the different measurement periods
Mean fluxes were around 17 and 57 ng m−2s−1for the pre- and post-cutting measurements, respectively. Table 2 shows that both the largest and smallest fluxes occurred during the day, with extreme values of −150 and +180 ng m−2s−1 for the pre-cutting measurements. Even larger fluxes were recorded for the post-cutting campaign, with values up to 620 ng m−2s−1.
The pattern of air concentrations between the day and the night is also of interest. Although concentra-tions are often more variable during night, probably as a consequence of increased impact of plumes from lo-cal point sources during stable conditions, overall air concentrations are larger during the day than during the night. This may be a consequence of larger emis-sions during the daytime from this crop (and others in the vicinity) affecting NH3air concentrations. This explanation is supported by the observation of larger average NH3 concentrations during the post-cutting period, when net emissions were also larger. A fur-ther possibility is variations in partitioning between gaseous NH3and aerosol NH4+, although analysis by Nemitz et al. (2000c) suggests that this would be a second order effect for the measurements here.
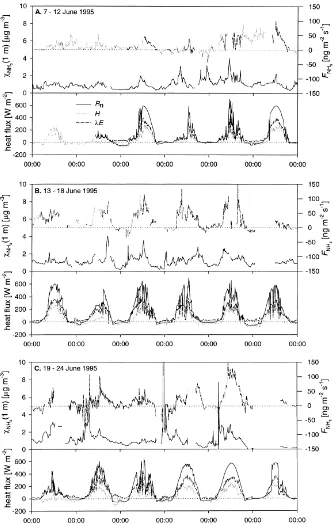
4.5. Temporal patterns in ammonia fluxes
The time course of the NH3 fluxes over the two measurement periods is shown together withχ(1 m), Rn,HandλEin Figs. 6 and 7. The NH3fluxes have been filtered using the general screening criteria (a), but, in order to show the temporal trends, results fil-tered under (b) are also included.
Examination of Fig. 6 shows some days such as 13–19 June which follow the classical pattern of NH3 exchange over croplands, with emission during the day, and much smaller emissions or deposition at night. This is consistent with the cooler night-time conditions giving smaller compensation points for the canopy sources, closure of stomata and the increased effectiveness of leaf surface sinks at high relative
hu-midities. However, not all the data show this pattern, and substantial periods of emission occur for several night-time periods, such as 12 and 19–23 June. These fluxes are most probably related to emissions from decomposing abscised leaves at the bottom of the canopy (Nemitz et al., 2000a).
Diurnal variation in NH3 fluxes is also seen in the post-cutting measurement period, although here the larger daytime emissions (typically up to 200–300 ng m−2s−1) alternate with smaller night-time emissions, with only a few periods of nocturnal NH3deposition.
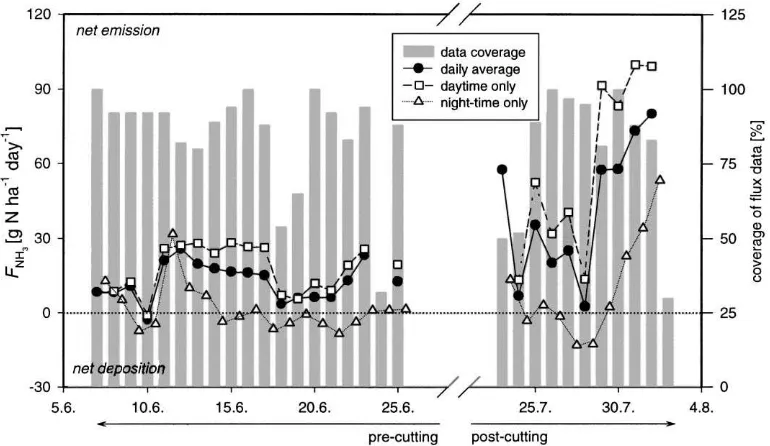
4.6. Average daily fluxes
A summary of the fluxes for each day of the two measurement periods is shown in Fig. 8, alongside the percent data coverage of fluxes for each day. Data capture was 50% or more for all except two of the measurement days, and in these cases no average flux for the day is stated. The typical daily flux for the measurement period over the ripening crop was 28 ng NH3m−2s−1, which is equivalent to around 20 g N ha−1per day.
For the post-cutting period the emissions were more variable. However, the overall emissions were even larger than the pre-cutting period, and showed a gen-eral tendency to increase with time. Typical emissions immediately after cutting were around 30 g N ha−1 per day and increased to around 80 g ha−1 per day (110 ng NH3m−2s−1) at the end of the measurements. 4.7. Comparison of the continuous and passive flux sampling estimates
Fig. 7. Fluxes of NH3 (FNH3) as measured during the post-cutting campaign. The field was cut on the 22 July. Air concentrations (χNH3) are the lower of the two traces in each graph.
Fig. 8. Daily average NH3 fluxes (shown as points) during both experimental periods obtained by interpolation of measured fluxes.
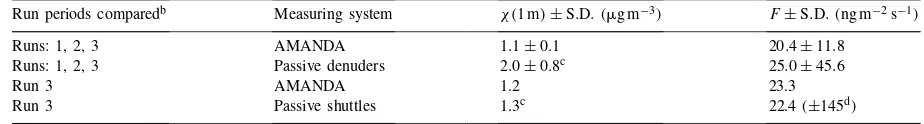
Table 3
Comparison of mean NH3 concentrations and fluxes from the classical aerodynamic gradient method (AMANDA) and the passive flux
sampling approachesa
Run periods comparedb Measuring system χ (1 m)±S.D.(mg m−3) F±S.D.(ng m−2s−1)
Runs: 1, 2, 3 AMANDA 1.1±0.1 20.4±11.8
Runs: 1, 2, 3 Passive denuders 2.0±0.8c 25.0±45.6
Run 3 AMANDA 1.2 23.3
Run 3 Passive shuttles 1.3c 22.4 (±145d)
aχ(1 m): NH
3 concentration at 1 m above the zero plane displacement height;F: net NH3flux; S.D.: standard deviation. bTiming of runs: Run 1: 8–11/6/1995; Run 2: 11–14/6/1995; Run 3: 14–17/6/1995. Passive samplers changed at noon (GMT). cWindspeed weighted concentration.
dAs only one run, the standard deviation refers to the scatter in the vertical concentration profile of eight samplers.
one run was made, and where the scatter was much larger than for the passive denuders, for which the av-erage standard deviation of an individual profile was 35 ng m−2s−1. The NH
3concentrations measured by the passive samplers are similar or larger than the AMANDA reference, and this may partly reflect the fact that these represent windspeed weighted con-centrations. However, if this were the case it would suggest the existence of larger NH3 concentrations occurring during high windspeed conditions, mostly during the day. In fact there is no clear relationship be-tweenχ(1 m) from the AMANDA measurements and windspeed (data not shown). This would suggest that the difference in χ measured by the two systems is actually not due to the difference between time aver-aged and windspeed weighted average concentration.
5. Discussion
5.1. Comparison of micrometeorological estimates and active NH3sampling flux estimates
The comparison of the different micrometeorologi-cal estimates ofu∗andHshowed that these parameters
may be measured with sufficient accuracy with both gradient and eddy covariance approaches. In princi-ple, similar uncertainties would be expected in mea-surement of λE, which in this case was limited by inadequate performance of the gradient sampling sys-tem. As has been shown before (e.g. Sutton et al., 1993a), it is clear that overall uncertainties in NH3 fluxes are dominated by estimation of the NH3 ver-tical concentration profile. Although periods of good agreement between the two AMANDA systems were
observed, there were also substantial deviations, which required a careful series of checks to explain. This illustrates again (cf. Harrison and Kitto, 1990) how the practical implementation of a sampling technique is critical to its success. The comparison of the two AMANDA systems here also highlights the uncer-tainties that might be missed when measuring using a single gradient system. It is thus essential to regu-larly establish that the system is functioning reliably, e.g. by co-sampling different inlets at one height. The comparison of Fig. 4 illustrates the difficulty in giv-ing a simple statistic regardgiv-ing the precision and over-all uncertainty of the flux measurements. As has been shown in other measurements applying AMANDA (e.g. Wyers et al., 1993; Sutton et al., 1998), rela-tive uncertainty is dominated by the ability to measure NH3gradients accurately with the AMANDA system. Hence the uncertainty in the flux is a function of NH3 air concentrations, atmospheric humidity, temperature and overall optimization of the AMANDA continu-ous flow. During sound operation of the AMANDA the flux estimates are typically precise to ±20% at 100 ng m−2s−1, although the overall uncertainty in-cluding all sources of error would be around±30%. These estimates vary and the uncertainties were larger for the filter packs and UPM AMANDA.
5.2. Diurnal behaviour of NH3fluxes in relation to environmental conditions
1995a,b). The classic pattern of large emission in day-time and smaller deposition at night was frequently seen, although there were also clear instances of large night-time emission for the rape here. Key processes affecting the diurnal patterns of NH3 fluxes are the variation in the turbulent diffusion coefficient (KH) and linked to this the atmospheric resistance (Ra), as well as factors affecting the affinity of the surface for NH3. The value ofKH is typically largest in the day, which increases the magnitude of fluxes compared with night, but does not directly affect the flux direc-tion.
The direction of the flux results from the balance between the air concentration, e.g. χ(1 m), and the surface concentration or compensation point of the canopy (χc, Sutton et al., 1995b). The latter is particu-larly a function of surface wetness and temperature so that deposition is generally expected in cooler, wetter nocturnal conditions. The compensation point model of Sutton et al. (1995b), which has been applied to sev-eral canopy types, deals with the competition of depo-sition to leaf cuticles and the bi-directional exchange through stomata with a compensation point (χs) of leaf tissues. The resistance for cuticular deposition is described as a function of humidity, while the stomatal flux depends on temperature (affecting the magnitude of χs) and stomatal resistance, as well as the calcu-lated magnitude ofχc. Since nocturnal stomatal emis-sions are unlikely given stomatal closure and a lack of diurnal variability in tissue ammonium concentrations (Husted et al., 2000), the net emissions observed at night here must result from another source. As further analysis indicates (Nemitz et al., 2000a,b), the extra source for the rape canopy is decomposing litter on the soil surface, which can largely explain the night-time emissions of NH3 from the oilseed rape. Attempts to model the net fluxes, including component emis-sions from foliage, siliques (seed cases) and fallen leaf litter, are described by Nemitz et al. (2000b).
5.3. Comparison of NH3fluxes before and after cutting
There is an abundance of literature indicating larger NH3emissions from senescing than from green leaves (e.g. Farquhar et al., 1979; Parton et al., 1988; Schjo-erring et al., 1998), and this includes measurements of increased compensation points for attached senescing
leaves of oilseed rape (Husted and Schjoerring, 1996), as well as literature on NH3 volatilization from crop plant residues (Mannheim et al., 1997). There is, how-ever, little information on emission of NH3following cutting of crops including oilseed rape or from decom-posing leaf litter. The measurements here clearly show an increase in NH3emissions following cutting. From Table 2, it is seen that the net emission flux increased by more than a factor of 3 from 16 to 57 ng m−2s−1 from the pre-cutting to the post-cutting measurement periods. This may result from the increased aerody-namic access of the fallen leaf litter to the atmosphere, as well as from increased turbulence from the aerody-namically rougher cut field. The first effect is expected to be most important, particularly as this would add to cutting induced senescence emissions from the cut crop itself. The effect of increased turbulence is prob-ably a secondary effect and would, e.g. not explain the increased surface NH3 concentrations during the post-cutting period (Section 5.5). Average values of χc were 1.3 and 6.8mg m−3for the first and second measurement period, respectively, and the larger value ofχcfor the second period supports this conclusion.
5.4. Overall ammonia emissions from the canopy
The fluxes reported here for oilseed rape are larger than has typically been reported for other crop canopies in northern Europe. Typical midday emis-sion fluxes here of 50 ng m−2s−1 for the ripening canopy and 100–200 ng m−2s−1 after cutting, com-pare with daytime emissions from wheat of typically 10–30 ng m−2s−1 (Sutton et al., 1995a). Although larger spring emissions from wheat were measured by Sutton et al. (1995a), these emissions were related to residues of urea, which are known to cause large NH3losses.
it is likely that net emission also occurs for spring. The largest uncertainties apply for autumn and win-ter months, especially in relation to ploughing and variability in timing of fertilization. Despite the un-certainties, the measurements here have implications for regional scale emission inventories, which have often subsumed crop NH3emissions into estimates of losses from fertilizer application (e.g. Sutton, 1996). The measurements suggest that for oilseed rape, this may be an underestimate. Expressed as a percentage of the N applied to the crop this may account for an additional 1–2% emission as ammonia, compared with the existing CORINAIR/EMEP total loss esti-mate of 2% applied N where fertilizer is applied as ammonium nitrate (Sutton, 1996).
5.5. Interactions between bi-directional fluxes and NH3air concentrations
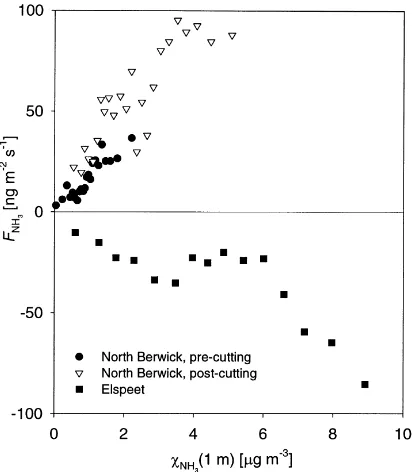
A particularly interesting feature of the data here, of relevance to both modelling exchange and atmospheric budgets, is the link between fluxes and NH3 concen-trations. In modelling dry deposition, it is common to infer fluxes from a resistance model and air concen-tration estimates (‘inferential approach’, e.g. Fowler and Unsworth, 1979; Sutton et al., 1993a; Erisman et al., 1994). While, for periods of deposition, larger deposition fluxes are linked to larger air concentra-tions, the opposite holds for periods of NH3emission from the canopy. Here larger air concentrations of-ten correspond to larger NH3 emissions (cf. day and night fluxes; pre- and post-cutting). If NH3fluxes were viewed as linking statically to a constant canopy com-pensation point (χc), then larger emissions would be expected during periods of small NH3 air concentra-tions. The opposite relation observed here indicates thatχc is more variable thanχ(1 m); through the ef-fect on the emission flux, χc is affecting the mag-nitude of χ(1 m). Fig. 9 demonstrates the positive correlation betweenFχandχ(1 m) for both
measure-ment periods over the oilseed rape at North Berwick. In this analysis the average flux for differentχ(1 m) classes is plotted, and this shows how the net NH3flux for all NH3air concentration classes was emissioned. Following the above argument, larger NH3 concen-trations correspond to increased emission fluxes (i.e. χ(1 m) is the dependent variable rather thanFχ).
In-Fig. 9. NH3 flux as a function of NH3 air concentration during
the two measurement periods, contrasted with the behaviour for a semi-natural heathland at Elspeet, Netherlands (from Nemitz, 1998). Each dot represents a block average of 100 observations for different NH3 concentration classes (50 for North Berwick,
post-cutting).
terestingly, despite the larger emissions after the cut, the slope of the relationship remained more or less the same, which may reflect the broadly similaru∗values
during the two parts of the experiment. In Fig. 9 the findings over the oilseed rape at North Berwick are contrasted with measurements of NH3deposition to a semi-natural heathland at Elspeet, NL (Nemitz, 1998). In this case the deposition flux increased with air con-centration, showing the dependence ofFχ onχ(1 m)
as is normally recognized in the inferential approach. An approximate indication of the daytime air con-centration enhancement due to the crop emissions may be given by estimating the air concentration at a height little affected by the surface emissions. Using a simple resistance analogy it can be shown that
daytime values of χ(1 m) and F from Table 2, pro-vides an average χ(10 m) during the first period of 0.54mg m−3 and during the second of 0.52mg m−3. Although this analysis is very approximate, it broadly supports an unaffected background air concentra-tion of ≈0.5mg m−3 and enhancements 1 m above the canopy of 0.6 and 2.1mg m−3 for the pre- and post-cutting periods, respectively. There were, nev-ertheless, periods during which NH3advection from local point sources temporarily increased the air con-centration at North Berwick.
While the effect of an emission source on air con-centrations is well known for classical NH3 sources such as animal manures, it is a new step to make this link for the bi-directional exchange over croplands. Since NH3concentrations in arable areas are partly a response to the crop emissions, it becomes difficult to use inferential models to infer net bi-directional ex-change from monitoring data. The way forward must be to incorporate the bi-directional NH3 resistance models developed from flux measurements directly into atmospheric transport models, and these must give particular attention to predict ground level NH3 con-centrations. In this way, the interactions between NH3 concentrations and fluxes become integrated for both large livestock sources and bi-directional exchange with vegetation.
5.6. Assessment of the passive flux sampling approach
In addition to provide a detailed picture of the NH3 exchange fluxes, the availability of the continuous AMANDA measurements provided the facility to test the passive flux sampling method for determining ver-tical NH3 fluxes. Although intensive measurements were made with the passive denuders (16 samplers per profile with duplicate profiles), short sampling periods led to substantial scatter in the results, and this was even more extreme for the shuttles. This is because a shorter sampling time allows for a less capture of NH3 in the samplers thereby increasing uncertainties. As has been shown by Schjoerring (1995), for a sampling period of 7 days, a mean flux of 15 ng m−2s−1would be required to maintain a coefficient of variation in the passive denuder flux estimates at<20%. On average, the fluxes measured here agreed closely (within 25%), but given the degree of scatter this must be considered
as fortuitous. The clear message is that much longer duration inter-comparisons of several months are re-quired to assess the passive approach (e.g. Hansen et al., 1999). A much longer inter-comparison period would have the advantage that each run could be of greater duration (improving precision of gradient determination), and also provide a larger population of sampling runs for comparison with the reference. Recognizing the costs of providing continuous flux estimates for reference, this necessarily becomes a major task. The present results also highlight the scale limitation of the passive approach. For typical air concentrations and fluxes with the same degree of scatter, the passive method cannot be expected to provide precise flux estimates with less than 10–20 days resolution. These provide important messages to other researchers wishing to evaluate further the pas-sive flux sampler approach. Such studies must move beyond a campaign approach and should ideally fo-cus on performance between different seasons and years.
6. Conclusions
The results reported here represent the first detailed time-resolved NH3 flux measurements over oilseed rape for two contrasting vegetation periods. During the first part of the measurements (late flowering/seed filling) intensive measurements were made, utilizing two gradient-AMANDA systems for the first time. The comparison between these, and with filter pack sam-pling, shows that the uncertainties in determining NH3 concentration gradients are the major source of error. Using a range of samplers for gradient and eddy co-variance measurements provided accurate determina-tions of the basic turbulent exchange parameters. An assessment of a new passive flux sampling approach was also made, but showed substantial scatter in the measurements. This method would at best only be suit-able for long-term patterns, with precise results lim-ited to sampling of >10–20 days.
larger following cutting, which probably results from increased aerodynamic exposure to the decomposing leaf litter on the soil surface, as well as potential senescence emissions from the cut foliage. The emis-sion rates reported here for rape are larger than often observed for cereal crops, and suggest that crop emis-sions need to be incorporated explicitly in emission inventory estimates. The measurements here suggest that this would amount to an equivalent emission of 1–2% of the applied fertilizer N, in addition to the direct emissions from fertilizer application already included in emission inventories. Nevertheless, such inventories and atmospheric transport modelling must account for the bi-directional nature of the fluxes and work towards incorporation of both seasonal and diurnal variability in fluxes. This will allow the ef-fect of crop NH3 compensation points and emission fluxes on NH3 air concentrations to be treated more realistically in atmospheric transport models, thereby improving estimates of NH3 atmospheric transport distances and residence times.
Acknowledgements
The authors gratefully acknowledge financial sup-port from the UK Department of Environment Trans-port and the Regions (contracts: EPG 1/3/28 and 1/3/94), the Dutch Ministry of Housing and Spatial Planning, and the European Commission for the EX-AMINE project (EV5V-CT94-0426). Final analysis of these measurements was carried out as part of the EC project GRAMINAE (CT98-0722). The field site was kindly made available by Mr. J. Grant-Suttie and help with the measurements provided by col-leagues at CEH, particularly K.J. Hargreaves and F. Harvey.
References
Denmead, O.T., Nulsen, R., Thurtell, G.W., 1978. Ammonia exchange over a corn crop. Soil Sci. Soc. Am. J. 42, 840–842. Erisman, J.W., van Pul, A., Wyers, G.P., 1994. Parameterization of surface resistance for the quantification of atmospheric deposition of acidifying pollutants and ozone. Atmos. Environ. 28, 2595–2607.
Erisman, J.W., Mennen, M.G., Fowler, D., Flechard, C.R., Spindler, G., Grüner, A., Duyzer, J., Ruigrok, W., Wyers, G.P., 1998.
Deposition monitoring in Europe. Environ. Monitor. Assess. 53, 279–295.
Farquhar, G.D., Wetselaar, R., Firth, P.M., 1979. Ammonia volatilization from senescing leaves of maize. Science 203, 1258–1275.
Fowler, D., Duyzer, J.H., 1989. Micrometeorological techniques for the measurement of trace gas exchange. In: Andreae, M.O., Schimel, D.S. (Eds.), Exchange of Trace Gases between Terrestrial Ecosystems and the Atmosphere. Wiley, Chichester, UK, pp. 189–207.
Fowler, D., Unsworth, M.H., 1979. Turbulent transfer of sulphur dioxide to a wheat crop. Quart. J. R. Meteorol. Soc. 105, 767– 783.
Fowler, D., Flechard, C.R., Sutton, M.A., Storeton-West, R.L., 1998. Long-term measurements of land–atmosphere exchange of ammonia over moorland. Atmos. Environ. (Ammonia Special Issue) 32 (3), 453–460.
Hansen, B., Nørnberg, P., Rasmussen, K.R., 1998. Atmospheric ammonia exchange on a heathland in Denmark. Atmos. Environ. (Ammonia Special Issue) 32 (3), 461–464.
Hansen, B., Wyers, G.P., Nørnberg, P., Nemitz, E., Sutton, M.A., 1999. Intercalibration of a passive wind-vane flux sampler against a continuous-flow denuder for the measurements of atmospheric ammonia concentrations and surface exchange fluxes. Atmos. Environ. 33, 4379–4388.
Harper, L.A., Sharpe, R.R., 1998. Atmospheric ammonia: issues on transport and nitrogen isotope measurement. Atmos. Environ. (Ammonia Special Issue) 32 (3), 273–278.
Harper, L.A., Sharpe, R.R., Langdale, G.W., Giddens, J.E., 1987. Nitrogen cycling in a wheat crop: soil, plant and aerial nitrogen transport. Agron. J. 79, 965–973.
Harrison, R.M., Kitto, A.-M.N., 1990. Field intercomparison of filter pack and denuder sampling methods for reactive gaseous and particulate pollutants. Atmos. Environ. 24A, 2633–2640. Harrison, R.M., Rapsomanikis, S., Turnbull, A., 1989.
Land–surface exchange in a chemically reactive system surface fluxes of HNO3, HCl and NH3. Atmos. Environ. 23, 1795–
1800.
Husted, S., Schjoerring, J.K., 1996. Ammonia flux between oilseed rape plants and the atmosphere in response to changes in leaf temperature, light intensity and air humidity. Interactions with leaf conductance and apoplastic NH4+and H+concentrations.
Plant Physiol. 112, 67–74.
Husted S., Mattsson M., Schjoerring J.K., 1996. Ammonia compensation points in two cultivars of Hordeum vulgare L. during vegetative and generative growth. Plant, Cell and Environ. 19, 1299–1306.
Husted, S., Schjoerring, J.K., Nielsen, K.H., Nemitz, E., Sutton, M.A., 2000. Stomatal compensation points for ammonia in oilseed rape plants under field conditions. Agric. For. Meteorol. 105, 371–384.
Janzen, H.H., Gilbertson, C., 1994. Exchange of15N among plants
in controlled environment studies. Can. J. Soil Sci. 74, 109–110. Leuning, R., Freney, J.R., Denmead, O.T., Simpson, J.R., 1985. A sampler for measuring atmospheric ammonia flux. Atmos. Environ. 19, 1117–1124.
crop residues. Z. Pflanzenernähr. Bodenk. 160, 125–132 (in German with English abstract).
Moncrieff, J.B., Massheder, J.M., deBruin, H., Elbers, J., Friborg, T., Heusinkveld, B., Kabat, P., Scott, S., Soegaard, H., Verhoef, A., 1997. A system to measure surface fluxes of momentum, sensible heat, water vapour and carbon dioxide. J. Hydrol. 189, 589–611.
Nemitz, E., 1998. Surface/atmosphere exchange of ammonia and chemically interacting species. Ph.D. Thesis. University of Manchester Institute of Science and Technology (UMIST), Manchester, UK, 302 pp.
Nemitz, E., Sutton, M.A., Gut, A., San José, R., Husted, S., Schjoerring, J.K., 2000a. Sources and sinks of ammonia within an oilseed rape canopy. Agric. For. Meteorol. 105, 385–404. Nemitz, E., Sutton, M.A., Schjoerring, J.K., Husted, S., Wyers,
G.P., 2000b. Resistance modelling of ammonia exchange over oilseed rape. Agric. For. Meteorol. 105, 405–425.
Nemitz, E., Sutton, M.A., Wyers, G.P., Otjes, R., Schjoerring, J.K., Gallagher, M.W., Parrington, J., Fowler, D., Choularton, T.W., 2000c. Surface/atmosphere exchange and chemical interaction of gases and aerosols over oilseed rape. Agric. For. Meteorol. 105, 427–445.
Parton, W.J., Morgan, J.A., Altenhofen, J.M., Harper, L.A., 1988. Ammonia volatilization from spring wheat plants. Agron. J. 80, 419–425.
Plantaz, M.A.H.G., Slanina, J., Wyers, G.P., 1996. Surface/atmosphere exchange of ammonia over grazed pasture. Report ECN-C-96-085. ECN, Petten, Netherlands, 81 pp. Schjoerring, J.K., 1991. Ammonia emissions from the foliage of
growing plants. In: Sharkey, T.D., Holland, E.A., Mooney, H.A. (Eds.), Trace Gas Emissions by Plants. Academic Press, San Diego, CA, pp. 267–292.
Schjoerring, J.K., 1995. Long-term quantification of ammonia exchange between agricultural cropland and the atmosphere — 1. Evaluation of a new method based on passive samplers in gradient configuration. Atmos. Environ. 28, 885–893. Schjoerring, J.K., 1997. Plant–atmosphere ammonia exchange.
Quantification, physiological regulation and interactions with environmental factors. D.Sc. Thesis. DSR Publishers, Copenhagen, 55 pp.
Schjoerring, J.K., Nielsen, N.E., Jensen, H.E., Gottschau, A., 1989. Nitrogen losses from field-grown spring barley plants as affected by rate of nitrogen application. Plant Soil 116, 167–175. Schjoerring, J.K., Sommer, S.G., Ferm, M., 1992. A simple passive
flux sampler for measuring ammonia emission in the field. Water, Air Soil Pollut. 62, 13–24.
Schjoerring, J.K., Husted, S., Mattsson, M., 1998. Physiological parameters controlling plant–atmosphere ammonia exchange. Atmos. Environ. (Ammonia Special Issue) 32, 491–498. Schuepp, P.H., Leclerc, M.Y., MacPherson, J.I., Desjardins, R.L.,
1990. Footprint prediction of scalar fluxes from analytical solutions of the diffusivity equation. Boundary-Layer Meteorol. 50, 355–373.
Sutton, M.A., 1990. The surface/atmosphere exchange of ammonia.
Ph.D. Thesis. Institute of Ecology and Resource Management, University of Edinburgh, UK, 194 pp.
Sutton, M.A., 1996. Ammonia emissions from cultures with and without fertilizers (Cultures Chapter: UNECE Expert Panel on Ammonia Emissions). In: McInnes, G. (Ed.), Atmospheric Emissions Inventory Guide Book. UNECE/EC Atmospheric Emissions Inventory Task Force, European Environment Agency, Copenhagen.
Sutton, M.A., Fowler, D., Moncrieff, J.B., 1993a. The exchange of atmospheric ammonia with vegetated surfaces. I: Unfertilized vegetation. Quart. J. R. Meteorol. Soc. 119, 1023–1045. Sutton, M.A., Fowler, D., Moncrieff, J.B., Storeton-West, R.L.,
1993b. The exchange of atmospheric ammonia with vegetated surfaces. II: Fertilized vegetation. Quart. J. R. Meteorol. Soc. 119, 1047–1070.
Sutton, M.A., Pitcairn, C.E.R., Fowler, D., 1993c. The exchange of ammonia between the atmosphere and plant communities. Adv. Ecol. Res. 24, 301–393.
Sutton, M.A., Asman, W.A.H., Schjoerring, J.K., 1994. Dry deposition of reduced nitrogen. Tellus 46B, 255–273. Sutton, M.A., Burkhardt, J.K., Guerin, D., Fowler, D., 1995a.
Measurement and modelling of ammonia exchange over arable croplands. In: Heij, G.J., Erisman, J.W. (Eds.), Acid Rain Research: Do We Have Enough Answers? Elsevier, Amsterdam, pp. 71–80.
Sutton, M.A., Schjoerring, J.K., Wyers, G.P., 1995b. Plant–atmosphere exchange of ammonia. Phil. Trans. R. Soc. London A 351, 261–278.
Sutton, M.A., Lee, D.S., Dollard, G.J., Fowler, D. (Eds.), 1996. Atmospheric Ammonia: Emission, Deposition and Environmental Impacts. Poster Proceedings. Institute of Terrestrial Ecology, Edinburgh, UK, 135 pp. (ISBN 1-870-393-32-5).
Sutton, M.A., Burkhardt, J.K., Guerin, D., Nemitz, E., Fowler, D., 1998. Development of resistance models to describe measurements of bi-directional ammonia surface atmosphere exchange. Atmos. Environ. (Ammonia Special Issue) 32 (3), 473–480.
Sutton, M.A., Nemitz, E., Fowler, D., Wyers, G.P., Otjes, R.P., Schjoerring, J.K., Husted, S., Nielsen, K., San José, R., Moreno, J., Gallagher, M.W., Gut, A., 2000. Fluxes of ammonia over oilseed rape: overview of the EXAMINE experiment. Agric. For. Meteorol. 105, 327–349.
Webb, E.K., Pearman G.I., Leuning, R., 1980. Correction to flux measurments for density effects due to heat and water vapour transfer. Q. J. Roy. Meteor. Soc. 106, 85–100.
Wetselaar, R., Farquhar, G.D., 1980. Nitrogen losses from tops of plants. Adv. Agron. 33, 263–302.
Wyers, G.P., Erisman, J.W., 1998. Ammonia exchange over coniferous forest. Atmos. Environ. (Ammonia Special Issue) 32 (3), 441–451.