AIRBORNE LASER SCANNING AND IMAGE PROCESSING TECHNIQUES
FOR ARCHAEOLOGICAL PROSPECTION
M. Faltýnová a, *, P.Nový b
a Department of Geomatics, Faculty of Civil Engineering, Czech Technical University in Prague, Czech Republic - [email protected]
b Museum of Central Bohemia, Roztoky, Czech Republic - [email protected]
Commission VI, WG VI/4
KEY WORDS: digital terrain model, non-invasive archaeology, DTM, shaded relief, LiDAR
ABSTRACT:
Aerial photography was, for decades, an invaluable tool for archaeological prospection, in spite of the limitation of this method to deforested areas. The airborne laser scanning (ALS) method can be nowadays used to map complex areas and suitable complement earlier findings. This article describes visualization and image processing methods that can be applied on digital terrain models (DTMs) to highlight objects hidden in the landscape. Thanks to the analysis of visualized DTM it is possible to understand the landscape evolution including the differentiation between natural processes and human interventions. Different visualization methods were applied on a case study area. A system of parallel tracks hidden in a forest and its surroundings – part of old route called “Devil’s Furrow” near the town of Sázava was chosen. The whole area around well known part of Devil’s Furrow has not been prospected systematically yet. The data from the airborne laser scanning acquired by the Czech Office for Surveying, Mapping and Cadastre was used. The average density of the point cloud was approximately 1 point/m2. The goal of the project was to visualize the utmost smallest terrain discontinuities, e.g. tracks and erosion furrows, which some were not wholly preserved. Generally we were interested in objects that are clearly not visible in DTMs displayed in the form of shaded relief. Some of the typical visualization methods were tested (shaded relief, aspect and slope image). To get better results we applied image-processing methods that were successfully used on aerial photographs or hyperspectral images in the past. The usage of different visualization techniques on one site allowed us to verify the natural character of the southern part of Devil’s Furrow and find formations up to now hidden in the forests.
* Corresponding author.
1. INTRODUCTION
1.1 Airborne Laser Scanning in Archaeology
Aerial photography was, for decades, an invaluable tool for archaeological prospection. Many and many valuable historical sites were found and mapped using aerial photography; however, the application of this tool is limited to deforested areas. The increasing use of airborne laser scanning (ALS) data for heritage landscape assessment (Cowley, 2011; English Heritage, 2011) is connected to the rapidly growing availability of these datasets during the past decade. The greatest advantage of the ALS technique compared to aerial photography lies in its potential to discover objects covered in high dense vegetation via to laser beams, which are able to penetrate even a dense vegetation. ALS data often serves for DTM generation. Essential for high quality digital terrain models is the precise classification of terrain and off-terrain points. The DTM based on ALS then has to be visualized in appropriate way to highlight topographic changes frequently caused by human activity. The visualization was the main task of our project.
1.2 Devil’s Furrow
The fabulous Devil’s Furrow, which has been under historical and archaeological prospection for last few decades, lies
between towns Sázava and Nymburk. The project focused on Moštice grange and its surroundings, which is situated in a southern part of the Devil’s Furrow. The Devil’s Furrow consists of a number of terrain formations, which gave an impulse to its origin through a late medieval legend (Kramařík;
Ryneš, 1977; Vrchlický, 1897). Bernat and Štědra (2003)
presented a hypothesis that the Devil’s Furrow is relic of a prehistoric pathway. According to Bernat and Štědra (2003)
the Devil’s Furrow includes many branches, which led north approximately parallel to each other. The main hollow way was in some parts even 20m wide and up to 6m deep. Part of this hollow way has been backfilled with soil for agricultural needs. Big part of the area is covered by forest. The theory by Bernat and Štědra was based partly on a terrain formation which is
located south of the Moštice grange. According this theory, the terrain formation is a relic of a pathway cut formed since the Neolithic period. Archaeological prospection during the last few years has been carried out to confirm or disconfirm this hypothesis.
Field surveys, literature searches and map searches in the last few years enabled us to divide the area of Devil’s Furrow into three parts, according to the prevailing origin of each part (natural processes or human activity). The Moštice grange belongs to the part where the landscape appearance is strongly influenced by erosion. The comparison of the terrain situation The International Archives of the Photogrammetry, Remote Sensing and Spatial Information Sciences, Volume XL-5, 2014
with the old and current maps (made by Petr Nový from Museum of Central Bohemia in Roztoky) led to the decision that the formations that were formerly considered as anthropological are now considered strictly natural. This new hypothesis is in accordance with a description of Devil’s Furrow from 1903 (Miškovský, 1903), according to the theory that the prehistoric pathway went outside the area of Moštice grange. Another theory connected origin of this formation to neighbouring geological fault, this theory was rejected after consultation with geologists. To understand the entire situation better, we decided to use the airborne laser scanning dataset. A more detailed analysis of the situation could be made after DMT processing.
1.3 Data
In our project, we used data acquired by the Czech Office for Surveying, Mapping and Cadastre. Between years 2010 and 2013 the entire area of the Czech Republic was mapped by ALS (full-waveform scanner RIEGL LMS 680 was used). Investors of this project were the Czech Office for Surveying, Mapping and Cadastre, the Ministry of Defense and the Ministry of Agriculture of the Czech Republic. This dataset is being used to obtain a highly accurate digital terrain model for the purposes of administration, for example in the detection of flooded areas, orthorectification of areal images etc. Parameters for scanning were set to gain a point cloud with a density of about 1 point/m2 and with a side overlap of adjacent strips of about 50%. Different parameters were used depending on the season - during spring an average flying height of approximately 1400m above ground level and a flight lines distance of about 830m, during the vegetation season an average flying height of
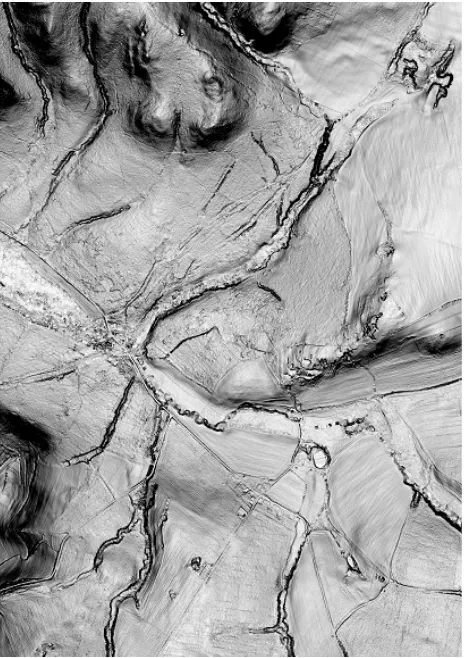
Figure 1. Shaded relief
approximately 1200m above ground level and a flight lines distance of about 715m. Typical product of this mapping is a DTM in form of a regular grid or an irregular triangular network (TIN). Further details can be found in (Dušánek, 2011).
The density of the filtered point cloud (for many areas, lower than 1 point/m2) is not sufficient for every application. Nevertheless, it has been successfully used in archaeological projects before (Faltýnová et al., 2013; Faltýnová; Pavelka 2013; Dušánek, 2011). The dataset in the form of a classified point cloud was used and all other outputs were based on this dataset. The classification of the point cloud was done as a part of previous work at our department (Petr, 2013).
2. PROCESSING
2.1 Visualization
For archaeological purposes is essential to visualize the DTM based on ALS in an appropriate way to highlight the topographic changes caused by human activity. The most widely used DTM visualization method in archaeology is shaded relief (also called hill-shading). Shaded relief simulates the cast shadow thrown upon the represented surface; it produces an appearance of three-dimensional space and can visualize even small height variations and terrain discontinuities typical for man-made objects. Unfortunately, objects parallel to the illumination direction are not visible in shaded relief (Doneus; Briese, 2006). This problem can be solved by using two shaded reliefs with perpendicular illuminations.
Figure 2. Slope image
Figure 3. Aspect image - branches of a pathway crossing hillside (slope image)
Besides, some authors have presented other visualization methods such as sky-view factor (Zakšek et al., 2011), aspect or slope images, etc. Dušánek (2011) presented color composed shaded relief which is a combination of three shaded relief images (red, green and blue color) illuminated from azimuths 315°, 195° and 75°. A review of DTM visualization methods used in archaeology was offered by Bennett et al. (2012).
Spatial resolution of all images was set to 1m (according to point cloud density, i.e. one point for one pixel). At first, we prepared shaded relief, as this enabled us to find the main terrain formations of the region and specify the area of interest (Fig. 1). Unfortunately, shaded relief is dependent on illumination direction (as mentioned above) and doesn’t highlight objects parallel to it. This could be solved only by using more images with different illumination directions or their combination. Another disadvantage is that shaded relief gives man only a basic appearance of the terrain, but doesn’t allow e.g. to compare the steep of different parts of hillside (because these can be influenced by different orientation to illumination direction).
We preferred slope image, in which each pixel is coloured according the local terrain slope. Slope image highlights all terrain slope changes. It helped us identify steep slopes along water erosion furrows (Fig. 2). The disadvantage of this visualization lies in problematic differentiation between edges and valleys.
The next visualization method that we have tested was an aspect image. Pixels of the aspect image are coloured according local slope orientation. The advantage of this methods lies in the simple identification of valley lines (Fig.3) – change of colour in image signals a change of slope orientation, i.e. a crest or valley line.
None of these visualization techniques made it possible to display small terrain variances, and neither after the application of image filtering methods to highlight these variances. Finally, we found inspiration in methods applied by Doneus a Briese (2006) and Bofinger and Hesse (Cowley, 2011). Doneus and Briese used a simple difference map between the DTM and its low pass or median filtered derivative, contrary to Bofinger a
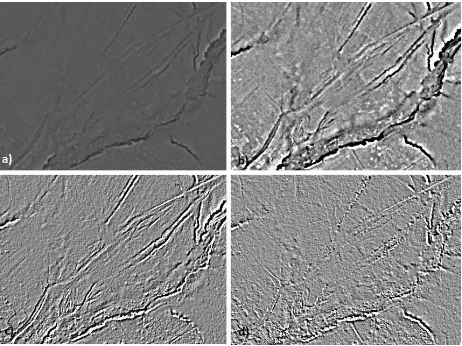
Hesse who created the smoothed DTM in two steps to get more reliable elevations of small features over terrain. We created a smoothed DTM and subtracted it from the original DTM. This DTM was then visualized in the form of a height image. The height differences were transformed linearly into gray-scale. Afterwards, the image histogram was stretched (the values 0/256 were set to higher/lower values than the extreme values were). This procedure finally highlighted even small terrain variances (Fig. 4 a), b)).
The difference DTM in the form of the height image with 1m resolution was filtered using Envi software. We applied a low pass filter with kernel size 3x3 to slightly reduce the noise. Then we tested Sobel Edge Detector and Gaussian High Pass filter to enhance local image variations, but we didn’t get better results than after applying histogram stretching. The local differences (caused by searched terrain discontinuities) in image were too small in comparison to data noise. A directional filter (first derivative edge enhancement filter) was applied on image. It can be used to clarify objects of a specific orientation. We applied it on a group of parallel tracks. It appears useful for highlighting objects of known orientation, if similar orientation is used for filtering (Fig. 4 c).
2.2. Prospection
Different outputs were used for final analysis of the situation. These techniques enabled the highlighting of some of the terrain details important for the correct interpretation of terrain relics around Moštice grange. North from Moštice brook, relics were found of rectangular enclosures related to forestry in the first
The most important part for our area of interest was the erosion cut on the opposite site of Moštice brooks (Fig. 3). The shapes of the profile made across the erosion cut correspond to clearly natural origins (obvious in slope image). The shape of the erosion cut matches with features drawn in the map from the
Figure 4. a) Difference DTM (original), b) Difference DTM (stretched histogram), c) Direction filer - 40° (applied on b)), d) Direction filter - 130° (applied on b))
Figure 5. Branches of a pathway crossing hillside
Second Military Mapping Survey performed between the years 1836-1852, with parts of erosion cut not visible in terrain at the present time – because of later terrain modification. This reconstruction of the terrain shape and its size confirm the geological origin of the cut and its connection with water erosion occurring on the hillside over the village of Mělník.
This erosion cut turns to the west instead of the south (aspect image, Fig. 3), which was assumed in the hypothesis about theprehistoric pathway. The cut is still connected with a similar brook bed that springs south from village of Mělník. The
erosion cut has been successively damaged since the 19th century by agricultural activities, as its main parts were used for the construction of a motorway from Moštice to Mělník in 20th
century.
Difference DTM modified by direction filter (40°) was used for tracks analysis (Fig. 5). This tracks are part of way going from village of Vlkančice, the way went around Moštice grange, than
across brook and uphill. The way was during centuries shifted again and again because of muddy terrain. The right branch was later partly damaged by forestry and the left branch by modern tarmac track.
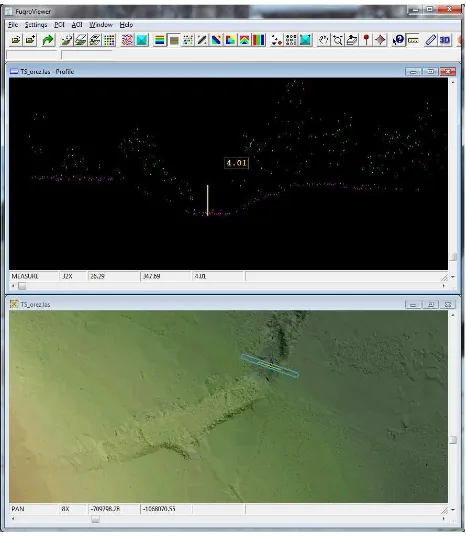
The used visualization techniques enabled us to identify different terrain formations, as well as define their outlines and position. But all findings (e.g. furrows, hollow ways) had to be described more precisely than how it is able according slope and other images. The estimated spatial shape of found features was confirmed by creating cross sections in important positions (Fig. 6) and if necessary later by field survey.
3. CONCLUSION
The airborne laser scanning technology allowed us to verify the natural character of the southern part of Devil’s Furrow, an area with impressive erosion formations that served as an inspiration for the origin of the Devil’s Furrow legend. The usage of different visualization techniques on one site proved to be a good decision.
All this techniques have a great potential in archaeological prospection. These techniques can be used on DTM acquired by different approaches. Great progress in LIDAR technology enabled to create smaller LIDAR sensors, which led to origin of LIDAR systems based on unmanned aerial vehicles (UAVs). DTMs based on aerial laser scanning will be more and more
Figure 6. Cross section
available. Also datasets from UAV systems, that use structure from motion (SfM) approaches, can be used. Unfortunately, this systems still had the great disadvantage of photogrammetric methods – they are not able to create DTM in forested areas.
3.1 References
Bennett, R. et al., 2012. A Comparison of Visualisation Techniques for Models Created from Airborne Laser Scanned Data. Archaeological Prospection, 19, 2012, pp. 41-48.
Bernat, J.; Štědra, M., 2003. Čertova brázda, stará severojižní
stezka mezi Labem a Sázavou. In Lutovský, M., Archeologie ve středních Čechách 7/1. Praha: Ústav archeologické památkové
péče středních Čech, pp. 349–362.
Cowley, D., 2011. Remote Sensing for Archaeological Heritage Management. EAC, 312 p., ISBN 978-963-9911-20-8.
Doneus, M.; Briese, CH., 2006. Full-waveform airborne laser scanning as a tool for archaeological reconnaissance. From Space to Place: 2nd International Conference on Remote Sensing in Archaeology, Archaeopress, Oxford, pp. 99–105.
English Heritage, 2011. 3D Laser Scanning for Heritage: Advice and Guidance to Users on Laser Scanning in
Archaeology and Architecture. 41 p.,
http://www.english-heritage.org.uk/publications/3d-laser-scanni ng-heritage2/3D_Laser_Scanning_final_low-res.pdf (30. Mar. 2014).
Falýnová, M.; Pavelka, K.; Nový, P., 2013. Mapping and Visualisation of a Part of Medieval Road – Via Magna. 13th International Multidisciplinary Scientific Geoconference SGEM 2013, Conference Proceedings volume II. Sofia: STEF92
Technology Ltd., pp. 633–638. ISSN 13-14-2704. ISBN 978-619-7105-01-8.
Faltýnová, M.; Pavelka, K., 2013. Relics of Mining Activities in West Bohemia – Mapping by Airborne Laser Scanning.
International Archives of the Photogrammetry, Remote Sensing
and Spatial Information Sciences, vol. 2013, no. XL-5/W2, pp.
261-263. ISSN 2194-9034.
Dušánek P., 2011. Exploitation of countrywide airborne LIDAR dataset for documentation of historical human activities in countryside, Geoinformatics [online], vol.6, no.1, pp.
97-102, 2011, ISSN 1802-2669,
http://geoinformatics.fsv.cvut.cz/pdf/geoinformatics-fce-ctu-2011-06.pdf (20. Apr. 2014).
Kramařík, J.; Ryneš, V., 1977. Legenda o orajícím ďáblovi, Vědecké práce Zemědělského muzea 16, pp 77-90.
Miškovský, J., 1903. Po Čertově brázdě z Chotouně do
Sázavy. Naše hlasy: časopis věnovaný zájmům našeho lidu, iss.
23.
Petr, J., 2013. Tvorba digitálního modelu terénu z dat leteckého laserového skenování. Bachelor thesis. Department of Mapping and Cartography, Faculty of Civil Engineering, Czech Technical University in Prague, pp. 52.
Vrchlický, J., 1897. Legenda o svatém Prokopu. Praha: J. Otto,
153 p.
Zakšek, K.; Oštir, K.; Kokalj, Ž., 2011. Sky-View Factor as a Relief Visualization Technique. Remote Sensing, 2011/3, pp. 398-415, ISSN 2072-4292.
3.2 Acknowledgements and Appendix (optional)
This research has been supported by the Ministry of Culture under project NAKI – DF13P01OVV002.
The authors thank the Czech Office for Surveying, Mapping and Cadastre for lending the ALS dataset.