EXTRACTING HUMAN BEHAVIORAL PATTERNS BY MINING GEO-SOCIAL
NETWORKS
M.Forghani a, , F.Karimipour a
a Department of Surveying and Geomatic Engineering, College of Engineering, University of Tehran, Tehran 14174, Iran
E-Mail: (mo.forghani, fkarimipr)@ut.ac.ir)
KEY WORDS: Geo-Social Network, Check-in, Association Rules, Category of Venue, Data Mining
ABSTRACT:
Accessibility of positioning technologies such as GPS offer the opportunity to store one’s travel experience and publish it on the web. Using this feature in web-based social networks and considering location information shared by users as a bridge connecting the users’ network to location information layer leads to the formation of Geo-Social Networks. The availability of large amounts of geographical and social data on these networks provides rich sources of information that can be utilized for studying human behavior through data analysis in a spatial-temporal-social context. This paper attempts to investigate the behavior of around 1150 users of Foursquare network by making use of their check-ins. The authors analyzed the metadata associated with the whereabouts of the users, with an emphasis on the type of places, to uncover patterns across different temporal and geographical scales for venue category usage. The authors found five groups of meaningful patterns that can explore region characteristics and recognize a number of major crowd behaviors that recur over time and space.
1. INTRODUCTION
In general, a social network is defined as a communicative framework between constituents of the network that reconstructs users’ social relations in environments such as websites, and provides opportunities to users for sharing their ideas, activities, events and interests on internet. In recent years, membership rates have increased dramatically in web-based social networks such as Facebook1, Twitter2 and LinkedIn3. On the other hand, portable digital devices such as smart phones have advanced considerably and been welcomed broadly. Their embedded advanced positioning technologies (such as GPS) and wireless communication (such as Wi-Fi and 3G) have offered great potential for various services such as location-aware services. After emergence of social networks, smart phones, and location-aware services, which were welcomed by users, these components joined forces to form geo-social networks (Karimi, 2009).
Geo-social networks allow users to add the location dimension to the existing social networks through various methods. Current geo-social networks are divided into three general groups in terms of the way location data are shared: networks based on geo-tagged data, networks based on check-in data, and trajectory-centric networks (Zheng & Zhou, 2011).
Check-in based geo-social networks such as Foursquare4 have attracted millions of users to themselves, which is indicative of their broad acceptance and users’ greater than before interest in sharing their location information with their friends.
Although check-in data are apparently poor as they basically consist of user identifiers, coordinates in space, and time stamps, network-based on check-in data are of a venue-oriented nature and thus, rather than only providing users’ geo-coordinates over time, they also provide metadata such as the
1 www.Facebook.com
2 www.Twitter.com 3 www.Linkedin.com 4 www.Foursquare.com
name of the visited venue, its type, comments about it and even photos. Hence, valuable information about the users, as well as about the space and time in which they live, that are termed as human behavioural patterns, can be gained even from such basic data by means of data mining methods.
Most of previous research projects on human behavioural patterns lack semantics as their data were mostly collected through mobile phone coordinate tracking (Preoţiuc-Pietro & Cohn, 2013). This research aims to study human behavioural patterns in relation with venues types at different temporal scales (e.g. time of day, day of week) and geographical scales (e.g. state, province).
In terms of human behavioural patterns, the authors attempt to understand the way people live, what they have in mind and how they interact in their urban environments. For instance, we can find out that people from one part of the globe used to go to public art places more or can detect the downtown area attracting many people on weekends to itself.
Based on behavioural patterns, we can also determine the type of activities that are most common in specific urban areas or localize urban points of interest as places with high activity in a specific context (Martinez, 2012).
association rule mining algorithm to create fingerprints of users and areas.
The remainder of this paper is organized as follows:
Section 2 reviews related works on utilizing geo-social networks to uncover human behavioral patterns. Section 3 explains the concept of association rule mining. Section 4 describes an overall process of data preparing for association rule mining. Section 5 illustrates the experiment that the authors conducted to extract crowd behavioral patterns and urban characteristics through data gathered from Foursquare for Italy. Finally, the conclusion of paper is presented Section 6.
2. RELATED WORK
In recent years, many studies have been conducted on geo-social networks to discover users’ characteristics including social relations, mobility patterns, preferences etc. For instance, in one of the large-scale research studies carried out on geo-social networks (Li & Chen, 2009), much data from these networks such as Brightkite was collected and the results were analyzed in terms of users’ features, their travel experience, and their relation. In another study, researchers attempted to characterize the relationship that exists between people’s cyber interests and their mobility properties (Trestian et al., 2009). In a study by (Gao et al., 2012), the pattern of user check-ins with respect to social-historical ties was explored. For example, they found out that users with friends tend to go to similar locations than those without.
In addition, a number of researches were carried out in this field in order to discover the geo-spatial characteristics. For example, in a study on extremely large anonymized mobility data, the most visited areas by tourists during the day and the typical time of the visits were identified (Reades et al., 2009). In another study, a probabilistic topic model was adopted for extraction of urban patterns and recurrent behaviors from location-based social networks (Ferrari et al., 2011). Also in a research carried out by (Lee et al., 2013), a novel method was proposed to discover urban characteristics by exploiting common behavioral patterns.
3. ASSOCIATION RULE MINING
Association rule mining is one of the most important and well researched techniques of data mining which aims to extract interesting correlations, frequent patterns, associations or casual structures among sets of items (Han, 2000).
Unlike other data mining functions, association is transaction-based. In transactional data, a collection of items is associated with each case. The collection can theoretically include all possible members of the collection. However, in actuality, only a tiny subset of all possible items is present in a given transaction.
The first step in association analysis is the enumeration of item sets. An item set is any combination of two or more items in a transaction. The maximum number of items in an item set is specified by the user. If the maximum is two, all the item pairs will be counted. If the maximum is greater than two, all the item pairs, all the item triples, and all the item combinations up to transactions that occur with a specified minimum frequency. These combinations are called frequent item sets;
Calculating the rules that express the probable concurrence of items within frequent item sets.
One of the most well-known algorithms to solve association rule mining is Apriori algorithm (Han & Kamber, 2006). The Apriori algorithm calculates the rules that express probabilistic relationships between items in frequent item sets. For example, a rule derived from frequent item sets containing A, B, and C might state that if A and B are included in a transaction, then C is also likely to be included. The IF component of an association rule is known as the antecedent. The THEN component is known as the consequent.
3.1 Metrics for Association Rules
Support
The support of a rule indicates how frequently the items in the rule occur together. Support is the percentage/fraction of transactions that include all the items in the antecedent and consequent to the total number of records in the database.
Confidence
The confidence of a rule is the conditional probability of the consequent given the antecedent. It is a measure of strength of the association rules.
Association rule mining is to find out association rules that satisfy the predefined minimum support and confidence from a given database. However, there are times when both of these individual support. It provides information about the improvement, the increase in probability of the consequent given the antecedent. Lift is defined as follows:
In this section, the source of the utilized data is first presented briefly and then the method used for data collection and preparation for data mining process is presented.
4.1 Data Set
Foursquare dataset5 was used to study the behavioral patterns on geo-social networks. Foursquare is one of the most popular
5 The dataset is available at
online location-based social networks. It has more than 50 million users and 6 billion check-ins as of August, 20146. The check-in data related to the study area (Italy) was extracted from source data. The resulted dataset contained the check-in history of 1170 users, beginning from January 2011 to December 2011 (151952 check-ins over 5839 distinct places).
4.2 Data Cleaning and Transforming
To make this analysis more effective, the authors needed to review all collected data to complete it with more detailed information and to remove less significant fields. Association rule mining technique cannot work with all types of information but specific formats and values are required to discover facts, principles or relationships.
The model employed to organize data around facts was composed of three dimensions including: location type, time and geographical area. Each of these dimensions or sets of information, were extended to obtain more in-depth information.
4.2.1 Type Dimension
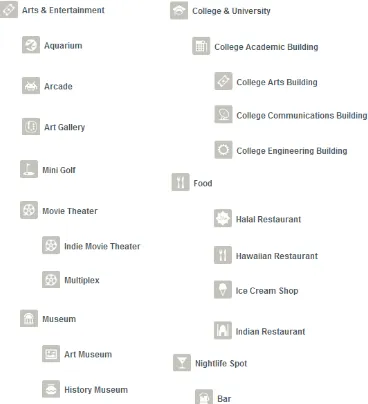
Foursquare Venue Categories7: web service returns a hierarchical list of categories applied to venues. This service is used to know the semantic type of places visited by users. There is a defined reference category hierarchy by Foursquare that is used in this research. It constitutes 10 major categories including Arts & Entertainment, College & University, Event, Food, Nightlife Spot, Outdoors & Recreation, Professional & Other Places, Residence, Shop & Service and Travel & Transport. As shown in figure 1, each of these categories is divided to a number of sub-categories too.
Figure 1: A sample view of some parts of location category tree.
4.2.2 Time Dimension
Time-dependent data is especially important for obtaining human behavior patterns. The timestamp field of check-ins was transformed to new attributes with more relevant values. Figure 1 illustrates the new types of time fields.
6 https://foursquare.com/about/
7 https://api.foursquare.com/v2/venues/categories
Figure 2: Date transformation
The Time-Intervals were defined as Morning (4:00 a.m. – 11:59:59 a.m.), Afternoon (12:00 p.m. - 7:59:59 p.m.) and Evening (8:00 p.m. - 3:59:59 a.m.). The non-working days included Saturdays, Sundays and public holidays of Italy for 2011 (Table 1).
Saturday January 01 New Year’s Day
Thursday January 06 Epiphany
Thursday March 17 Anniversary of national unification
Monday April 25 Liberation Day
Monday April 25 Easter Monday
Sunday May 01 Labour Day
Thursday June 02 Republic Day
Monday August 15 Assumption Day
Tuesday November 01 All Saints Day
Thursday December 08 Immaculate Conception Day
Sunday December 25 Christmas Day
Monday December 26 St Stephens Day
Table 1. Public Holidays.
4.2.3 Geographical Dimension
As described before, one of the check-in data elements is their geographical coordinates. Venues were located based on check-in coordcheck-inates check-into three admcheck-inistrative levels: state, provcheck-ince and commute. This way, human behavioral patterns can be studied, and the results gathered in these three levels can be analyzed.
Figure 3. Geographical adminestrative scales: (a) state (b) province (c) commute
5. EXPERIMENT AND INTERPRETATION
Apriori algorithm was implemented to discover association rules from prepared data. To do this, the KNIME software was utilized. KNIME is a user-friendly graphical workbench for the entire analysis process: data access, data transformation, initial investigation, powerful predictive analytics, visualization and reporting. Figure 4 shows a sample part of data prepared as input for data mining process.
Figure 4. A sample part of input data.
5.1 Experiment setup
At first, features of input data were transformed to collection type to make them available for the association rule mining. In addition, a number of settings were available in many association algorithm implementations. These settings mostly cover the minimal cut-off points for the major evaluation criteria of the output rules such as support, confidence and lift. In association rule mining, the degree of dependency between items is described by confidence and since we are looking for
expensive correlated items, the confidence criterion is actually more important than support in this study. The minimum support and confidence level were considered as 0.1 % and 40.0 % respectively. As for the minimum lift value, it was set to 1.0 to discover meaningful patterns.
5.2 Results
In this section, the dataset was investigated by extracting crowd human behavioural patterns relating to the spatial-temporal rules that were observed. It was also attempted to characterize geo-space according to them. The mined rules are explained in detail as follows:
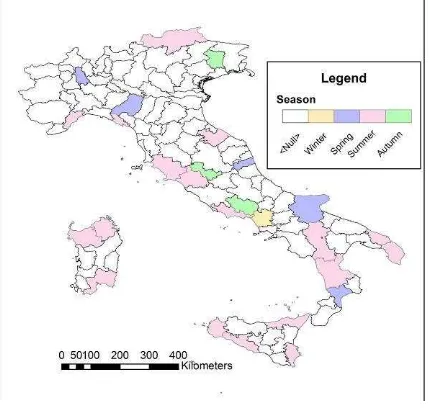
Pattern 1: The relation between human activity level and seasons of year in different regions: Based on some extracted association rules (a number of which is presented in Table 2), the rate of check-ins culminate in a special season of year in some provinces. This can be due of geo-social situation of those regions. The geographical distribution of these patterns is presented in Figure 5.
Sup. Conf. Lift Consequent Antecedent
0.14 84.8 3.03 3 [Olbia-Tempio]
0.34 62.71 2.76 4 [Terni]
0.12 47.12 2.4 1 [Caserta]
0.15 61.31 2.19 3 [Trapani]
0.92 44.84 1.97 4 [Pordenone]
0.14 55.84 1.88 2 [Ascoli Piceno]
Table 2. A number of mined rules which present the dependency of regions’ activity-level on seasons
Figure 5. Geographical distribution of pattern 1.
Pattern 2: the frequency of check-ins in all states except one in workdays is more than rest days: this pattern is not surprising as the number of workdays is actually more than the number of rest days and so the number of check-ins should be higher generally. This pattern has an exception which is discovered as a rule in the form of “[Valle d'Aosta] [Rest day]” with a confidence of about 62%. Aosta Valley is the smallest Italian region and is located at the "hub" of the Alps. (b)
The region looks like an island among the mountains, it is well-known as a touristy destination because of its peaceful atmosphere in summer and snow in winter. Considering these explanations, this kind of rules can be a useful indicator for touristy districts.
Pattern 3: the temporal-spatial correlation of human activity level: Based on this kind of pattern, the effectiveness of spatial-temporal correlations of activity rate can be investigated. The authors were interested in how crowd human behavior rate (is represented by check-in frequency) in different commutes is affected by the temporal situations (morning, afternoon and evening). Figure 6 presents the extracted rules on a map.
Figure 6. Activity rate in different commutes heightens at different time intervals.
Pattern 4: Dependency of the number of check-ins for each category on time context: Based on some extracted association rules (a number of which is presented in Table 3), the frequency of check-ins in venues at different time slots can be examined by looking at a specific category of venues. For instance, regarding a rule in the form of “[Bookstore] [Afternoon]”, a trend with a confidence of about 67% showing that people tend to go to bookstores more in the afternoons rather than mornings or evenings can be noticed.
Sup. Conf. Lift Consequent Antecedent
0.11 52.56 1.12 Afternoon [Chinese Restaurant]
0.11 66.94 1.76 Morning [Public Art]
0.24 55.96 1.47 Morning
[General College & University] 0.36 52.81 1.13 Afternoon [Museum]
0.37 53.29 3.54 Evening [Nightclub]
0.39 73.44 1.57 Afternoon [Stadium]
0.52 56 1.47 Morning [School]
1.44 58.4 1.25 Afternoon [Mall]
Table 3. A number of mined rules presenting the dependency of activity level in different place categories on the time context.
In addition to the above rules, a rule in the form of “[Beach] [3]” was also observed; this rule states that most visits to beaches take place in summer. There is another rule in the form of “[Beach,2] [Rest day]” expressing that beach visits in spring usually take place in non-working days.
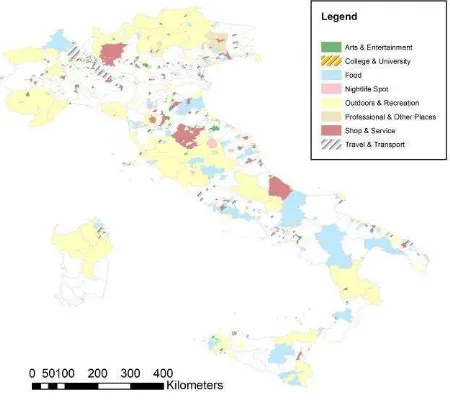
Pattern 5: region functionality: in this section, the authors aimed to discover regions of different functions in urban areas using human behavioral patterns. The function of each region was extracted from the associated rules in the form of “Administrative Area Venue Category” with a confidence of more than 40%. This implied that most of the activities in the region had the same context, or the region was well-known because of a particular functionality. But it did not mean that the region had only venues merely for one category.
Specifically, we filled the regions (the areas in province and commute scale) having similar major categories with the same color as illustrated in Figure7.
Figure 7. Discovering regions of different functions in Italy.
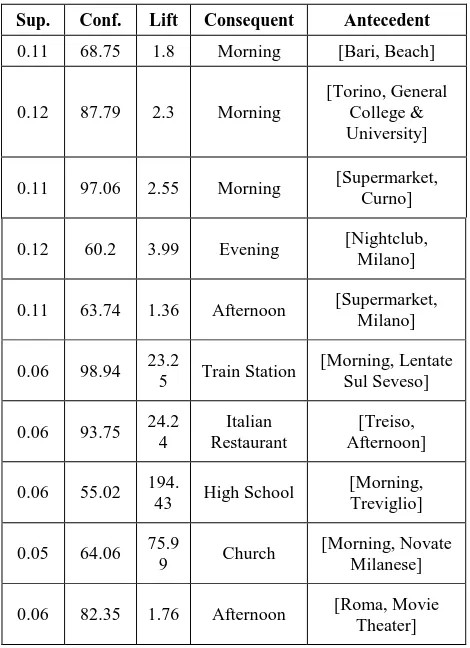
A number of mined rules indicating the correlation between some commutes and sub-categories are presented in Table 4.
Sup. Conf. Lift Consequent Antecedent
0.53 75.54 27.21 Airport [Fiumicino]
0.22 55.63 65.99 Church [Fanna]
0.18 76.31 13.55 Office [Capannori]
0.14 89.02 38.19 Hotel [Burago Di Molgora] 0.11 62.27 78.39 Supermarket [Curno]
0.09 93.06 257.09 Theater [Vobarno]
Table 4. A number of mined rules which relate a specific functionality to each commute.
Sup. Conf. Lift Consequent Antecedent
0.11 63.74 1.36 Afternoon [Supermarket, Milano]
Table 5. A number of associated rules indicating socio-temporal characteristics of commutes.
6. CONCOLUTION
Geo-Social networks contain a multi-layer data structure including geographical, temporal and contextual information, providing an unprecedented opportunity for studying crowd human behavior. Investigating such information can help design new applications of more similarity to users’ daily life, and thus improve the experience of urban life.
In this paper, the authors studied recurrent behaviors combining the temporal information about the whereabouts of users with information on the types of places they visit in different administrative areas. The investigation of various properties of users’ behavior using massive geo-tagged contents on Foursquare network resulted in discovering interesting associations and daily life patterns regarding multiple aspects. In addition, the authors attempted to discover crowd behavioral features for different administrative areas and extract regional characteristics by exploiting common behavioral patterns. The experimental results exhibit the power of association rule mining method for capturing crowd behavioral patterns.
ACKNOWLEDGEMENTS
The authors of the current paper would like to thank Arizona State University, School of Computing, Informatics and Decision Systems Engineering department (Gao and Liu, 2014) for providing Location-Based Social Network Data Repository that was utilized in this research.
REFERENCES
Ferrari, L., Rosi, A., Mamei, M., & Zambonelli, F. 2011. Extracting urban patterns from location-based social networks. In Proceedings of the 3rd ACM SIGSPATIAL International Workshop on Location-Based Social Networks (pp. 9-16). ACM.
Frias-Martinez, V., Soto, V., Hohwald, H., & Frias-Martinez, E. 2012. Characterizing urban landscapes using geolocated tweets. International Confernece on Social Computing (SocialCom) (pp. 239-248). IEEE.
Gao, H., Tang, J., & Liu, H. 2012. Exploring Social-Historical Ties on Location-Based Social Networks. In ICWSM.
Han, J. & Kamber, M. 2006. "Data Mining: Concepts and Techniques 2nd Ed," Academic Press.
Han, J., Pei, J. & Yin, Y. 2000. "Mining Frequent Patterns without Candidate Generation," ACM-SIGMOD Int. Conf. Management of Data (SIGMOD’00), Dallas, 1-12.
Karimi, H. A., Zimmerman, B., Ozcelik, A., &
Roongpiboonsopit, D. 2009. SoNavNet: a framework for social navigation networks. In Proceedings of the 2009 International Workshop on Location Based Social Networks (pp. 81-87). ACM.
Lee, R., Wakamiya, S., & Sumiya, K. (2013). Urban area characterization based on crowd behavioral lifelogs over Twitter. Personal and ubiquitous computing, 17(4), 605-620.
Li, N., & Chen, G. 2009. Analysis of a location-based social network. In Computational Science and Engineering, 2009. CSE'09.
Preoţiuc-Pietro, D., & Cohn, T. 2013. Mining user behaviours: a study of check-in patterns in location based social networks. Measuring serendipity: connecting people, locations and interests in a mobile 3G network. In Proceedings of the 9th ACM SIGCOMM conference on Internet measurement conference (pp. 267-279). ACM.
Yuan, J., Zheng, Y., & Xie, X. 2012. Discovering regions of different functions in a city using human mobility and POIs. In Proceedings of the 18th ACM SIGKDD international conference on Knowledge discovery and data mining (pp. 186-194). ACM.


