RADIOMETRIC QUALITY EVALUATION OF INSAT-3D IMAGER DATA
Shilpa Prakash*, Deepika Jindal*, Neeraj Badal*, B. Kartikeyan*, B. Gopala Krishna*
*Image Analysis and Quality Evaluation Division, SPDCG, SIPA, SAC, ISRO, Satellite, Jodhpur Tekra, Ahmedabad-380 015 Gujarat- India *(pshilpa, deepika, neerajbadal, bkartik, bgk)@sac.isro.gov.in
KEY WORDS: INSAT-3D, Level-1, Radiometric Quality, DQE, MTF, TIR-1, MIR, Brightness Temperature, NEdT
ABSTRACT:
INSAT-3D is an advanced meteorological satellite of ISRO which acquires imagery in optical and infra-red (IR) channels for study of weather dynamics in Indian sub-continent region. In this paper, methodology of radiometric quality evaluation for Level-1 products of Imager, one of the payloads onboard INSAT-3D, is described. Firstly, overall visual quality of scene in terms of dynamic range, edge sharpness or modulation transfer function (MTF), presence of striping and other image artefacts is computed. Uniform targets in Desert and Sea region are identified for which detailed radiometric performance evaluation for IR channels is carried out. Mean brightness temperature (BT) of targets is computed and validated with independently generated radiometric references. Further, diurnal/seasonal trends in target BT values and radiometric uncertainty or sensor noise are studied. Results of radiometric quality evaluation over duration of eight months (January to August 2014) and comparison of radiometric consistency pre/post yaw flip of satellite are presented. Radiometric Analysis indicates that INSAT-3D images have high contrast (MTF > 0.2) and low striping effects. A bias of <4K is observed in the brightness temperature values of TIR-1 channel measured during January-August 2014 indicating consistent radiometric calibration. Diurnal and seasonal analysis shows that Noise equivalent differential temperature (NEdT) for IR channels is consistent and well within specifications.
1. INTRODUCTION
INSAT-3D is an advanced geostationary meteorological satellite of ISRO launched on 26th July 2013. It has two payloads namely six channel Imager and nineteen-channel Sounder. Imager on-board INSAT-3D acquires half hourly images of earth having spatial resolution ranging from 1-8 km in various spectral channels. There are six channels in Imager : Visible (VIS) - (0.55-0.75 μm), Short-wave Infra-red (SWIR) – (1.55-1.7 μm), Mid-Infra-red (MIR) – (3.8-4.0 μm), Water Vapour (WV) – (6.5-7.1 μm) and two Thermal Infra-red (IR) channels (TIR-1 & TIR-2) – (10.3-11.3 μm) and (11.5-12.5
μm) respectively. From raw (Level-0) data, systematically corrected basic (Level-1) products are generated, which are further used to generate physical (Level-2) products. Geo-physical products such as Sea-Surface Temperature (SST), Upper Tropospheric Humidity (UTH), Outgoing Longwave Radiation (OLR) are derived operationally, used for weather and climate applications.
INSAT-3D is specially designed to achieve 24x7 imaging in infra-red (IR)/visible channels from geo-stationary platform and meet desired accuracy requirements. Some of the typical features of Imager payload are – Use of servo controlled scan-mirror to achieve 18degx18deg earth coverage, use of short strip of detectors and whisk-broom scanning for image generation, cooling patch for IR detectors for detection of thermal signal and in-orbit calibration of IR channels by periodically viewing warm black-body/cold deep space. Motion compensation techniques are used to account for short/long term attitude disturbances due to scan mechanism and station-keeping errors. Satellite is also given a bi-annual yaw-flip for better thermal management.
Data quality evaluation (DQE) is very important ground segment activity carried out to ensure quality of basic data products (Level-0 and Level-1) which in turn affect the quality of geo-physical parameters. Purpose of quality monitoring is firstly, to monitor in-orbit sensor health by means of validation of telemetry/raw (Level-0) data and secondly to derive radiometric and geometric quality parameters from Level-1 data products. Regular monitoring of quality brings out quality trends which are used as feedback to various mission teams to improve end-quality of data products. In-house developed DQE software for carrying out regular evaluations is developed and operationalised at one of the ground stations-MOSDAC, Ahmedabad.
In this paper, radiometric quality evaluation carried out for Level-1 data products of Imager is described. Radiometric quality evaluation is carried out to study following aspects - a) Overall radiometric quality of scene in terms of dynamic range, feature sharpness, presence of striping due to detector non-uniformity and presence of image artefacts b) Radiometric performance in terms of mean brightness temperature (BT) of Land/Sea targets and validation with radiometric references c) Diurnal and Seasonal trends in BT values for identified targets and d) Sensor noise performance in terms of variation in Noise equivalent differential temperature (NEdT) for different IR channels. In section 2, methodology and terminology used for scene level and target based quality evaluation is described. Results of scene based quality are detailed in Section 3. Target based analysis for IR channels for Desert and Sea targets, diurnal/seasonal quality trends and comparisons with radiometric references are summarized in Section 4. Sensor noise performance for IR channels, diurnal/seasonal stability and comparisons with specifications is provided in Section 5.
2. METHODOLOGY FOR RADIOMETRIC DATA QUALITY EVALUATION (RDQE)
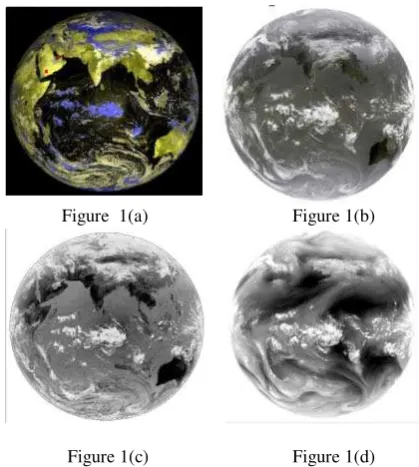
Radiometric evaluation is performed on Level-1 standard products of Imager which are geometrically corrected and radiometrically calibrated. Images acquired by Imager for 1st March 2014 (06:00GMT) in Visible/SWIR, TIR-1, MIR & WV bands are shown in Figure-1.
Figure 1(a) Figure 1(b)
Figure 1(c) Figure 1(d)
Figure 1. a) INSAT-3D Level-1 Image in VIS/SWIR b) TIR-1 c) MIR and d) WV bands
There are six images corresponding to various channels stored in Hierarchical Data Format (HDF). Navigation grids, ephemeris information, Radiometric look-up-tables (LUTs) for conversion of Count to Radiance or Count to Brightness temperature (BT) and other meta-information such as station ID, date and time of acquisition are also available with product. RDQE activities as described in Table-1 are carried out on products generated at MOSDAC facility and feedback on quality is provided to payload and data products teams.
RDQE Activity
Quality Aspect Quality Parameter
Scene-Based RDQE
Visual Quality Scene Dynamic Range Edge Sharpness (MTF) Table-1. RDQE parameters
2.1 Scene Based RDQE
In scene based analysis, visual quality of scene is quantified by using gray (DN) counts of images. Due to poor visual quality, feature extraction and image interpretation may get affected.
Therefore for visual quality assessment, scene dynamic range, edge sharpness, image striping and image artefacts are analysed.
Scene dynamic range for each channel is computed as the difference of maximum and minimum count value of pixels in the image. For Imager, sensor can measure upto 1024 gray levels in all channels. Scene dynamic range is computed by generation of image histogram and performing 0.01% clipping on it. Broader range indicates good contrast in an image.
To identify details in an image, edge sharpness plays a significant role. Blurring of edges can occur due to various sensor specific degradations such as diffraction at optics, averaging by detectors and motion effects. Modulation Transfer Function (MTF) is estimated from natural edges of image to describe sharpness of imaging system. MTF is a measure of transfer of modulation (or contrast) from subject to image. It is measured before launch, however, to assess the effects on sensor due to launch vibrations or on-board temperature variations, in-orbit measurement of MTF is required.
In Imager, a short, staggered strip of detectors and whisk broom scan mechanism is used for generation of two-dimensional images in various channels. There are eight detectors for VIS/SWIR channels, two detectors for TIR-1/TIR-2//MIR channels and one detector for WV channel. Due to non-uniformity in response between individual detector elements, horizontal striping effect may be seen on homogeneous areas of image. This type of artefact is called residual striping. It is measured in counts as difference in gray values of successive image lines over homogeneous regions such as water. Other artefacts may also be present in a scene such as image banding or pixel saturation due to sun-glint. These anomalies are identified during overall radiometric quality assessment.
2.2 Target Based RDQE
In target based analysis, uniform targets such as Desert or Sea are marked as polygons on full resolution image. It is known (Charles Elachi, 2006 and George Joseph, 2005) that infra-red signal received by sensor is dependent on surface temperature, surface emissivity and atmospheric interference. Emissivity of the surface of a material is its effectiveness in emitting energy as thermal radiation. To study the pattern of emission of energy by these surfaces (Desert/Sea) in different channels, mean Radiance/BT values for target are computed using DN counts of target through radiometric LUTs. Ancillary information for each target like centre latitude/longitude, sun azimuth/elevation are also computed using meta-information provided with data product.
Mean Target Radiance/BT is computed using all pixels lying in target polygon. Spectral profile of mean radiances for different targets are validated at different times of acquisition/seasons, using independently computed radiometric references.
For generation of Radiometric references, at-Sensor Radiance/BT values are estimated for different channels using profiles of temperature, moisture, surface temperature, surface pressure, surface emissivity and sensor spectral response function as input to Radiative Transfer Model. Reference generation procedure is described in (Singh R., 2009). As mentioned earlier, Level-1 products are radiometrically
calibrated. GSICS (Global Space-based Inter-Calibration System) is used for radiometric calibration of IR channels. Here, hyper-spectral Infrared Atmospheric Sounding Interferometer (IASI) on the low earth orbit (LEO) Metop satellite is used as a common cross-calibration reference.
Standard deviation in homogeneous targets is computed to estimate noise equivalent uncertainity in radiometric measurement. For VIS/SWIR channels, Signal-to-Noise ratio (SNR) is computed, whereas for IR channels, noise equivalent differential temperature (NEdT) is estimated. Noise estimated from image is validated with sensor specifications, diurnal trends in noise are also studied.
Radiometric analysis shown in this paper is done using in-house developed RDQE software (Figure 2). Using this software, data extraction, image display, interactive target-identification and computation of quality parameters is carried out.
Figure 2. RDQE Software for radiometric analysis
In the next section, results of scene-based radiometric quality evaluation are shown.
3. SCENE BASED RADIOMETRIC ANALYSIS
3.1 Scene Dynamic Range
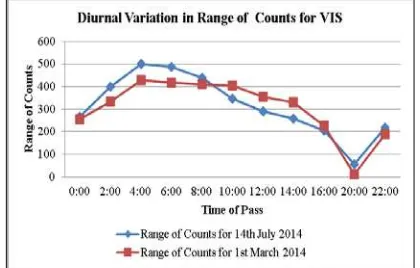
Figure 3 shows diurnal trends in scene dynamic range for TIR-1 and VIS channels for two dates - TIR-1/3/TIR-14 and TIR-14/7/TIR-14. Diurnal variation in scene dynamic range for TIR-1 shows similar pattern for both these dates. The scene dynamic range is found to be varying from 424 to 562 counts for 1/3/14 and 419 to 642 counts for 14/7/14 with a peak at 08:00 hours (GMT). However, for VIS channel, the scene dynamic range shows a peak at 04:00 hours and drops to less than 50 counts at 20:00 hours.
Average difference in scene dynamic range values between two dates is 25 counts for TIR-1 channel and 10 counts for VIS channel.
Table 2 shows diurnal variation in scene dynamic range (%) for all channels of Imager for 1st March 2014 considering 1024 gray levels for 10-bit quantisation of Imager. High values of scene dynamic range indicate good scene contrast and clarity in feature visualisation as seen in Figure.1, which corresponds to
~50% scene dynamic range at 6:00 hrs.
Figure 3 (a). Diurnal variation in scene dynamic range for TIR-1
Figure 3 (b). Diurnal variation in scene dynamic range for VIS
Time of Pass (GMT)
Scene Dynamic Range (%)
TIR-2 MIR WV SWIR
0:00 43.07 26.76 22.85 34.57 2:00 49.22 39.75 23.05 35.25 4:00 52.73 44.92 23.44 44.43 6:00 53.22 46.58 23.24 46.58 8:00 53.61 45.41 23.63 48.34 10:00 53.42 50.29 23.44 47.75 12:00 51.27 45.51 23.83 45.8 14:00 47.85 34.86 25 38.38 20:00 41.89 19.43 21.68 1.27 22:00 41.6 19.43 21.29 19.43
Table 2. Diurnal variation in scene dynamic range for 1/3/14
Diurnal analysis of scene dynamic range for all channels shows that consistent scene contrast for WV and IR channels throughout the day while for VIS and SWIR channels the scene dynamic range drops significantly during night time. This is because VIS/SWIR channels sense reflected radiation, which depends on solar illumination.
3.2 Edge Sharpness-MTF Analysis
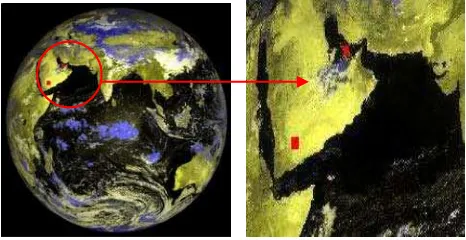
We have used MTF estimation procedure described in (Mattia Crespi, 2009) for estimation of MTF for Imager channels. Natural high contrast edges were located in different channels, for which MTF estimation is carried out. Figure. 4 shows different high contrast edges in INSAT-3D imagery that can be
considered for edge analysis.
Figure 4 (a) Figure 4(b) Figure 4 (c)
Figure 4. Natural Edges for MTF analysis a) Near Gujarat (TIR-1), b) Near Karachi (VIS) c) Near Australia (VIS)
Figure 5 (a) shows edge considered for MTF estimation in various bands for 1st March 2014 8:00 hours (GMT) image. Orientation of edge chosen is perpendicular to fast-scan movement of sensor. Time 8:00 hrs was chosen as it was having high scene dynamic range as described in previous section. For water-vapour, due to difficulty in visually identifying natural edges, MTF estimation was not performed.
Figure 5 (a) Figure 5 (b)
Figure 5 (a). Edge considered for SWIR-MTF analysis, b) Edge profile in fast-scan direction
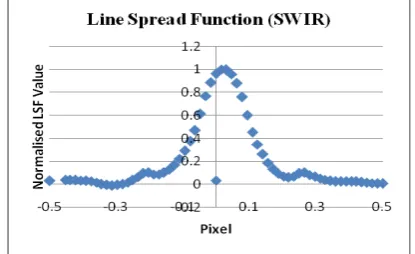
Count profile in the direction perpendicular to edge (indicated by arrow) was extracted from all images. The extracted count profile is shown in Figure 5 (b). Edge profile was further zoomed by ten times using cubic convolution to obtain edge spread function (ESF). Discrete differentiation was applied to obtain Line Spread Function (LSF) as shown in Figure 5 (c). LSF is Fourier transformed and normalised to obtain the MTF as shown in Figure 5 (d). MTF is scaled in frequency axis to represent the calculated MTF in terms of Nyquist frequency (cycles/pixel), which corresponds to highest spatial frequency (or fine detail) that can be captured by sensor.
Figure 5 (c). Normalised LSF derived from zoomed edge profile
Figure 5 (d). Estimated MTF vs Spatial frequency
Channel Observed MTF
MTF Specification
TIR-1 0.24 0.26
TIR-2 0.2 0.26
MIR 0.24 0.3
VIS 0.25 0.31
SWIR 0.3 0.3
Table-3. Comparison of In-orbit MTF and Specification
Values of MTF (in fast scan direction) estimated for various channels of Imager are shown in Table-3. It can be seen that SWIR has a high MTF of 0.3 (30%) indicating high contrast, in thermal channels, TIR-1 has highest MTF of 0.24 (24%). The specifications of system MTF (measured in Lab) are also provided in table. These values are found to have good match, with variation ~0.06 with respect to some channels.
3.3 Striping Analysis
For computation of residual striping, uniform sea region near Gujarat - Figure 6 (a) is selected. A sub-image was extracted for analysis. As the image scanning occurs in fast scan (East-West or (East-West-East) and Slow scan (North-South) directions, striping effect due to detector non-uniformity is visible as horizontal bands in alternate scan-lines.
For TIR-1 channel, difference of scan-means between successive lines for sub-image is plotted in Figure 6 (b). Two successive lines are considered for computation of differences corresponding to a single pair of detectors in TIR-1 channel.
Figure 6 (a). Homogeneous region (TIR-1) considered for residual striping analysis
If there is no striping effect, scan difference is expected to be zero in homogeneous regions. From Figure 6(b), it is seen that mean scan-difference is zero at some places, difference of upto
Figure 6 (b). Plot of successive count difference
two counts between successive lines is observed. Further, a histogram of scan-line wise differences for sub-image was generated. Most frequently occurring difference (statistical mode) or residual striping was found to be one count. Visual verification showed that one count difference did not give rise to striping artefact at different regions of image. Similar analysis on other channels showed minimal residual striping.
4. TARGET BASED RADIOMETRIC ANALYSIS
For target based radiometric analysis, two uniform targets of size ~1600 sq.km are identified in Yemen (16.97°N, 47.36°E) and Persian Gulf (26.12°N, 55.5°E) region as shown in Figure 7.
INSAT 3D Spacecraft is given a 180 deg rotation on its Yaw axis in March and September every year, so as to keep the IR detector-patch temperatures within operable limits, called as Yaw flip. To monitor the diurnal quality trend and radiometric performance pre and post yaw flip, two hourly images for 1st March 2014 (before yaw flip) and 14th July 2014 (after yaw flip) are considered.
Figure 7. Uniform Targets identified in Yemen & Persian Gulf
4.1. Diurnal trends in BT for IR channels
For the above mentioned targets, mean target radiance and brightness temperature (BT) is computed. Mean BT profile of targets is validated with independently computed BT references (as explained in Section 2) for same date/time. Table 4 shows the BT reference values for TIR-1 and TIR-2 channels at six hourly intervals for 14th July 2014 for Yemen (16.97°N, 47.36°E) and Persian Gulf (26.12°N, 55.5°E) region.
Time GMT
Yemen (Ref BT -K)
Persian Gulf (Ref BT - K) TIR-1 TIR-2 TIR-1 TIR-2 00:00 288.7 288.8 302.1 300 06:00 312.4 310.8 305.3 302.3 12:00 315.0 313.1 305.6 302.6 18:00 294.1 293.8 303.9 302.5 Table-4: BT References for TIR-1/2 channels of Imager (14/7/14)
Figure 8 (a) shows two-hourly profile of BT for both targets generated from TIR-1 channel. For BT profile corresponding to Yemen, the brightness temperature curve shows a peak at 10:00 (GMT) with value 319.77K and temperature gradient of 29.91K, with minimum temperature observed at 02:00 GMT. It is because land features get warmer during daytime and are colder during night. As sand absorbs heat quickly and also looses heat fast, a high temperature gradient is seen. However, for sea target, the overall diurnal variation in BT is found to be only 2.78K.
Figure 8 (a) Diurnal trends in observed BT for TIR-1
Figure 8 (b) Diurnal variation in BT references for TIR-1
Figure 8 (b) shows plot of BT references for identified targets. It is observed that average difference between reference and actually measured BT values for Persian Gulf corresponding to four times (00:00, 6:00, 12:00 and 18:00 GMT) is 4.87K. For Yemen, average difference in temperatures is found to be 0.77K. Both temperature profiles show similar trend with maximum and minimum occurring at nearly same times. For
TIR-2 channel, average difference between reference and actually measured values for Persian Gulf and Yemen is 3.82K and 0.56K respectively. A bias of <4K is seen on both sites for TIR-1 and TIR-2 channels, high accuracy of better than 1K is seen on Land region, indicating consistent radiometric calibration.
Comparison of BT before and after yaw flip was carried out for targets in TIR-1 band corresponding to 1/3/14 and 14/7/14 as shown in Figure 8 (c). BT trends were observed to be same, with peak BT value occurring at 10:00 hours GMT. This is indicative of consistent radiometric calibration pre and post yaw flip.
Figure 8 (c) BT comparison for Yemen target pre & post Yaw-flip (TIR-1)
4.1. Seasonal trends in BT
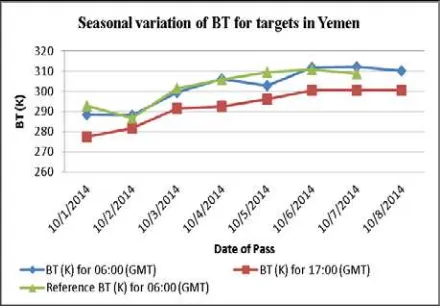
To study seasonal radiometric trends of targets, two images on 10th day for eight consecutive months (January-August 2014) are considered. Time corresponding to 6:00 GMT and 17:00 GMT is chosen, so that target statistics during day as well as night time can be captured. Observed target radiances are also compared with reference BT for same targets/dates available for 6:00 GMT.
Figure 9 (a) shows seasonal variation in BT over period from Jan-Aug for 06:00 GMT, 17:00 GMT and comparison with reference. It is observed that for Yemen target, BT values at 17:00 hours are lower than the BT values at 06:00 hours.
Figure 9(a). Seasonal variation of BT for Yemen target (TIR-1)
Peak in BT value is observed during month of June for both 06:00 and 17:00 hours with values 312K and 300.58K respectively. BT references for 06:00 (GMT) also show a peak during the month of June with value 310.72K. Average difference in BT values (observation & reference) is 0.96K.
To validate the product ancillary information, profile of sun-elevation angle observed at Yemen for two times in a day over a period of eight months is plotted (Figure 9 b). It can be seen that for 06:00 GMT, sun elevation angle increases from 20 to 60 degrees with change in season. For 17:00 GMT, change in sun-elevation angle from -40 to -20 degrees is observed.
Figure 9 (b). Seasonal variation of Sun elevation angle for targets in Yemen
5. SENSOR NOISE PERFORMANCE
Variation in noise over all acquisitions in a day is analysed for different targets. Noise statistics are compared with sensor specifications and studied before and after yaw flip to monitor sensor behaviour. Figure 10 shows noise performance for TIR-1 band. It is seen that throughout 24 hours, noise value (NEdT) is well within the sensor specification of 0.35K@300K
Figure 10. Diurnal Variation of NEdT for Persian Gulf (TIR1)
Figure 10 shows the diurnal variation in NEdT for Persian Gulf target (temperature ~290K) for TIR-1 channel for 2 dates – 1st March 2014 (before yaw flip) and 14th July 2014 (after yaw flip). It can be seen that for both days, the NEdT value is found to be within specification of 0.35K@300K. Similar analysis
was done for TIR-2 channel, where NEdT value was found to be within specification of 0.35K@300K.
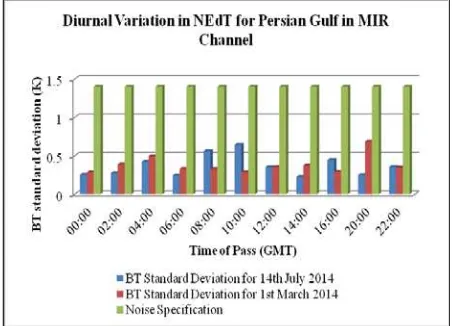
Figure 11 shows that NEdT values for MIR channel pre and post yaw flip are within specification of 1.4K.
Figure 11. Diurnal Variation of NEdT for MIR Pre & Post Yaw Flip
NEdT analysis for water-vapour channel (Table-5) showed noise values to be within specification of 1K@230K.
Time (GMT)
NEdT (K) for WV
Pre-Yaw Yaw-Flip
Post Yaw-flip
00:00 0.48 0.49
04:00 0.84 0.195
06:00 0.30 0.23
08:00 0.18 0.24
10:00 0.43 0.09
12:00 0.17 0.36
14:00 0.81 0.61
16:00 0.40 0.47
20:00 0.16 0.30
22:00 0.12 0.16
Table 5. NEdT Analysis for WV Channel
6. CONCLUSION AND FUTURE WORK
Radiometric quality evaluation approach adopted for assessment of Level-1 products generated from INSAT-3D Imager data is presented. Various quality parameters to quantify visual quality of scene and methodology for estimation from data is described. Target-based approach for evaluation of radiometric accuracy and noise performance of sensor is described. Radiometric analysis is performed on data sets over duration of six months to study diurnal and seasonal trends in quality. Radiometric consistency in pre and post yaw flip condition of satellite is also validated. Analysis performed shows that INSAT 3D images have high contrast (MTF >0.2) and low striping effects. Sensor noise performance is well within specifications for all channels during day and night
times. A bias of <4K is observed in brightness temperature values estimated from data and independently estimated radiometric references. Regular quality evaluation by above described techniques is therefore essential to monitor data quality to ensure highly accurate products for use in climate related studies.
ACKNOWLEDGEMENTS
Authors are grateful to Shri. A. S Kiran Kumar, Director, Space Applications Centre (SAC), Ahmedabad, for taking continued interest in DQE activity. Authors thank Shri. Santanu Chowdhury, Deputy Director SIPA/SAC for providing motivation and guidance to carry out this work. Special thanks are due to Dr. Randhir Singh EPSA/SAC for useful discussions and extensive support for providing model based radiometric references. Support received from all members of Image Analysis and Quality Evaluation Division (IAQD) is gratefully acknowledged.
REFERENCES
1. Charles Elachi, Jakob Van Zyl, 2006. Introduction to the Physics and Techniques of Remote Sensing. 2nd ed., Jin Au Kong, John Wiley & Sons.
2. George Joseph, 2005. Fundamentals of Remote Sensing, Universities Press.
3. Mattia Crespi, Laura De Vindictis, 2009. “A procedure for High Resolution Satellite Imagery Quality Assessment”, Sensors-2009, 9, 3289-3313
4. Rafael C. Gonzalez, Richard E. Woods, 2009. Digital Image Processing. Pearson Education Asia.
5. Singh R., P. Rayer, R. Saunders, S. Migliorini, R. Brugge, and A. O'Neill, 2009. “A fast radiative transfer model for the assimilation of water vapor radiances from the Kalpana very high resolution radiometer”, Geophysical Research Letters, VOL. 36, L08804, doi: 10.1029 /2009GL037852.