SEGMENTATION OF PLANAR SURFACES IN LIDAR POINT CLOUDS OF AN
ELECTRICAL SUBSTATION BY EXPLORING THE STRUCTURE OF POINTS
NEIGHBOURHOOD
Mostafa Arastounia, Derek D. Lichti
Department of Geomatics Engineering, University of Calgary, 2500 University Drive NW, Calgary, Canada, T2N 1N4 – (marastou, ddlichti)@ucalgary.ca
Commission V/WG V-3
KEY WORDS: Plane, Segmentation, LiDAR, Point Cloud Processing
ABSTRACT:
According to the Department of Energy of the USA, today’s electrical distribution system is 97.97% reliable. However, power outages and interruptions still impact many people. Many power outages are caused by animals coming into contact with the conductive elements of the electrical substations. This can be prevented by covering the conductive electrical objects with insulating materials. The design of these custom-built insulating covers requires a 3D as-built plan of the substation. This research aims to develop automated methods to create such a 3D as-built plan using terrestrial LiDAR data for which objects first need to be recognized in the LiDAR point clouds. This paper reports on the application of a new algorithm for the segmentation of planar surfaces found at electrical substations. The proposed approach is a region growing method that aggregates points based on their proximity to each other and their neighbourhood dispersion direction. PCA (principal components analysis) is also employed to segment planar surfaces in the electrical substation. In this research two different laser scanners, Leica HDS 6100 and Faro Focus3D, were utilized to scan an electrical substation in Airdrie, a city located in north of Calgary, Canada. In this research, three subsets incorporating one subset of Leica dataset with approximately 1.7 million points and two subsets of the Faro dataset with 587 and 79 thousand points were utilized. The performance of our proposed method is compared with the performance of PCA by performing check point analysis and investigation of computational speed. Both methods managed to detect a great proportion of planar points (about 70%). However, the proposed method slightly outperformed PCA. 95% of the points that were segmented by both methods as planar points did actually lie on a planar surface. This exhibits the high ability of both methods to identify planar points. The results also indicate that the computational speed of our method is superior to that of PCA by 50%. It is concluded that our proposed method achieves better results with higher computational speed than PCA in the segmentation of planar surfaces.
1. INTRODUCTION
According to the Department of Energy of the USA, today’s
electrical distribution system is 97.97% reliable. However, power outages and interruptions still impact many people in their daily lives, work environment, etc. for a variety of reasons including unplanned and planned outages e.g. wires down due to storms or unexpected demand. Power outages cost the US Government $150 billion annually, which is $500 for each man, woman and child. In addition to the economic loss, power outages have a negative impact on the system reliability and the customer satisfaction which can lead to the negative publicity. Many power outages are caused by animals coming into contact with the conductive elements of electrical substations. That is, since electrical substations are constructed in open areas, animals can easily reach them and by touching them electricity
is conducted through their body which results in the animals’
death, power outages and huge maintenance costs. This can be prevented by covering the conductive electrical objects with insulating materials. The design of these custom-built insulating covers requires a 3D as-built plan of the substation. This research aims to develop automated methods to create such a 3D as-built plan using terrestrial LiDAR data for which electrical objects first need to be recognized in LiDAR point clouds. In this paper a new segmentation method is proposed to recognize planar surfaces in the electrical substations.
In this paper, related work is presented in the next section. The methodology is detailed in section three which is followed by section four that describes the specifications of utilized sensors and datasets in this research. The achieved results are presented and discussed in section five and finally section six addresses the conclusions and potential future work.
2. RELATED WORK
LiDAR data is a set of unstructured points so the segmentation is performed to organize the points by aggregating those with the similar properties. The main part of the segmentation is seeking the best set of parameters which describe the features of the objects of interest since the difference of the existing segmentation methods are mainly in their similarity measures (Martínez et al., 2012). Segmentation methods can be classified into two categories: spatial-domain methods e.g. region growing methods and parametric-domain methods e.g. the Hough transform (Hough, 1962).
Region growing methods usually comprise two parts; seed points selection and growing criteria. Alternative forms of region growing methods are compared and discussed by Hoover et al. (1996). Besl and Jain (1988) employ a region growing method that labels each point based on surface curvature which is defined based on the structure of each point’s neighbourhood. The International Archives of the Photogrammetry, Remote Sensing and Spatial Information Sciences, Volume XL-5, 2014
Points are labelled as belonging to a flat surface, ridge, peak, etc. Rabbani et al. (2006) investigate surface roughness to segment planar and curved surfaces. However, their methods are not useful for the point clouds of the electrical substations where there are mainly planar surfaces and not many curved surfaces. Tovari and Pfeifer (2005) present a region growing method that utilizes the similarity of normal vectors and the distance of a point to the best fit plane as the growing criteria. Some researchers employed PCA in their segmentation algorithms. Belton and Lichti (2006) segment boundary, edge and surface points by investigating the eigenvalues of points that are obtained by PCA. El-Halawany et al. (2012) also employ a region growing method to recognize poles in an urban environment by analysing eigenvectors and eigenvalues that are achieved by PCA. This can be beneficial to upcoming stages of our research when other objects, like rods and poles, are to be recognized. Al-Durgham and Habib (2013) segment the planar surfaces in which the quality of input LiDAR data is taken into consideration. Point density and accuracy are two measures of the data quality used for the segmentation. Considering the data quality in the segmentation algorithm is innovative since it is not usually incorporated in the existing segmentation methods. Datasets are usually heterogeneous with varying point density and accuracy as they are resulting from the integration of many smaller datasets with different point density and accuracy. This can be useful in this research since the datasets were collected by terrestrial laser scanners, so variations in point density are expected. Therefore, an investigation of the point density and its potential effects on the results can be pursued as a future work. Brodu and Lague (2012) inspect the 3D structure of points’ neighbourhood to segment the point clouds of complicated natural scenes. The points’neighbourhoodaredeterminedtobe distributed in 1D, 2D or 3D by investigating the local behaviour of point cloud at different scales. Although our proposed
method also inspects the structure of points’ neighbourhood,
objects in electrical substations are man-made, parameterized objects that are totally different from objects usually found in natural scenes. Many of region growing methods are highly dependent on seed point selection and an error in seed point selection can have a negative impact on the segmentation results (Besl and Jain, 1988).
Parametric-domain segmentation methods are composed of two steps: assigning an attribute to each point and then clustering labelled points that usually takes advantage of an accumulator array. Many researchers segment planar surfaces using parametric-domain methods e.g. Lari et al. (2012), Filin and Pfeifer (2005), Vosselman and Dijkman (2001), Kim and Habib (2007) and Maas and Vosselman (1999) who segment planes in urban environments. Roggero (2002) segments an urban environment by employing PCA in attribute space. The primary restriction of the parametric-domain methods is that they are computationally intense and thus not pertinent for very large datasets like datasets used in this research.
Some researchers have concentrated on different aspects of the planar surface segmentation like the size and properties of
points’neighbourhoodwhichare also taken into consideration in this paper. In fact, planar surfaces are segmented by
investigationofpoints’neighbourhoodstructurethatcan have a great impact on the segmentation results. Bae et al. (2005) propose an approach to determine an optimal neighbourhood size for points by minimizing the variance of the estimated normal vector. Some researchers propose new neighbourhood definitions to improve their segmentation algorithms. Filin and Pfeifer (2005) investigate the shortcomings of existing
neighbourhood definitions e.g. TIN, rasterization and spherical neighbourhood. Then they propose adaptive cylinder neighbourhood that considers both the 3D relationships between points and the physical shape of the surfaces. Kim and Habib (2007) utilize cylinder neighbourhood concept for the segmentation of planar patches using parametric-domain methods successfully. Filin and Pfeifer (2006), Lari et al. (2012) and Lari and Habib (2013) improve their planar surface segmentation results by considering the noise level and the physical shape of the associated surface. However, all mentioned papers take advantage of the parametric-domain methods that are computationally not efficient.
3. METHODOLOGY
This section is composed of two parts; section 3.1 details the proposed method for the segmentation of planar surfaces in LiDAR point cloud of an electrical substation. Section 3.2 describes how PCA is employed to segment planar surfaces in the same electrical substation. Afterwards, the performance of our proposed segmentation method is compared with the performance of PCA in section 5.
3.1 Proposed segmentation method
The proposed approach is a region growing method that aggregates points based on their proximity to each other and their neighbourhood distribution direction. Many methods can be employed to determine the distribution direction of a point’s neighbourhood in which a dispersion matrix is usually defined and analysed. Our proposed method incorporates defining a new dispersion matrix which is further analysed to determine
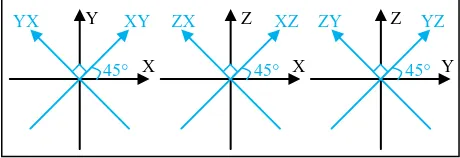
the distribution direction of each point’s neighbourhood. To create the proposed dispersion matrix, each point’s neighbourhood is projected in nine different directions in space. These directions incorporates the three cardinal directions X, Y and Z axes and two directions in each of the XY, XZ and YZ planes at 45° to the cardinal axes, portrayed in Figure 1.
(minimum value of projected points on axis X)
etc.
The data extents along these nine directions constitute elements of the proposed dispersion matrix, indicted above. The
Figure 1. Three Cartesian and six non-Cartesian axes on which points are projected
distribution in two orthogonal directions on the plane and almost no distribution in the plane’s normal direction. Since almost all planar surfaces in the electrical substations are vertical planes, one of the principal distribution directions would be the vertical direction. This corresponds to a large value for Range(z) in the dispersion matrix. In addition to the vertical direction, the neighbourhood of a point on a plane would have a large distribution in another direction that is orthogonal to the vertical direction and the plane’s normal direction. If for instance the neighbourhood of a point exhibits a large distribution in Z and X axes and almost no distribution along Y axis, this point is considered to lie on a plane. This corresponds to large values of Range (z) and Range (x) and very small magnitude of Range (y).
Once a point with planar neighbourhood is identified, it will be labelled accordingly. Later on, points with planar neighbourhood that are in a certain distance from each other are aggregated in a segment. It should be noted that the proposed segmentation algorithm has successfully been employed to decompose complex structures in an electrical substation into simpler homogeneous objects and also to recognize insulators in the electrical substation (Arastounia and Lichti, 2013). Insulators can also be recognized by photogrammetric methods (Armeshi and Habib, 2013).
3.2 Principal component analysis
PCA is one of the most common methods used in the segmentation of LiDAR point clouds. In PCA, the eigenvectors and the eigenvalues of the covariance matrix of each point’s neighbourhood are used to segment planar surfaces.
point are used to create the covariance matrix. The eigenvalues of the covariance matrix is then computed and if two of the normalized eigenvalues have almost same magnitude and the third normalized eigenvalue is almost zero, the point under study is considered to have a planar neighbourhood. The normalized eigenvalues are computed as:
utilized to detect points with planar neighbourhood using PCA:0
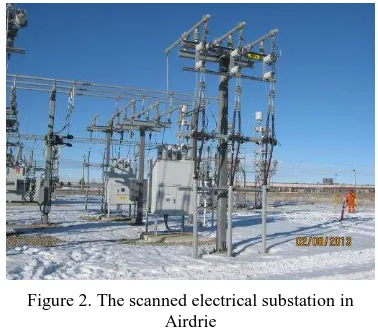
To collect data for this research, two different phase-based laser scanners, a Leica HDS 6100 and a Faro Focus3D,were utilized to scan an electrical substation (pictured in Figure 2) in Airdrie, a city located in north of Calgary, Canada. Both levelled instruments scanned the electrical substation from seven different locations to cover a portion of interest of the substation.
The seven point clouds obtained by the Leica scanner were registered with a point-based registration technique resulting in a point cloud with more than 510 million points. The Leica scanner collected data with point spacing of 3.1 x 3.1 mm2 at the distance of 10 m and 5.8 x 5.8 mm2 at the distance of 25 m. The seven point clouds collected by the Faro scanner were registered with the ICP (iterative closest
point) method, resulting in a point cloud with more than 75 million points. The average point density of the Faro scanner dataset is 719 points in a spherical neighbourhood with a radius of 15 cm. Furthermore, the data collected by the Faro scanner was down sampled to have a total number of about 80 thousand points with average point density of 87 points in a spherical neighbourhood with a radius points of two datasets, one subset of the Leica dataset and two subsets of the Faro dataset were utilized. The subset of the Leica dataset is portrayed in Figure 5 and the original and down-sampled versions of the Faro dataset are depicted in Figure 6 and Figure 7 respectively. The Leica subset is
colour-Figure 2. The scanned electrical substation in Airdrie
Figure 3. Leica HDS 6100 laser
scanner The International Archives of the Photogrammetry, Remote Sensing and Spatial Information Sciences, Volume XL-5, 2014
coded according to intensity and both Faro subsets are colour-coded according to points’ height. Table 1 summarizes the properties of the subsets considered for this research. Both subsets of the Faro dataset portray the same part of the substation while the subset of the Leica dataset exhibits another part of the electrical substation. However, all three subsets incorporate many typical electrical objects existing on such electrical substations e.g. the fence enclosing the substation, circuit breakers, insulators, cables, etc.
Figure 5. The subset used in this research scanned by the Leica scanner
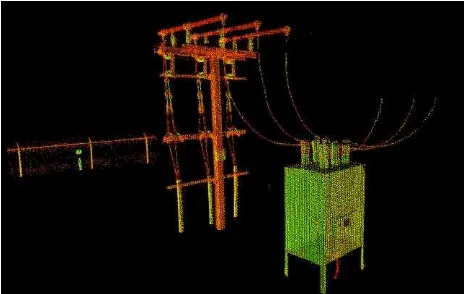
Figure 6. The subset scanned by the Faro scanner (with original point density)
Figure 7. The down-sampled subset scanned by the Faro scanner
Table 1. Properties of datasets Dataset/ foreground and are composed of four planar surfaces with some bushings on top. The fence can be seen in the background. The fence and the circuit breakers are the main planar objects in the three considered subsets. Although the fence is not an electrical object, it is one of the key components of the substation since it represents the extents of the substation. Recognition of the extents of the substation allows all points outside of the substation to be simply disregarded.
5. RESULTS AND DISCUSSION
In this section, the results of the planar surface segmentation are presented. A quantitative check point analysis was carried out to thoroughly assess the performance of the applied methods. This was performed by manually cropping points on planar surfaces and saving them as ground truth data.
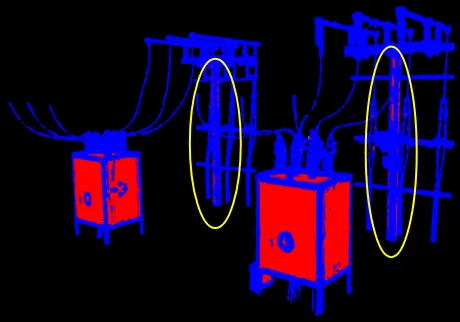
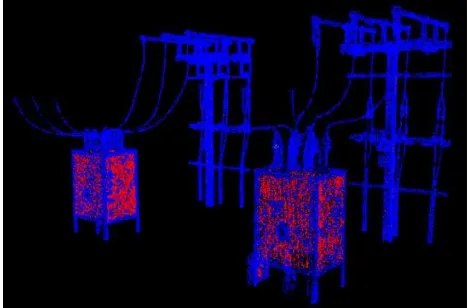
The results of the planar surfaces segmentation are displayed in figures in which the planar points are displayed in red and the rest of points are blue. Then results of the check point analysis are presented for each method on the different datasets in two matrices: the first is the confusion matrix and the second matrix summarizes the precision, recall and accuracy of the segmentation. Table 2 shows elements of the confusion matrix in terms of true positive, true negative, false positive, false negative and type I and II errors. It should be noted that type I error and type II error correspond to commission error and omission error respectively.
Table 2. Elements of the confusion matrix
Confusion matrix
The second matrix indicates precision, recall and accuracy that are computed as follows:
Precision corresponds to exactness and quality. In the context of this paper, it indicates the ability of the segmentation methods to identify points on planar surfaces. Recall, sometimes called sensitivity, is about quantity. Recall demonstrates the ability of the segmentation methods to incorporate as many planar points as possible. Finally accuracy is a weighted arithmetic mean of Figure 4. Faro
Focus3D laser scanner
recall and inverse recall. Inverse recall corresponds to recall of the inverse problem that is the segmentation of non-planar points.
5.1 Results of the Leica subset
The results of planar surface segmentation of the Leica subset employing PCA and the proposed method are depicted in Figure 8 and Figure 9, respectively. As evident in these figures, the proposed method and PCA managed to segment a great proportion of points on planar surfaces i.e. the fence and the circuit breaker. However, the PCA method’s results (Figure 8) exhibit a larger number of type II errors than those of the proposed method. This implies that our proposed method managed to detect and segment larger number of points on planar surfaces than PCA. This suggests a higher rate of recall for our segmentation method compared to PCA. As the yellow ovals indicate, the type I errors in the results of both methods are very small. This implies almost the same rate of precision for both methods. Furthermore, there is a bump on one side of the circuit breaker, depicted by yellow arrows in the following two figures, which, correctly, is not segmented as a planar surface. This bump is actually a small door on a circuit breaker that provides access to the equipment inside of the circuit breaker.
The results of the check point analysis achieved by the proposed method and PCA using the Leica subset are presented in Table 3 and Table 4.
Table 3. Confusion matrix obtained by the proposed method
Confusion matrix
Segmented points
Planar points Non-planar points
Ground truth data
Planar points 462 933 175 554 Non-planar
points 9 208 1 033 259
Table 4. Confusion matrix achieved by PCA
Confusion matrix
Segmented points
Planar points Non-planar points
Ground truth data
Planar points 427 365 211 122 Non-planar
points 6 329 1 036 138
The precision, recall and accuracy, in percentage, of results obtained by the proposed method and PCA are shown in Table 5. The precision of both methods is very high and indicates that 98% of the segmented points actually lie on planar surfaces. This is in accordance with what can be inferred from Figure 8 and Figure 9 which demonstrate a small number of type I errors in the results of both methods. The recall of our method is slightly higher than the recall of PCA, which can also be deduced from the figures. The proposed method managed to identify a larger number of points on planar surfaces than PCA. Finally since the accuracy is the arithmetic mean of recall and inverse recall and the recall of our method is higher than that of PCA, our method is expected to have higher accuracy compared to PCA, which is in accordance with the achieved numbers for accuracy.
Table 5. Results of check point analysis using Leica subset Method/ Statistical
measures Precision Recall Accuracy
Proposed method 98 73 89
PCA 98 67 87
5.2 Results of the Faro subset
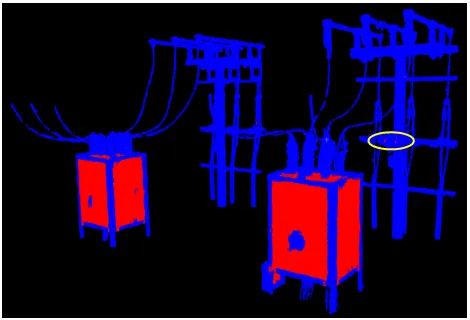
Figure 10 and Figure 11 indicate the results of segmentation of planar surfaces on circuit breakers obtained by the proposed method and PCA respectively. The Results of segmentation on fence achieved by the proposed method and PCA are depicted in Figure 12 and Figure 13.
Figure 10. The segmentation results on circuit breakers obtained by the proposed method using Faro subset
Figure 8. Segmentation results of PCA using Leica subset
Figure 9. Segmentation results of the proposed method using Leica subset
Figure 11. The segmentation results on circuit breakers achieved by PCA using Faro subset
Figure 12. The results of the proposed method on fence
Figure 13. The results of PCA on fence
The segmentation results of the Faro dataset are completely consistent with the results of the Leica subset. The proposed method recognized a larger number of points on the planar surfaces on the circuit breakers and the fence (red points) than PCA. This corresponds to higher recall of the proposed method compared to PCA. Furthermore, PCA ended up with slightly bigger type I error. The yellow ovals in Figure 10 and Figure 11 indicate points on some metallic rods and poles that are incorrectly segmented as planar points (type I error). The incorrect segmentation occurred mainly where two objects are connected. For instance, at the intersection of two metallic rods there are one principal distribution direction along each of the rods and almost no distribution along the orthogonal direction to the rods. Points with this type of distribution in their neighbourhood can be incorrectly segmented as planar points.
The confusion matrices of the results of both methods using the Faro subset are presented in Table 6 and Table 7. The results of check point analysis are shown in Table 8 in percentage.
Table 6. Confusion matrix of the proposedmethod’sresults
Confusion matrix
Segmented points
Planar points Non-planar points
Ground truth data
Planar points 166 681 54 804 Non-planar
points 8 415 348 507
Table 7. Confusion matrix of PCA's results
Confusion matrix
Segmented points
Planar points Non-planar points
Ground truth data
Planar points 148 391 74 312 Non-planar
points 7 197 349 954
Table 8. Check point analysis results using Faro subset Method/ Statistical
measures Precision Recall Accuracy
Proposed method 95 75 89
PCA 95 67 86
Both methods achieved a precision of 95%, which indicates that only 5% of the segmented points were incorrectly segmented as points on planar surfaces. The recall and accuracy of both methods using the Faro subset are very close to those obtained for the Leica subset. As for the Leica subset, the recall and accuracy of the proposed method is slightly better than those obtained with PCA.
5.3 Results of the down-sampled Faro subset
Figures 14-17 show the results of planar surface segmentation in the electrical substation achieved by the proposed method and PCA using the down-sampled Faro subset. The results obtained are in accordance with results achieved for the Leica and the original Faro subsets. However, the proposed method recognized a greater proportion of the planar points than PCA for this down-sampled dataset. This is evident in the confusion matrices. The proposed method recognized about 20 000 points of the total number of 30 000 points on planes while PCA recognized only 9 000 of the total 30 000 points on planar surfaces. This implies that type II error (commission error) of PCA is much bigger than that of the proposed method. Since there are not many incorrectly segmented points, type I errors (omission error) of both methods are very small. Moreover, the small bumps on two circuit breakers are correctly not segmented as planar surfaces by two methods.
Figure 14. Results of the proposed segmentation method on circuit breakers using down-sampled Faro subset The International Archives of the Photogrammetry, Remote Sensing and Spatial Information Sciences, Volume XL-5, 2014
Figure 15. Results of segmentation on circuit breakers obtained by PCA using down-sampled Faro subset
Figure 16. Segmentation results on fence achieved by the proposed method
Figure 17. Segmentation results on fence obtained by PCA
Tables 9-11 show results of the check point analysis. Achieving high precision using the down-sampled Faro subset demonstrates the ability of both methods to detect planes in a low density point cloud. However, the recall of the proposed method is much higher than the recall of PCA for this dataset. This is not the case for the Leica and the original Faro subsets. The results obtained for recall implies that if the point density
ofadatasetisdecreasedsignificantly,bothmethods’abilityto
segment points on planar surfaces will decrease meaning that they will identify fewer points on planar surfaces. Though point density does slightly affect the proposed method, its impact on the PCA’s performance is considerable. The achieved values for accuracy are also consistent with values achieved for other two subsets i.e. the accuracy of the proposed method is slightly higher than the accuracy of PCA.
Table 9. Confusion matrix of results of the proposed method
Confusion matrix
Segmented points
Planar points Non-planar points
Ground truth data
Planar points 19 485 10 395 Non-planar
points 339 49 033
Table 10. Confusion matrix of results of PCA
Confusion matrix
Segmented points
Planar points Non-planar points
Ground truth data
Planar points 9 193 20 687 Non-planar
points 159 49 251
Table 11. Results of check point analysis using down-sampled Faro subset
Method/ Statistical
measures Precision Recall Accuracy
Proposed method 98 65 87
PCA 98 31 74
5.4 Computational performance
To compare the computational performance of two methods, the computational time to construct the proposed dispersion matrix (used in the proposed method) and the covariance matrix (used in PCA) of all points of the original Leica dataset with more than 510 million points was measured. Constructing the proposed dispersion matrix took 50% less time than that the construction of the covariance matrix, which makes our method computationally more efficient than PCA. This is expected as in our method only zero-order moments are calculated while in PCA the first- and second-order moments are computed.
Table 12. Computational speed of two methods
Method Computational time
Proposed method 29 hours and 45 minutes
PCA 61 hours and 44 minutes
6. CONCLUSIONS AND FUTURE WORK
In this research, a new method is proposed to segment points on planar surfaces in an electrical substation. The performance of the proposed method was compared to PCA, which is one of the most common methods for the segmentation of LiDAR point clouds. To perform the comparison, both the proposed method and PCA were applied to three datasets collected by two terrestrial laser scanners.
The proposed method obtained same precision as PCA. This implies that both methods have almost same performance to identify points on planar surfaces. Since the precision of both methods for all three subsets was 95% or higher, both methods are deemed to have high performance in identification of planar points which corresponds to very small commission error. The proposed method outperformed PCA in terms of recall. It segmented more planar points than PCA using Leica and original Faro datasets. This suggests that the omission error of PCA is larger than the omission error of the proposed method. When the point density of the Faro subset was decreased significantly, PCA demonstrated very poor performance in terms of recall meaning that PCA identified a very small proportion (31%) of points on planar surfaces. Finally the proposed method outperformed PCA in terms of accuracy too which is anticipated, considering the definition of accuracy mentioned in section 5. Therefore, it can be concluded that the proposed method exhibits better performance than PCA by having smaller commission and omission errors compared to PCA. Furthermore, the computational speed of our method is superior to that of PCA by 50%.
This research can be pursued in two main aspects. First, variations in the point density need to be considered. Since terrestrial laser scanners are employed to collect data for this research, high point density variations are expected that needs to be modelled in the proposed dispersion matrix. Second since the ultimate goal of this research is to create a 3D as-built plan of the electrical substation, other objects in the electrical substation, like cables, metallic poles, are to be recognized.
ACKNOWLEDGEMENTS
Authors are highly indebted to Tecterra for its financial support. Cantega Technologies is thanked for their support and arranging access to the electrical substation in Airdrie, Canada.
REFERENCES
Al-Durgham, M., Habib, A., 2013. A framework for registration and segmentation of heterogeneous lidar data. Photogrammetric Engineering and Remote Sensing, 79, pp. 135-145.
Arastounia, M., Lichti, D.D., 2013. Automatic extraction of insulators from 3D LiDAR data of an electrical substation. In: ISPRS Annals of the Photogrammetry, Remote Sensing and Spatial Information Sciences, Vol. II-5/W2, pp. 19-24.
Armeshi, H., Habib, A., 2013. Automated extraction of ceramic insulators from imagery of electrical substations. In: The International Symposium on Mobile Mapping Technology, Tainan City, Taiwan.
Bae, K.H., Belton, D., Lichti, D.D., 2005. A framework for position uncertainty of unorganised three-dimensional point clouds from near-monostatic laser scanners using covariance analysis. In: The Internatioanl Archives of the Photogrammetry, Remote Sensing and Spatial Information Sciences, Vol. XXXVI-3/W19, pp. 7-12.
Belton, D., Lichti, D.D., 2006. Classification and segmentation of terrestrial laserscanner point clouds using local variance information. In: The Internatioanl Archives of the Photogrammetry, Remote Sensing and Spatial Information Sciences, Vol. XXXVI, Part 5, pp. 1-6.
Besl, P.J., Jain, R.C., 1988. Segmentation through variable-order surface fitting. IEEE Transactions on Pattern Analysis and Machine Intelligence, 10, pp. 167-192.
Brodu, N., Lague, D., 2012. 3D terrestrial lidar data classification of complex natural scenes using a multi-scale dimensionality criterion: Applications in geomorphology. ISPRS Journal of Photogrammetry and Remote Sensing, 68, pp. 121-134.
El-Halawany, S., Moussa, A., Lichti, D.D., El-Sheimy, N., 2012. Detectin of road curb from mobile terrestrial laser scanner point cloud. In: The Internatioanl Archives of the Photogrammetry, Remote Sensing and Spatial Information Sciences, Vol. XXXVIII-5/W12, pp. 109-114.
Filin, S., Pfeifer, N., 2005. Neighborhood systems for airborne laser data. Photogrammetric Engineering and Remote Sensing, 71, pp. 743-755.
Filin, S., Pfeifer, N., 2006. Segmentation of airborne laser scanning data using a slope adaptive neighborhood. ISPRS Journal of Photogrammetry and Remote Sensing, 60, pp. 71-80.
Hoover, A., Jean-Baptiste, G., Jiang, X., Flynn, P.J., Bunke, H., Goldgof, D.B., Bowyer, K., Eggert, D.W., Fitzgibbon, A., Fisher, R.B., 1996. An Experimental Comparison of Range Image Segmentation Algorithms. IEEE Transactions on Pattern Analysis and Machine Intelligence, 18, pp. 673-689.
Hough, P.V.C., 1962. Method and means for recognizing complex patterns, US Patent 3069654.
Kim, C., Habib, A., 2007. New approach for planar patch segmentation using airborne laser data. In: ASPRS Annual Conference "Identifying Geospatial Solutions", Tampa, USA.
Lari, Z., Habib, A., 2013. A new approach for estimating the local point density and its impact on lidar data segmentation. Journal of Photogrammetric Engineering and Remore Sensing 79, pp. 195-207.
Lari, Z., Habib, A., Kwak, E., 2012. An adaptive approach for segmentation of 3D laser point cloud. In: The Internatioanl Archives of the Photogrammetry, Remote Sensing and Spatial Information Sciences, Vol. 38-5/(W12), pp. 103-108.
Maas, H.-G., Vosselman, G., 1999. Two algorithms for extracting building models from raw laser altimetry data. ISPRS Journal of Photogrammetry and Remote Sensing, 54, pp. 153-163.
Martínez, J., Soria-Medina, A., Arias, P., Buffara-Antunes, A.F., 2012. Automatic processing of Terrestrial Laser Scanning data of building façades. Automation in Construction, 22, pp. 298-305.
Rabbani, T., van den Heuvel, F.A., Vosselmann, G., 2006. Segmentation of point clouds using smoothness constraint. In: The Internatioanl Archives of the Photogrammetry, Remote Sensing and Spatial Information Sciences, Vol. XXXVI, Part 5, pp. 1-6.
Roggero, M., 2002. Object segmentation with region growing and principal component analysis. In: The Internatioanl Archives of the Photogrammetry, Remote Sensing and Spatial Information Sciences, Vol. XXXIV, Part 3 A+B, pp. 289-294.
Tovari, D., Pfeifer, N., 2005. Segmentation based robust interpolation - a new approach to laser data filtering In: The International Archives of the Photogrammetry, Remote Sensing and Spatial Information Sciences, Vol. 36(3/W19), pp. 79-84.
Vosselman, G., Dijkman, S., 2001. 3D building model reconstruction from point clouds and ground plans In: The International Archives of the Photogrammetry, Remote Sensing and Spatial Information Sciences, Vol. 34-3/W4, pp. 37-44. The International Archives of the Photogrammetry, Remote Sensing and Spatial Information Sciences, Volume XL-5, 2014