Uptake of glucose and cholesterol by the ovary of
sheep and cattle and the influence of arterial LH
concentrations
A.R. Rabiee
a,∗, I.J. Lean
baDepartment of Veterinary Science, University of Melbourne, Werribee, Vic. 3030, Australia bBovine Research Australasia, PO Box 660, Camden, NSW 2570, Australia
Received 4 April 2000; received in revised form 5 September 2000; accepted 5 September 2000
Abstract
Time series analysis methods were used to evaluate the relationships between the uptake of glu-cose and cholesterol, and arterial luteinizing hormone (LH) concentrations. Classical arterio-venous difference methods were applied to study ovarian uptake of metabolites. Arterial and venous samples (n=20) were obtained from six cows and nine sheep every 10 min. There were highly significant positive cross-correlations of 0.5 for cattle and 0.8 for sheep between the uptake of glucose and cholesterol at lag 0. All individual cross-correlations were significant for sheep. Uptake of these metabolites was not significantly associated with arterial LH concentrations in the cows.
This study suggests that glucose may promote cholesterol uptake into the ovarian cells or vice versa. This study is the first to identify such a relationship. If these findings are repeated, the possibility exists that control of the oestrous cycle and fertility may be achieved by seeking a common regulator of uptake of these metabolites or by uncoupling the association between glucose and cholesterol. © 2000 Elsevier Science B.V. All rights reserved.
Keywords:Cholesterol; Glucose; Cattle ovary
1. Introduction
Improved knowledge of the metabolic demands of the ovary could lead to the development of new methods of controlling reproduction in animals. There are only a limited number of studies describing ovarian energy metabolism, and these studies were primarily conducted in vitro. The sources for energy used by the ovary are the subject of conflicting reports. It is
∗Corresponding author. Tel.:+61-397420484; fax:+61-397420400. E-mail address:[email protected] (A.R. Rabiee).
known that blood cholesterol concentrations and steroid hormones synthesis are positively related to energy intake and health of animals (Velhankar, 1973), and lower cholesterol and glucose concentrations after calving have been associated with an increased number of days from calving to conception (Kappel et al., 1984). The demands of reproductive tissue for energy and cholesterol, and the metabolism of these in reproductive tissues are important aspects of metabolism to understand.
It has been suggested that lipids are the main energy source used by the ovary (Flint and Denton, 1970), but more recent (Chase et al., 1992) and some older studies (Gafvels et al., 1987) suggest that glucose is a major energy source for the ovary. It was demon-strated that glucose uptake by the corpus luteum (CL) plays a role in its energy metabolism in vitro in rats (Gafvels et al., 1987). Studies (Chase et al., 1992) of glucose metabolism in the bovine CL in vitro also indicated that glucose was a major energy source used by the ovary, and that physiological state, stage of the oestrous cycle and time after calving significantly alters in vitro rates of uptake and metabolism of glucose by luteal tissue. The presence of glucose has been found to markedly stimulate the incorporation of car-bon from acetate into sterol and steroid in ovarian tissue in vitro in the rat (Flint and Denton, 1969). In vitro studies also show a positive relationship between ATP and preg-nenolone synthesis in ovarian mitochondria (Uzgiris et al., 1970; Robinson and Stevenson, 1971). We reported (Rabiee et al., 1997) that glucose was the primary source of energy and that free fatty acids were not a significant source of energy for the bovine ovary in situ.
There are few reports on the effects of gonadotrophins on aspects of the cellular metabolism other than those involved directly in the steroidogenesis. Armstrong and Greep (1962) re-ported that administration of luteinizing hormone (LH) increased uptake of glucose and production of lactic acid by the luteinized rat ovaries in vitro. Investigations regarding the site in the metabolic pathway stimulated by LH, and the effect of LH on incorpo-ration of cholesterol into steroids have often yielded varied or conflicting results. LH may influence progesterone synthesis through a pathway that does not involve terol as an intermediate or precursor (Savard et al., 1965). The influence of LH on choles-terol uptake and de novo synthesis of cholescholes-terol in luteal tissue remains controversial. Time series analysis methods allow an evaluation of relationships between the uptake of metabolites by the ovary and the role of LH in influencing the uptake of metabo-lites. The objective of this study was to examine relationships between the uptake of glucose and cholesterol and arterial concentrations of LH both in sheep and cattle in vivo.
2. Materials and methods
2.1. Experimental animals
Nine ewes were used in this study. Blood samples in ewes were taken when two ewes were in proestrus, two ewes were in oestrus, four ewes were in dioestrus and one ewe had no obvious luteal or follicular structure in either ovary. The method of vessel cannulation and the significance of the uptake of metabolites have been previously reported in ewes (Rabiee et al. 1997a,b). Six Holstein-Friesian cows, 5–7-year-old, from a group of normally cycling cattle were used in this experiment. All of the cattle were lactating. Live weights were in the range of 450–620 kg.
2.2. Adaptation to stanchion, diet and preoperative care
During the 2 weeks before housing, cows were accustomed to halters and handling. After this initial period, the animals were held in stanchions that allowed free movement up and down, but not backward or forward. Cows were milked twice daily at approximately 07.30 h and 16.30 h in their stalls. During this period, cows were monitored for successful adaptation to the environment and food by observing feed intakes and milk production.
The cows were fed to appetite three times a day at regular intervals. The ration contained lucerne hay (43%), barley (17%), whole cottonseed (10%), cottonseed meal (10%), biscuit (18%) and meat meal (2%). The ration was formulated to provide: 16% crude protein, 11.2 MJ of metabolic energy/kg (ME) and 17% crude fiber (CF). All cows were fed this diet from 10 days prior to surgery.
Before surgery, oestrus was synchronized in cows by insertion of a controlled internal drug release (CIDR) (EAZI-breed CIDR B; Riverina Artificial Breeders, Pty. Ltd. Sydney, NSW, Australia) for 10 days. The cows were injected with Prostianol (2 ml of Prosolvin; Intervet, Boxmeer, Holland) on the day CIDR devices were removed. Surgery on all cows was conducted during the luteal phase (7–8 days after oestrus).
2.3. Surgical procedures
One day before surgery, a polyvinyl catheter (3.0 mm o.d., 2.0 mm i.d.; Dural Plastics and Engineering, Sydney, NSW, Australia) was inserted into the jugular vein of each cow under local anaesthesia. Water and feed were restricted for 6 h before surgery. The ovaries were pal-pated per rectum for determination of the side of the CL, and cows were sedated with 15 mg of 2% xylazine (Rompun; Bayer Australia Limited, Sydney, NSW, Australia). Anaesthesia was induced with guaifenesin (Giafen®; Parnell Laboratories, Sydney, NSW, Australia) and thiopentone sodium (Pentothal®; Boehringer-Ingelheim, Sydney, NSW, Australia). Surgical anaesthesia was maintained by a closed system inhalation procedure using 2–4% Halothane (Baxter Health Care, Old Toongabbie, NSW, Australia) and oxygen (4–5 l/min).
2.3.1. Facial artery cannulation
2.3.2. Cannulation of the ovarian vein and placement of blood flow probe
The flank area was prepared surgically, and the reproductive tract was exposed via a vertical flank incision just anterior to the paralumbar fossa. To facilitate exteriorization of the reproductive tract, 10 ml of Clenbuterol (Planipart; Boehringer-Ingelheim) was injected intravenously. The tract was exteriorized, and the ovarian branch of utero-ovarian vein was identified. A branch of the ovarian vein near the hilus was dissected from the adventitia, and a small incision was made, allowing a polyvinyl catheter (1.0 mm i.d., 1.5 mm o.d.) to be introduced 4–5 cm into the vein. The cannula was sutured in situ with fine silk. The cannula was exteriorized through the original flank incision and placed in a pouch which was sutured to the side of the animal (Rabiee et al., 1997b). Catheters were flushed daily with sterile heparinized saline (500 IU/ml). Operations were conducted in the luteal phase, and luteal ovaries were cannulated. Blood samples were taken during the luteal phase, and if an ovulatory follicle was observed by ultrasound examination in the cannulated ovary, blood samples were also taken during follicular phase.
To measure the ovarian blood flow (OBF), a 2 cm section of the artery just above the uterine anastomosis was dissected free of the peritoneum, and a 4R transit-time (TT) ultra-sonic blood flow probe (Tranultra-sonic System Inc., Ithaca, NY) was placed around the ovarian artery. Antibiotics were administered (Roscocycline-10; A/S Rosco-Denmark, Denmark) at 24 h intervals for 3 days following surgery.
2.4. Blood flow measurements
The OBF was measured using an ultrasonic TT flowmeter (Transonic Inc.). A 4R-series probe was used for measurement of blood flow. Data were obtained from the blood flow meter continuously, and were averaged over 5 m intervals by a data logger (Tain Electronics; Melbourne, Vic., Australia).
After 2–3 days of surgery, blood samples were taken from the cows in which OBF was monitored continuously. Blood samples were taken during the luteal phase for all cows, and during the follicular phase for two cows that had regressed CL and ovulatory follicles in the cannulated ovaries. Arterial and venous blood samples (n=20) were taken from each cow every 10 min. Arterio-venous (A−V) differences in concentrations of metabolites and OBF were used to estimate the uptake of cholesterol and glucose. Ovarian uptake of metabolites per minute was calculated using the following formula:
Ovarian uptake per minute=(A−V difference)×OBF
2.5. Analyses of blood samples
2.5.1. Metabolites and arterial LH
All blood samples were collected in plastic tubes containing heparin, and immediately centrifuged at 1000×gfor 20 min. The plasma samples were stored at−20◦C. Samples
were analyzed for cholesterol, glucose and arterial LH.
et al. (1974) with an autoanalyzer (Cobas Mira, Roch Diagnostic Systems, Switzerland) using the Roch reagent (Roch Diagnostic systems, NJ, USA). The uptake of cholesterol and glucose in sheep and cows have been reported (Rabiee et al., 1997a,b).The radio im-munoassay for LH used in these studies was a double antibody assay based on the method of Scaramuzzi et al. (1970). The antiserum to LH was provided by Prof. D.R. Lindsay and Prof. G.B. Martin, Department of Animal Science and Production, University of Western Australia. The antiserum (UWA 3B) was raised in rabbits, and the cross-reactivity of this antiserum with NIH bLH B5 was 100%. The minimum binding of tracer in the absence of LH was 35%. Nonspecific binding was consistently below 5% of added tracer. Inter-assay and intra-assay coefficients of variation were 11.6 and 6.3%, respectively.
2.6. Statistical analysis
Time series methods of analysis (Chatfield, 1989; Shumway, 1988) were used to an-alyze the relationship between the uptake of glucose and cholesterol by the ovary and arterial LH. These statistical procedures were developed by Prof. Shumway, Dr. Pope and Dr. Weber (personal communication) in association with the authors. The mean, linear or quadratic trends of mean values for metabolites were removed to produce series for each cow that were approximately stationary using the time series analysis procedure of STATGRAPHICS (1989). Cross-covariances of detrended data for each cow were calcu-lated using BMDP (1992), and cross-correlations of each variable at different lags were calculated using cross-covariance and variance at lag 0 series, with the following formula:
Cross-correlation= √ R12(m)
R11(0)×R22(0)
whereR12 is the cross-covariance at lagm, andR11andR22the variances at lag 0 of the two series. The cross-covariances were calculated from the following function
R12(m, m+k)=Cov(R1m, R2m+k)
whereR12(m,m+k) is the cross-covariance at time (m) and time (m+k) for seriesR1and R2, respectively, for each cowR1mis the residual for seriesR1at time (m) after detrending
to produce an approximately stationary series, andR2m+kthe residual for seriesR2at time
(m+k) after detrending to produce an approximately stationary series.
The cross-correlation function is used to standardize the cross-covariance coefficients, which depend on the units in which the two series are measured (Chatfield, 1989). Each lag represents a difference of 10 min. Mean cross-correlations presented in Tables 1–5 and Figs. 1–2 represent the mean cross-correlations from the six cows and nine ewes for the two variables at each of the lags examined.
3. Results
Table 1
Cross-correlations between the uptake of glucose and cholesterol by the ovary in the luteal phase for six cows
Cow Lag
−4 −3 −2 −1 0 1 2 3 4
C1 0.029 −0.16 −0.01 −0.21 0.92∗∗∗ −0.05 0.02 −0.15 0.09
C2 0.19 0.12 −0.08 0.05 0.24 0.06 0.16 −0.0004 0.07
C3 0.18 −0.06 −0.15 0.30 0.27 −0.03 −0.06 −0.03 0.21
C4 −0.13 −0.14 0.06 0.25 0.73∗∗ 0.11 0.23 0.02 −0.10
C5 0.06 −0.06 −0.03 0.21 0.44∗ −0.05 0.22 0.04 0.02
C6 0.017 −0.03 −0.2 −0.001 0.37 −0.08 −0.10 −0.06 0.10 Mean 0.06 −0.06 −0.07 0.10 0.50∗∗∗ −0.006 0.08 −0.03 0.07
∗P <0.05;∗∗P <0.01;∗∗∗P <0.001.
Table 2
Cross-correlations between the uptake of glucose and cholesterol by the ovary in the follicular phase for two cows
Cow Lag
−4 −3 −2 −1 0 1 2 3 4
C1 −0.11 −0.14 0.12 0.08 0.81∗∗∗ −0.31 −0.23 −0.19 −0.02 C2 −0.18 0.19 0.04 −0.10 0.94∗∗∗ −0.10 −0.006 0.14 −0.21 Mean −0.14 0.03 0.08 −0.01 0.87∗∗∗ −0.20 −0.12 −0.03 −0.11
∗∗∗P <0.001.
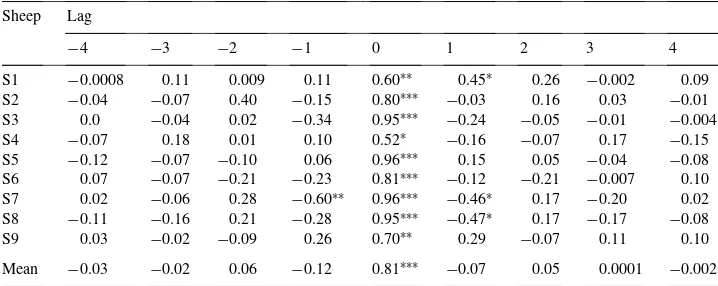
Table 3
Cross-correlations between the uptake of glucose and cholesterol uptakes by the ovary at different stages of the estrus cycle for nine ewesa
Sheep Lag
−4 −3 −2 −1 0 1 2 3 4
S1 −0.0008 0.11 0.009 0.11 0.60∗∗ 0.45∗ 0.26 −0.002 0.09 S2 −0.04 −0.07 0.40 −0.15 0.80∗∗∗ −0.03 0.16 0.03 −0.01 S3 0.0 −0.04 0.02 −0.34 0.95∗∗∗ −0.24 −0.05 −0.01 −0.004 S4 −0.07 0.18 0.01 0.10 0.52∗ −0.16 −0.07 0.17 −0.15 S5 −0.12 −0.07 −0.10 0.06 0.96∗∗∗ 0.15 0.05 −0.04 −0.08 S6 0.07 −0.07 −0.21 −0.23 0.81∗∗∗ −0.12 −0.21 −0.007 0.10 S7 0.02 −0.06 0.28 −0.60∗∗ 0.96∗∗∗ −0.46∗ 0.17 −0.20 0.02 S8 −0.11 −0.16 0.21 −0.28 0.95∗∗∗ −0.47∗ 0.17 −0.17 −0.08
S9 0.03 −0.02 −0.09 0.26 0.70∗∗ 0.29 −0.07 0.11 0.10
Mean −0.03 −0.02 0.06 −0.12 0.81∗∗∗ −0.07 0.05 0.0001 −0.002
aS1 and S2 were in proestrus, S3 and S4 in oestrus, S5–S8 in diestrus, and S9 had no luteal or follicular
structure.
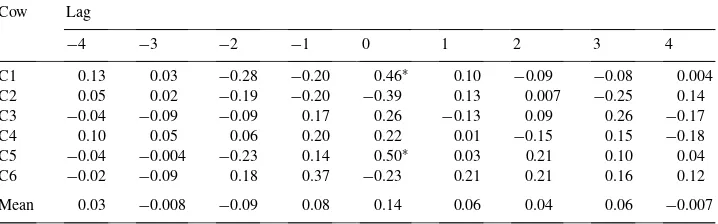
Table 4
Cross-correlations between transovarian uptake of glucose and arterial LH in the luteal phase for six cows
Cow Lag
−4 −3 −2 −1 0 1 2 3 4
C1 0.13 0.03 −0.28 −0.20 0.46∗ 0.10 −0.09 −0.08 0.004
C2 0.05 0.02 −0.19 −0.20 −0.39 0.13 0.007 −0.25 0.14
C3 −0.04 −0.09 −0.09 0.17 0.26 −0.13 0.09 0.26 −0.17
C4 0.10 0.05 0.06 0.20 0.22 0.01 −0.15 0.15 −0.18
C5 −0.04 −0.004 −0.23 0.14 0.50∗ 0.03 0.21 0.10 0.04
C6 −0.02 −0.09 0.18 0.37 −0.23 0.21 0.21 0.16 0.12
Mean 0.03 −0.008 −0.09 0.08 0.14 0.06 0.04 0.06 −0.007
∗P <0.05.
Table 5
Cross-correlations between transovarian uptake of cholesterol and arterial LH in the luteal phase for six cows
Cow Lag
−4 −3 −2 −1 0 1 2 3 4
C1 0.09 −0.009 −0.20 0.02 0.38 0.007 −0.04 −0.09 −0.05 C2 0.001 0.05 −0.21 −0.02 −0.33 −0.21 −0.14 −0.07 −0.04
C3 0.02 −0.19 0.15 0.19 0.02 −0.07 0.12 0.0 0.02
C4 0.0 0.22 0.21 0.36 −0.12 −0.17 0.09 −0.34 0.10
C5 0.02 0.03 −0.29 −0.10 0.58∗∗ 0.29 0.10 0.03 −0.01
C6 −0.11 −0.17 −0.09 0.02 0.04 0.03 0.14 0.11 0.16
Mean 0.005 −0.01 −0.07 0.08 0.09 −0.02 0.04 −0.06 0.03 ∗∗P <0.01.
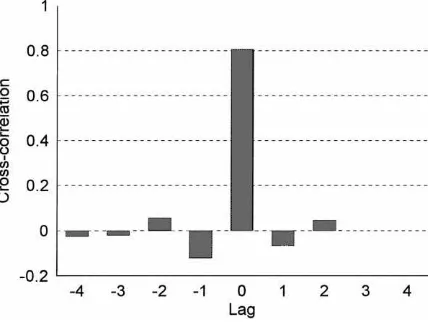
Fig. 2. Mean cross-correlation between the uptake of glucose and cholesterol at different stages of the estrus cycle for all ewes.
Correlations between the uptake of metabolites were examined for individual cows and sheep. Cross-correlations between glucose and cholesterol uptakes by the ovary and arterial LH in individual ewes and cows at different stages of the oestrous cycle are given in Ta-bles 1–3. Mean cross-correlations (MCC) between cholesterol and glucose uptakes by the ovary were significant at lag 0 in cattle in the luteal and follicular phases (MCC=0.5 and 0.87,P <0.01 and 0.001, respectively; Fig. 1), and in sheep (MCC=0.81,P <0.001; Fig. 2). Although, three cows did not have significant cross-correlations between the uptake glucose and cholesterol, these correlations were consistently significant for all sheep. There was some evidence of negative feedback in sheep, as significant negative cross-correlations between glucose and cholesterol at lags−1 and+1 were observed.
Table 4 shows cross-correlations between glucose and arterial LH for all cows. There was no significant difference between mean cross-correlations for glucose uptake and arterial LH at lag 0 (MCC = 0.14,P = 0.13), but cross-correlations were significant for two cows at lag 0. Cross-correlations between cholesterol uptake and arterial LH are presented in Table 5. Mean cross-correlations between cholesterol uptake and arterial LH were not significant (MCC=0.096,P >0.2), but were significant in one cow only at lag 0. There was no similar data available for the sheep to assess these relationships.
4. Discussion
reported earlier (Rabiee et al., 1997a,b). In brief, we found that there was significant uptake of glucose and significant output of lactate by the ovary. There was no significant uptake of free fatty acids. In the current study, we report correlations between the uptake of glucose and cholesterol during the sampling period.
Significant cross-correlations between glucose and cholesterol in cattle and sheep at lag 0 show that the uptake of cholesterol and glucose are strongly linked (Figs. 1 and 2). There was remarkable consistency in the results in all sheep, and good consistency in the results from cattle. Other in vitro studies suggest that glucose uptake may be a necessary condition for cholesterol uptake by the ovary. Glucose uptake by the rat CL plays an important role in ovarian energy metabolism (Gafvels et al., 1987). Studies of glucose metabolism in the bovine CL indicated that the uptake and rate of metabolism of glucose were higher in tissue obtained from growing CLs (Chase et al., 1992). This suggests that the requirements for steroid hormone precursors depend on the simultaneous availability of glucose. Glucose inclusion also stimulated, markedly, the incorporation of carbon from acetate into sterol and steroids in the rat ovarian tissue in vitro (Flint and Denton, 1969).
It could be postulated that the simultaneous uptake of cholesterol and glucose might have resulted from a gonadotrophic hormonal action. There are conflicting in vitro data evaluating this proposition. A stimulatory effect of LH treatment on cholesterol uptake was observed only in the presence of glucose (Flint and Denton, 1960), but ATP directly stimulated side-chain cleavage activity in the mitochondria from superovulated rat ovary.
The effect of ATP is apparently similar to the stimulatory effect of gonadotrophin in mi-tochondrial cholesterol utilization, although the enhancement of the rate of steroidogenesis by ATP and gonadotrophin was not additive (Stevenson et al., 1985). It appears that ATP promotes both cholesterol uptake into the inner mitochondrial membrane and the supply of electrons for cholesterol utilization from endogenous substrate (Stevenson et al., 1985). The lack, however, of significant correlations between arterial LH and the uptake of cholesterol or glucose by the ovary for the pooled cow data does not support this postulated mode of action. In vitro addition of LH does not augment the transformation of labeled cholesterol to progesterone to the same extent as NADP and glucose-6-P (Savard et al., 1965). Both NADP+and glucose-6-P increase the transformation of labeled cholesterol to progesterone
by 3–30-fold. Similarly, addition of gonadotrophins to incubating human and calf ovarian slices produced no stimulation of glucose oxidation (Field et al., 1960).
We found no significant relationship between arterial concentrations of LH and the uptake of cholesterol and glucose. This supports our previous finding (Rabiee et al., 1997a,b) that exogenous GnRH had no significant effect on the uptake of glucose and cholesterol by the ovary. Further, the addition of LH to incubated bovine ovarian tissue caused a highly significant increase in the synthesis of progesterone without affecting the rate of glucose uptake (Armstrong and Greep, 1962).
The uptake of cholesterol and glucose may be influenced by trophic hormones, including the peptide hormones such as IGF-I, insulin or other growth factors. The plasma concentra-tions of IGF-I and insulin are low during periods of negative energy balance after calving (Gluckman et al., 1987; Lucy et al., 1992). Because these growth factors are critical for the development of ovarian structures and functions (Adashi et al., 1985; Hammond et al., 1988), these may affect transovarian uptake of glucose and cholesterol, and steroidogenesis. Insulin addition, however, did not increase glucose uptake by the rat lutein tissue in vitro (Armstrong and Greep, 1962). Further studies are required to examine the effect of these peptide hormones on ovarian metabolism, and to examine the effect of 2-deoxy-d-glucose,
a metabolic inhibitor of glucose on cholesterol uptake in the ovary in vitro.
Our findings showing strong correlations between glucose and cholesterol uptake by the ovary, if repeated, suggest that methods to control or modify ovarian function could be developed through manipulating the uptake of cholesterol or glucose. The possibility that uptake of metabolites by other organs may be similarly linked should be investigated.
Acknowledgements
The authors are grateful to USDA Animal Hormone Program, USA (National Hormone and Pituitary Program), for providing the bLH used in these experiments. The authors ap-preciate the helpful assistance given by A. Pope, N. Weber, W.W. Thatcher and R Shumway for the statistical analysis. These studies were undertaken at the University of Sydney.
References
Adashi, E.Y., Resnick, C.E., D’Erole, A.J., Svoboda, M.E., Van Wyk, J.J., 1985. Insulin-like growth factors as intraovarian regulators of granulosa cell growth and function. Endocrinol. Rev. 6, 400–420.
Allain, C.C., Poon, L.S., Chan, C.S.G., Richmond, W., Fu, P.C., 1974. Enzymatic determination of total serum cholesterol. Clin. Chem. 20, 470–475.
Armstrong, D.T., Greep, R.O., 1962. Effects of gonadotrophic hormones on glucose metabolism by luteinized rat ovaries. Endocrinology 70, 701–710.
BMDP User Guide: Statistics, Version 7.0 Edition, 1992. BMDP Statistical Software Inc., Sepulveda Boulevard, CA.
Chase Jr, C.C., Del Vecchio, R.P., Smith, S.B., Randel, R.D., 1992. In vitro metabolism of glucose by bovine reproductive tissue obtained during the oestrous cycle and after calving. J. Anim. Sci. 70, 1496–1508. Chatfield, C., 1989. The Analysis of Time Series: An Introduction. Chapman & Hall, London, UK.
Field, G.B., Paston, I., Herring, B., Johnson, P., 1960. Study of pathways of glucose metabolism of endocrine tissue. Endocrinology 67, 801–806.
Flint, A.P.F., Denton, R.M., 1969. Glucose metabolism in the superovulated rat ovary in vitro. Biochem. J. 112, 243–254.
Flint, A.P.F., Denton, R.M., 1970. Metabolism of endogenous sterol ester by the superovulated rat ovary in vitro. Biochem. J. 116, 79–82.
Gafvels, M., Selstam, G., Damber, J.E., 1987. Influence of oxygen tension and substrates on basal and luteinizing hormone stimulated progesterone production and energy metabolism by isolated corpora lutea of adult pseudopregnant rats. Acta Physiol. Scand. 130, 475–482.
Hammond, J.M., Hsu, C.J., Mondschein, J.S., Channing, S.F., 1988. Paracrine and autocrine functions of growth factors in the ovarian follicle. J. Anim. Sci. 66 (Suppl. 2), 21–31.
Kappel, L.C., Ingraham, R.H., Morgan, E.B., Zeringue, L., Wilson, D., Babcock, D.K., 1984. Relationship between fertility and blood glucose and cholesterol concentrations in Holstein cows. Am. J. Vet. Res. 45, 2608–2612. Lucy, M.C., Beck, J., Staples, C.R., Head, H.H., De La Sota, R.L., Thatcher, W.W., 1992. Follicular dynamic,
plasma metabolites, hormones and insulin-like growth factor I (IGF-I) in lactating cows with positive or negative energy balance during the preovulatory period. Reprod. Nutr. Dev. 32, 331–341.
Niswender, G.D., Moore, R.T., Akbar, A.M., Nett, T.M., Diekman, M.A., 1975. Flow of blood to the ovaries of ewes throughout the estrous cycle. Biol. Reprod. 13, 381–388.
Rabiee, A.R., Lean, I.J., Gooden, J.M., Miller, B.G., 1997a. Short-term studies of ovarian metabolism in the ewe. Anim. Reprod. Sci. 47 (1–2), 43–58.
Rabiee, A.R., Lean, I.J., Gooden, J.M., Miller, B.G., Scaramuzzi, R.J., 1997b. An evaluation of transovarian uptake of metabolites using arterio-venous difference methods in dairy cattle. Anim. Reprod. Sci. 48, 9–25. Robinson, J., Stevenson, P.M., 1971. Electron flow cholesterol side-chain cleavage in ovarian mitochondria. Eur.
J. Biochem. 24, 18–30.
Savard, K., Marsh, J.M., Rice, B.F., 1965. Gonadotropins and ovarian steroidogenesis. Recent Prog. Horm. Res. 21, 285–365.
Scaramuzzi, R.J., Caddwell, B.V., Moor, R.M., 1970. Radioimmunoassay of LH and oestrogen during the oestrous cycle of the ewe. Biol. Reprod. 3, 110–119.
Schmidt, F.H., 1961. Die enzymatiche bestimmung von glucose und fructose nebneiander. Klin. Wschr. 39, 1244. Shumway, R.H., 1988. Applied Statistical Time Series Analysis. Prentice-Hall, Englewood Cliffs, NJ.
STATGRAPHICS, 1989. User Guide: Statistics, Version 4 Edition. STSC, Inc., Rockville, MD.
Stevenson, P.M., Scott, C.D., Galas, E.T., 1985. Interaction between ATP and cholesterol side-chain cleavage in mitochondria isolated from superovulated rat ovaries. Int. J. Biochem. 17, 1357–1362.
Uzgiris, V.I., McIntosh, E.N., Alonso, C., Salhanick, H.A., 1970. Role of reversed electron transport in bovine corpus luteum mitochondrial steroid synthesis. Biochemistry 10, 2916–2923.
Velhankar, D.P., 1973. Puberty and sexual maturity in Gir heifers consequential to different dietary energy levels with critical studies on blood glucose, copper, cholesterol and haemoglobin polymorphism. Ph.D. Thesis, Konkan Vidhyapeeth, Depoli, Maharashtra, India.