www.elsevier.comrlocateranireprosci
Oviductal isthmic motility patterns as monitored by
Polyview
e
in unrestrained sows around ovulation
A.M. Mwanza
), P. Englund, A. Pettersson, S. Einarsson
( ) Department of Obstetrics and Gynaecology, Centre for ReproductiÕe Biology in Uppsala CRU ,
Swedish UniÕersity of Agricultural Sciences, Box 7039, SE-75007 Uppsala, Sweden
Received 11 June 1999; received in revised form 6 October 1999; accepted 23 February 2000
Abstract
A method for monitoring oviductal isthmic motility in sows incorporating a computer
Ž .
programme Polyviewe was developed. This method was found to be reliable and easy for recording and analysing data. Isthmic motility patterns were monitored from 11 h prior to and up to 36 h after ovulation in 13 unrestrained multiparous sows during their second oestrus after weaning. The amplitudes and frequencies of phasic pressure fluctuations in relation to the hormonal profiles were also calculated. The isthmic motility patterns were regular before ovulation changing to wave patterns during the peri-ovulatory period and eventually to irregular patterns after ovulation. The amplitudes and frequencies of phasic pressure fluctuations were
Ž .
significantly higher p-0.05 prior to and soon after ovulation than afterwards. Plasma
oestra-Ž .
diol-17b levels significantly p-0.05 decreased before ovulation while plasma progesterone
Ž .
levels increased significantly p-0.05 after ovulation. Despite a significant decrease in the plasma levels of oestradiol-17b prior to ovulation, the amplitudes and frequencies of phasic pressure fluctuations remained high until shortly after ovulation. This could have been due to the endogenous levels of oestradiol-17bbound to the nuclear oestradiol-17breceptors that might still have been present in the isthmus. Conversely, the irregular isthmic motility patterns, the decline in the frequencies of phasic pressure fluctuations and amplitudes seen after ovulation may have been due to the rising plasma levels of progesterone. The amplitudes and frequencies of phasic pressure fluctuations were highest at the time when oestradiol-17b levels were highest and when proges-terone levels were low. It can be concluded that the changes in the isthmic motility patterns, amplitudes and frequencies of phasic pressure fluctuations in relation to the changes in the plasma levels of oestradiol-17b and progesterone seen in the present study prior to and after ovulation
)Corresponding author. Tel.:q46-18-67-29-04; fax:q46-18-67-35-45.
Ž .
E-mail address: [email protected] A.M. Mwanza .
0378-4320r00r$ - see front matterq2000 Elsevier Science B.V. All rights reserved.
Ž .
( ) A.M. Mwanza et al.rAnimal Reproduction Science 62 2000 309–320
310
indicate a possible role of the oviduct in regulating gamete transport.q2000 Elsevier Science
B.V. All rights reserved.
Keywords: Pig-oviduct; Isthmus; Pressure; Amplitudes; Oestradiol-17b; Progesterone
1. Introduction
Ž .
The oviduct uterine tube, Fallopian tube is involved in various and essential reproductive processes such as transport of gametes. Several factors are thought to be involved in the segmental displacement of gametes through the oviduct. However, it is generally believed that oviductal motility is one of the main factors contributing to
Ž .
gamete transport through the oviduct Blandau, 1973; Blandau and Verdugo, 1976 . This Ž
motility has been shown to be modified by circulating steroid hormones Spilman et al.,
. Ž
1978 . In vitro and in vivo studies on anaesthetised gilts Rodriguez-Martinez et al.,
. Ž .
1982a,b and on unrestrained gilts Pettersson, 1991 , using intraluminal pressure as an indirect measure of motility, have shown that the motility pattern during defined stages
Ž .
of the oestrous cycle varies. Recently, Mburu et al. 1996, 1997 found that ovulation had an effect on the distribution of spermatozoa and that the isthmic lumen was narrower before rather than after ovulation. No information on oviductal motility that is monitored continuously before and after ovulation and where the precise time of ovulation is known has been found in literature. Today, with the ultrasound technique, it Ž . is possible to pinpoint the time of ovulation. The aims of the present study were to: 1 further improve upon the methods for recording oviductal motility previously described ŽHenriksson et al., 1986, 1987 by adapting it to a computer software programme. ŽPolyviewe. Ž .; 2 characterise the isthmic motility pattern changes and the correspond-ing amplitudes and frequencies of phasic pressure fluctuations in the isthmus of the porcine oviduct around ovulation in unrestrained sows in their normal stable environ-ment.
2. Materials and methods
2.1. Animals
Ž .
A total of 15 crossbred Swedish Landrace=Swedish Yorkshire sows aged between 1.5 and 2.5 years, weighing between 200 and 250 kg and in their 2nd to 4th parities were used for this experiment. They were brought from one commercial farm to the Department of Obstetrics and Gynaecology on the day of weaning. The sows were housed in individual pens, with boars in their vicinity. The pens had a light period of 12 h starting from 0630 h and the room temperature varied between 208C and 238C. The
Ž .
the sows were slaughtered less than 54 h after ovulation. Two sows were removed from the study due to the failure of the silastic tubing for blood sampling and the failure of the pressure transducer after it was implanted, respectively.
2.2. Detection of oestrus and oÕulation
Sows were checked twice daily at 0600 and 1800 h for signs of pro-oestrus after which detection of onset of oestrus was performed every 4 h in the presence of a fertile boar by back-pressure. Ovulation in the 1st and 2nd oestrus was determined by
Ž .
transrectal ultrasonography Soede et al., 1992; Mburu et al., 1995 . An annular sector
Ž .
scanner scanner 250, Pie Medical, Maastricht, Netherlands with a 5-MHz multiple angle transducer was used. Sows were led one at a time into a wagon specially
Ž .
constructed for immobilising sows during the scanning Dalin et al., 1995 . Before scanning, faeces were carefully removed from the rectum manually using an abundant lubricant. Ultrasound gel was put into one of the fingers of a rectal glove; the transducer was then introduced into the glove and was tightly secured by tying two rectal glove fingers around it. The rectal glove containing the transducer was lubricated and carefully introduced into the rectum. Ovaries were then located and follicular development was monitored. Sows were scanned every 4 h from approximately 20 h after onset of oestrus. The time of ovulation was defined as 2 h before the first time when there was a significant reduction in the number of pre-ovulatory or when no pre-ovulatory follicles could be seen.
2.3. Blood sampling
Catherization of the jugular vein was performed at least 1 week before expected 2nd
Ž .
oestrus Rodriguez and Kunavongkrit, 1983 under general anaesthesia. Azaperon
Ž w
.
Stresnil was used as a pre-anaesthetic and administered intramuscularly at a dose of 0.5 mgrkg. Approximately 30 min later, general anaesthesia was induced by a
combina-Ž w.
tion of romifidin Sedivet at a dose of 0.125 mgrkg and a mixture of zolazepam and
Ž w.
tiletamin Zoletil at a dose of 1.25 mgrkg administered intramuscularly. Catheters were maintained by flushing twice a day with heparinized saline solution. Blood sampling commenced 12–24 h from the time of implantation of the intraluminal pressure transducer. Ten milliliters of blood was collected in heparinized tubes, cen-trifuged immediately and stored aty208C until analysed.
2.4. Implantation of intraluminal pressure transducer
On the day the sow was in standing oestrus, in the 2nd oestrus after weaning and
w Ž w
early in the morning, a Millar pressure transducer Mikro-tip , SPR 249, Millar .
Instruments, TX, USA was calibrated prior to implantation using a glass cylinder filled with water. A calibration signal of 10 mm Hg was used to adjust the monitor gain for
Ž .
the reading of 13.6 cm H O 10 mm Hg2 s13.6 cm H O . The microtransducer pressure2
Ž .
( ) A.M. Mwanza et al.rAnimal Reproduction Science 62 2000 309–320
312
monitor gain was adjusted to 10 mm Hg. The atmospheric pressure of the day was
Ž .
recorded and corresponded to the pressure on the water surface 0 cm H O and was2 used later when calculating the results. The pressure transducer, except for the electrical
Ž w.
connector was then immersed for 2 h in a glutaraldehyde solution Cidex after which it was rinsed with sterile saline solution. Finally, the pressure transducer was threaded
Ž .
through two sterile ureteric catheters 1.5 mm inner diameter, 2.0 mm outer diameter . Ž
The sow was put under general anaesthesia by thiopenthotal sodium Penthotal Sodium .
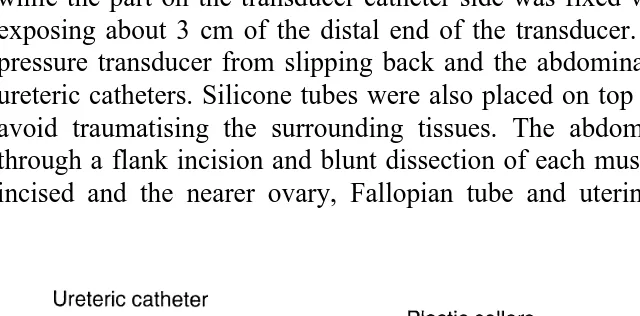
5% through the cannulated jugular vein and placed on the surgery table in lateral recumbence. Narcosis was maintained by inhalation of a blend of halothane and oxygen. A flank incision was made and a hollow steel probe was passed subcutaneously from the incision to the sow’s lumbar back where it was exteriorised. The ureteric catheters with the transducer inside were threaded through the steel probe from the lumbar back to the flank incision. The steel probe was removed; the two ureteric catheters were then joined together with Leukoplastw so that only about 3 cm of the distal end of the transducer
Ž . Ž
was left protruding Henriksson et al., 1986, 1987 . Four pairs of plastic collars 5 mm .
in diameter, 5 mm long were placed 2 cm apart on the distal 8 cm of the ureteric
Ž .
catheter. Within each pair, 5 mm separated each collar Fig. 1 . On the distal pair, a long
Ž .
silicone tube 5 mm in diameter, 1 cm long was placed at the end of the ureteric catheter and covered both the ureteric and pressure transducer catheters. The silicone
Ž .
tube on the ureteric catheter side was then fixed with a single surgical steel suture 4-0 while the part on the transducer catheter side was fixed with two surgical steel sutures, exposing about 3 cm of the distal end of the transducer. This was done to prevent the pressure transducer from slipping back and the abdominal fluids from flowing into the ureteric catheters. Silicone tubes were also placed on top of the surgical steel sutures to avoid traumatising the surrounding tissues. The abdominal cavity was then opened through a flank incision and blunt dissection of each muscle layer. The peritoneum was incised and the nearer ovary, Fallopian tube and uterine tip were exposed. A small
longitudinal incision was made through the uterine wall at the uterine tip enabling the distal end of the pressure transducer and the distal plastic collars to be passed into the uterine lumen. The distal end of the pressure transducer was then passed approximately
w Ž .
3 cm into the isthmus. Two Vicryl 4-0 sutures were placed through the uterine wall, then around the ureteric catheter but between the distal pair of plastic collars. The uterine wall was closed with a single layer of continuous invaginating sutures. The
w Ž .
ureteric catheter was further fixed by placing Vicryl 4-0 sutures through the uterine wall, around the ureteric catheter but between and behind the remaining sets of plastic collars. The organs were returned to the peritoneal cavity and the incision was closed. Another piece of Leukoplastw
was placed around the joint of the two ureteric catheters forming two wings. Each wing was then fixed to the sow’s back by a single suture. This was done to prevent the catheters with the transducer from changing position during recording times. The electrical connector of the pressure transducer was placed in a pouch sutured to the sow’s back, after which the sow was returned to its pen Ž1.45=2.90 m ..
2.5. PolyÕiewe data storage, acquisition and analysis
Recordings were made with the sow in its pen by connecting the electrical connector
Ž .
of the pressure transducer to a control unit TC-100, Millar Instruments that in turn was
Ž .
connected to an amplifier SenseLab 4Champ, Somedic Sales, Horby, Sweden and
¨
subsequently to Polyviewe. The chart speed was set to 25 mmrmin and the sampling rate to 100. Data were monitored in real time digital chart recorder mode and displayed on the ‘scrolling’ display similar to the polygraph chart paper and stored on the computer hard drive. Recordings were made every 4 h for 30 min from 12 to 24 h prior to expected ovulation and up to 36 h following ovulation. Waveform stored data were later retrieved, motility patterns visualised and minimum and maximum pressures determined by positioning the two cursors over a 2-min period when the sow was immobile. Amplitude was calculated as the difference between maximum and minimum pressures during a 2-min period. Four of the 2-min periods in each 30-min recordingŽ .
time were used for the calculations. The Fast Fourier Transform FFT was used to calculate the frequencies of phasic isthmic pressure fluctuations of the selected wave-form data.
2.6. Hormonal assays
2.6.1. Oestradiol-17b
Ž
Plasma oestradiol-17b was determined by radioimmunoassay Double antibody .
oestradiol, Diagnostic Products, Los Angeles, USA previously described for analysis of
Ž .
( ) A.M. Mwanza et al.rAnimal Reproduction Science 62 2000 309–320
314
Ž . Ž . Ž .
17% 4 pmolrl , 10% 40 pmolrl and 7% 70 pmolrl . The average detection limit of the assay was 3 pmolrl.
2.6.2. Progesterone
Ž
Plasma progesterone was determined by a luminescence immunoassay Amerlite, .
Kodak Clinical Diagnostics, England according to the manufacturer’s instructions but
Ž .
with some modifications. The assay reagent and HRP-labelled progesterone were diluted in saline solution 1:2. Standards were diluted in zero-plasma supplied in the kit to produce a standard curve ranging between 0.25 and 8 nmolrl. Serial dilutions of porcine plasma produced displacement curves parallel to the standard curve. The intra-assay coefficients of variation calculated from 10 assays were below 10% for concentrations between 0.25 and 8 nmolrl. The inter-assay coefficient of variation for one control
Ž .
sample was 11% 2 nmolrl . The average detection limit of the assay was 0.2 nmolrl.
2.7. Statistical methods
Motility and hormonal observations were grouped into 12 4-h periods according to
Ž .
recordingrsampling time with respect to ovulation three before and nine after . All
Ž .
observations at the time of ovulation time 0 were included in they3 to 0 h period. For each sow and 4-h period, mean values were calculated for motility and hormonal observations. Two sows were removed from the analyses due to missing hormonal or pressure values. The calculated mean values were analysed by analysis of variance
Ž
according to the GLM-procedure in the SAS package Statistical Analysis Systems
. Ž .
Institute, 1989 . The statistical model included the effects of sow 13 and the 4-h period Ž12 . There were 156 observations in the analyses and the number of observations. rsow ranged from 3 to 12.
3. Results
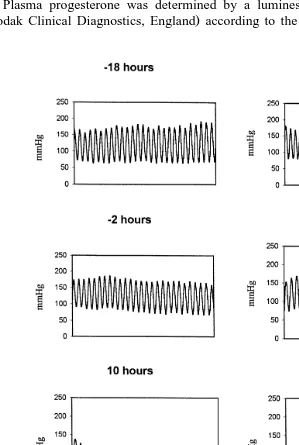
The implantation of the pressure transducer into the porcine isthmus, as shown in Fig. 1, permitted the monitoring of oviductal motility on one of the Polyviewe chart monitors. In all cases, the pressure transducer was in the correct position in the isthmus as checked at the time of slaughter and no macroscopic lesions were observed on the isthmic lumen. The isthmic motility patterns from one sow are shown in Fig. 2. The isthmic motility patterns were regular before ovulation but then changed to wave patterns during the peri-ovulatory period and eventually to irregular patterns after ovulation.
The levels of significance of the effects included in the statistical model are presented
Ž .
in Table 1. There was an influence p-0.001 of the sow on the amplitude, frequencies
Ž .
of phasic pressure fluctuations frequencyrmin , oestradiol-17b and progesterone. On
Table 1
Significance of the effects included in the statistical model
()
A.M.
Mwanza
et
al.
r
Animal
Reproduction
Science
62
2000
309
–
320
316
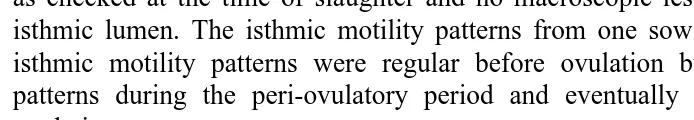
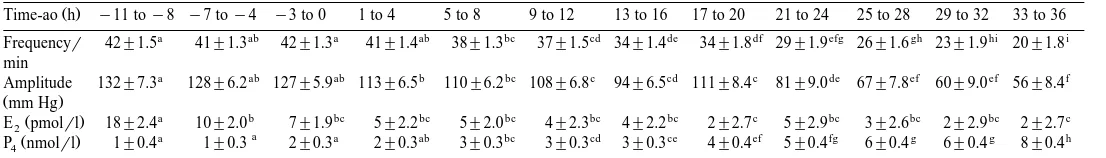
Table 2
Ž . Ž . Ž . Ž .
LSmean "SEM values of the isthmic frequencies of phasic pressure fluctuations frequenciesrmin , amplitudes mm Hg , plasma oestradiol-17b E2 and
Ž . Ž . Ž .
progesterone P4 levels in sows ns13 in relation to the time of ovulation time 0sovulation
Ž .
Time-ao h y11 toy8 y7 toy4 y3 to 0 1 to 4 5 to 8 9 to 12 13 to 16 17 to 20 21 to 24 25 to 28 29 to 32 33 to 36
a ab a ab bc cd de df efg gh hi i
Frequencyr 42"1.5 41"1.3 42"1.3 41"1.4 38"1.3 37"1.5 34"1.4 34"1.8 29"1.9 26"1.6 23"1.9 20"1.8 min
a ab ab b bc c cd c de ef ef f
Amplitude 132"7.3 128"6.2 127"5.9 113"6.5 110"6.2 108"6.8 94"6.5 111"8.4 81"9.0 67"7.8 60"9.0 56"8.4
Žmm Hg.
a b bc bc bc bc bc c bc bc bc c
Ž .
E2 pmolrl 18"2.4 10"2.0 7"1.9 5"2.2 5"2.0 4"2.3 4"2.2 2"2.7 5"2.9 3"2.6 2"2.9 2"2.7 a
a a ab bc cd ce ef fg g g h
Ž .
P nmol4 rl 1"0.4 1"0.3 2"0.3 2"0.3 3"0.3 3"0.3 3"0.3 4"0.4 5"0.4 6"0.4 6"0.4 8"0.4
Ž .
Ž .
the other hand, the 4-h period had a significant p-0.001 effect on the amplitude,
Ž .
frequencies of phasic pressure fluctuations frequenciesrmin , progesterone and
oestra-Ž .
diol-17b p-0.01 .
Ž .
The LSmean "SEM values for the frequencies of phasic pressure fluctuations,
Ž .
amplitudes mm Hg , plasma oestradiol-17b and progesterone levels during the 12 4-h periods in relation to ovulation are presented in Table 2. The frequencies of phasic pressure fluctuations were 42.9"1.5 approximately 8 to 11 h before ovulation and
Ž .
remained high during the subsequent periods before decreasing significantly p-0.05 to 38.4"1.3 during the period between 5 and 8 h after ovulation. The frequencies of phasic pressure fluctuations then gradually decreased over time to 20.6"1.8 between
Ž .
33 and 36 h after ovulation. The amplitudes decreased significantly p-0.05 from 132"7.3 mm Hg 8 to 11 h before ovulation to 113.6"6.5 mm Hg between 1 and 4 h after ovulation. Amplitudes then gradually decreased over time to 56"8.4 mm Hg 33 to 36 h after ovulation.
Ž .
Plasma progesterone levels increased significantly p-0.05 from 2"0.3 nmolrl between 3 and 0 h before ovulation to 3"0.3 nmolrl 5 to 8 h after ovulation. Progesterone then increased over time to 8"0.4 nmolrl.
Oestradiol-17b was 18"2.4 pmolrl between 8 and 11 h before ovulation and
Ž .
decreased significantly p-0.05 to 10"2.0 pmolrl 4 to 7 h before ovulation. Oestradiol-17b then continued to decrease during the subsequent periods reaching its
Ž .
lowest value of 2.2"2.7 pmolrl below detection limit 17 to 20 h after ovulation. The frequencies of phasic pressure fluctuations and the amplitudes were highest at the time when oestradiol-17b levels were highest and when progesterone levels were low.
4. Discussion
One of the objectives of the present study was to develop a reliable method for studying oviductal motility in sows. A method for recording oviductal isthmic pressure
Ž .
in unrestrained gilts was developed by Henriksson et al. 1986, 1987 . However, sows used for the present study were larger than gilts and there was a risk that the pressure transducer would easily slip away from the isthmus due to the interference by the large internal organs. Therefore, a modification of the method, able to withstand the interfer-ence by the internal abdominal organs of sows, was required. To avoid transducer
Ž .
displacement, a silicone tube 1 cm long was placed on both the ureteric and pressure transducer catheters and was fixed by surgical steel sutures. The four pairs of plastic collars placed on the ureteric catheter enabled the ureteric catheter with the pressure transducer catheter to be firmly fixed to the uterus by placing sutures through the uterine wall between and behind the collars. This increased the stability of both the ureteric catheter and pressure transducer. The Leucoplastw
wings formed around the joint of the two ureteric catheters and fixed to the sow’s back may have prevented the ureteric catheter with the transducer catheter from slipping from under the subcutaneous fatty
Ž .
( ) A.M. Mwanza et al.rAnimal Reproduction Science 62 2000 309–320
318
In the present study, plasma oestradiol-17b decreased to low but detectable levels Ž
before ovulation, which agrees with earlier findings Karlbom et al., 1982; Rojanasthien
. Ž .
1988 . Rojanasthien 1988 measuring oestradiol-17b in both the utero-ovarian and jugular vein plasma in sows found decreasing levels even in the utero-ovarian vein on the 1st day of standing oestrus. Peripheral plasma levels of progesterone were -2 nmolrl before ovulation but increased gradually after ovulation, reaching levels of )8 nmolrl at 33 to 36 h after ovulation in the present study. This concurs with the findings
Ž .
by Karlbom et al. 1982 , who did not detect any significant plasma levels of
Ž .
progesterone until after ovulation calculated ovulation time , reaching concentrations of
Ž .
10 nmolrl at Day 4 after onset of standing heat. However, Rojanasthien 1988 demonstrated elevated progesterone levels in the utero-ovarian vein 12–21 h earlier than in the jugular vein in sows. This means that significant levels of progesterone already appeared in the utero-ovarian vein before ovulation.
In vitro and in vivo studies in pigs have demonstrated that the oviduct is most active during the period of follicular predominance and up to the time of ova entry into the
Ž .
uterus Zerobin and Sporri, 1972; Rodriguez-Martinez et al., 1982a, b; Pettersson, 1991 .
¨
In the present study, the amplitudes and frequencies of phasic pressure fluctuations were recorded from 11 h before ovulation to 36 h after ovulation. In all sows, ova wereŽ .
present in the isthmus at 36 h after ovulation Mwanza et al., unpublished results . During this period, isthmic motility patterns were regular before ovulation, but became more irregular after ovulation. This could be attributed to changes in the plasma levels
Ž .
of oestradiol-17b and progesterone as suggested by Rodriguez-Martinez et al. 1984 ,
Ž . Ž .
Stanchev et al., 1985 and Pettersson, 1991 . The amplitudes and frequencies of phasic pressure fluctuations of the isthmus were highest before ovulation. During this 12-h period, oestradiol-17b gradually decreased to low plasma levels. The high amplitudes and frequencies of phasic pressure fluctuations could have been maintained by the levels of oestradiol-17b, which were bound to the nuclear oestradiol-17b receptors of the
Ž . Ž .
isthmus, as suggested by Rodriguez-Martinez et al. 1984 and Stanchev et al. 1985 . They found that a high degree of endogenous oestradiol-17b level was maintained in spite of low circulatory plasma levels of oestradiol-17b during oestrus and early luteal phase, owing to the presence of oestradiol-17b receptors. The comparable high ampli-tudes and frequencies of phasic pressure fluctuations, maintained even after ovulation, may have resulted in an increased tone of the isthmus and a reduction of the isthmic
Ž .
lumen leading to the retention of ova at the ampullary isthmic junction AIJ , where fertilisation occurs. The gradual decreases in amplitudes and frequencies of phasic pressure fluctuations observed after ovulation seem to be influenced by the rising plasma levels of progesterone seen in the jugular vein immediately after ovulation. This agrees with the findings in rabbits that the decrease in oviductal motility was mediated by
Ž
progesterone levels as corpora lutea were being formed Spilman, et al., 1978; Suzuki
. Ž .
and Tsutsumi, 1981 . This is further supported by the findings by Rojanasthien 1988 , who observed an increase of progesterone levels in the utero-ovarian vein plasma 12–21 h earlier than in the jugular plasma in sows. However, more significant influences of progesterone on the isthmic motility seem to occur later after ovulation, and may be due
Ž
to the gradual increase of progesterone nuclear receptors Rodriguez-Martinez et al., .
The decrease in the amplitudes and frequencies of phasic pressure fluctuations around ovulation may have resulted in a decrease of the isthmic tonus and an increase in luminal diameter. These events might initially have permitted viable spermatozoa to be released from the storage site and transported to the site of fertilisation, and later to ova
Ž .
displacement within the isthmic lumen. Mburu et al. 1997 also demonstrated morpho-logically a widening of the UTJ and isthmic lumen in connection with ovulation. Furthermore, they demonstrated that ovulation was accompanied by relocation of spermatozoa in that a higher fraction of middle and upper isthmus segments contained more spermatozoa during the peri- and post-ovulatory periods than during the pre-ovula-tory period.
5. Conclusions
Ø The results presented here indicate that isthmic motility can be monitored continu-ously on Polyviewein unrestrained sows around ovulation.
Ø The changes in oviductal motility pattern before and after ovulation indicate a possible role of the oviduct in gamete transport.
Ø The changes in oviductal motility in relation to changes in hormonal concentrations support the theory that motility is mainly mediated by oestrogen and progesterone.
Acknowledgements
We gratefully acknowledge the financial support by the Swedish Council for Forestry and Agricultural Research, a University of Zambia scholarship and study leave granted to Dr. A.M. Mwanza. We thank Drs. Nils Lundeheim and Mats Forsberg for their help with statistical and hormonal analyses, respectively and Carola Jansson, Mari Wallbring, Kjell-Ove Eklund and Helen Gille for the invaluable help with the experimental animals.
´
References
Ž .
Blandau, R.J., 1973. Gamete transport in the female mammal. In: Greep, O., Astwood, E.G. Eds. , Handbook of Physiology vol. 2 American Physiological Society, Washington, DC, pp. 153–163, Sect. 7.
Blandau, R.J., Verdugo, P., 1976. An overview of gamete transport — comparative aspects. WHO Sympo-sium on Ovum Transport and Fertility Regulation. pp. 138–146.
Dalin, A.-M., Nanda, T., Hulten, F., Einarsson, S., 1995. Ovarian activity at naturally attained oestrus in the´
sow, an ultrasonographic and LH study. Acta Vet. Scand. 36, 377–382.
Duchens, M., Forsberg, M., Edqvist, L.-E., Gustafsson, H., Rodriguez-Martinez, H., 1994. Effect of induced suprabasal progesterone levels around estrus on plasma concentrations of progesterone, estradiol-17band LH in heifers. Theriogenology 42, 1159–1169.
Henriksson, A., Rodriguez-Martinez, H., Einarsson, S., 1986. A new method for monitoring oviductal intraluminal pressure changes in the unrestrained sow. Vet. Res. Comm. 10, 223–228.
( ) A.M. Mwanza et al.rAnimal Reproduction Science 62 2000 309–320
320
Karlbom, I., Einarsson, S., Edqvist, L.-E., 1982. Attainment of puberty in female pigs: clinical appearance and patterns of progesterone, oestradiol-17band LH. Anim. Reprod. Sci. 4, 301–312.
Mburu, J.N., Einarsson, S., Dalin, A.-M., Rodriguez-Martinez, H., 1995. Ovulation as determined by transrectal ultrasonography in multiparous sows: relationships with oestrous symptoms and hormonal profiles. J. Vet. Med., Ser. A 42, 285–292.
Mburu, J., Einarsson, S., Lundeheim, N., Rodriguez-Martinez, H., 1996. Distribution, number and membrane integrity of spermatozoa in the pig oviduct in relation to spontaneous ovulation. Anim. Reprod. Sci. 45, 109–121.
Mburu, J.N., Rodriguez-Martinez, H., Einarsson, S., 1997. Changes in sperm ultrastructure and localisation in the porcine oviduct around ovulation. Anim. Reprod. Sci. 47, 137–148.
Pettersson, A., 1991. Cyclic variations in intraluminal pressure in the isthmus of the oviduct in unrestrained gilts. J. Vet. Med., Ser. A 38, 337–343.
Rodriguez-Martinez, H., Kunavongkrit, A., 1983. Chronic venous catheterization for frequent blood sampling in unrestrained pigs. Acta Vet. Scand. 24, 318–320.
Rodriguez-Martinez, H., Einarsson, S., Larsson, B., Akusu, M., Settergren, I., 1982a. Spontaneous motility of the pig oviduct in vitro. Biol. Reprod. 26, 98–104.
Rodriguez-Martinez, H., Einarsson, S., Larsson, B., 1982b. Spontaneous motility of the oviduct in the anaesthetised pig. J. Reprod. Fertil. 66, 615–624.
Rodriguez-Martinez, H., Stanchev, Ph., Edqvist, L.-E., Einarsson, S., 1984. Estrogen and progesterone nuclear receptor levels in the pig oviduct in relation to its spontaneous motility. 10th International Congress on Animal Reproduction and Artificial Insemination, June 10–14, University of Illinois at Urbana-Champaign, IL, USA. Vol. III. Brief communications. Paper no. 488, 3 pp.
Rojanasthien, S., 1988. LH-patterns in jugular plasma and oestradiol-17b and progesterone in utero-ovarian and jugular plasma of primiparous sows around weaning. J. Vet. Med., Ser. A 35, 498–505.
Simonsson, A., 1994. Naringsrekommendationer och fodermedelstabeller till svin. Swedish University of¨
Agricultural Sciences, SLU Info rapporter, Husdjur 75.
Soede, N.M., Noordhuizen, J.P.T.M., Kemp, B., 1992. The duration of ovulation in pigs studied by transrectal ultrasonography is not related to early embryonic diversity. Theriogenology 38, 653–666.
Spilman, C.H., Shaikh, A.A., Harper, M.F.K., 1978. Oviductal motility, amplitude and ovarian steroid secretion during egg transport in the rabbit. Biol. Reprod. 18, 409–417.
Stanchev, Ph., Rodriguez-Martinez, H., Edqvist, L-E., Eriksson, H., 1985. Oestradiol and progesterone receptors in the pig oviduct during the oestrous cycle. J. Steroid Biochem. 22, 115–120.
Statistical Analysis Systems Institute, 1989. 4th edn. SASrSTAT User’s Guide, Version 6 vol. 2 SAS Institute, Cary, NC.
Suzuki, H., Tsutsumi, Y., 1981. Effect of exogenous ovarian hormones on contractility of the reproductive tract of postcoital rabbits. Jpn. J. Zootech. Sci. 52, 889–897.
Zerobin, K., Sporri, H., 1972. Motility of the bovine and porcine uterus and fallopian tube. Adv. Vet. Sci.¨