TOWARDS THE INFLUENCE OF A CAR WINDSHIELD ON DEPTH CALCULATION
WITH A STEREO CAMERA SYSTEM
A. Hanel*, L. Hoegner, U. Stilla
Photogrammetry and Remote Sensing, Technische Universitaet Muenchen, 80333 Munich, Germany (alexander.hanel, ludwig.hoegner, stilla)@tum.de
Commission V, WG V/3
KEY WORDS: Stereo camera, depth calculation, camera calibration, bundle adjustment, statistical test
ABSTRACT:
Stereo camera systems in cars are often used to estimate the distance of other road users from the car. This information is important to improve road safety. Such camera systems are typically mounted behind the windshield of the car. In this contribution, the influence of the windshield on the estimated distance values is analyzed. An offline stereo camera calibration is performed with a moving planar calibration target. In a standard procedure bundle adjustment, the relative orientation of the cameras is estimated. The calibration is performed for the identical stereo camera system with and without a windshield in between. The base lengths are derived from the relative orientation in both cases and are compared. Distance values are calculated and analyzed. It can be shown, that the difference of the base length values in the two cases is highly significant. Resulting effects on the distance calculation up to a half meter occur.
1. INTRODUCTION 1.1 Car cameras for depth estimation
Safety is a very important aspect for public road traffic. Modern cars are often equipped with advanced driver assistance systems to improve safety (Gavrila, 2000; Franke et al., 2013). For example, an emergency braking assist can prevent read-end collisions.
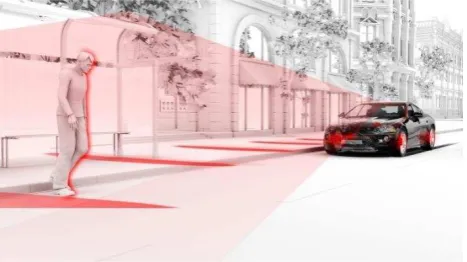
Assistance systems use in many cases stereo cameras to observe the environment in front of the car (Horgan, et al., 2015). For example, the distance to a preceding car or a pedestrian can be determined with a stereo camera system (Figure 1).
Such a car camera system is typically placed behind the windshield. Image rays from outside the car falling onto the image sensor of the cameras have to pass through the windshield.
Figure 1. Car camera system used to determine distance to a pedestrian on the road (SCN, 2015).
In the ideal case assumed in photogrammetry, a camera follows the pinhole model. Image rays are linear and all rays of an image intersect in one point. In the case of real measurements, deviations from the ideal pinhole model, for example caused by lens distortions, will occur. These deviations can be reduced by geometric camera calibration and image rectification.
* Corresponding author
To obtain the distance of a pedestrian from the car, the depth of the camera system to the pedestrian has to be calculated. High precision depth calculation requires a very rigid mounting of the two stereo cameras on a common platform. This mounting defines the geometric relation between the two cameras and is described by the relative orientation.
Simultaneous camera calibration with the identical calibration target estimates for stereo cameras the parameters of the relative orientation and also the parameters of single camera calibration. The baseline between the cameras can be derived thereof. As the depth is calculated by triangulation, the length of the baseline has an influence on the accuracy of the calculated depth.
It is obvious, that for both car stereo cameras, the image rays go through the windshield. This will influence the path of the image rays of each single camera causing a deviation from the ideal pinhole model. It can further be expected, that different parts of the windshield have a slightly different curvature. Additionally, the cameras will not be placed centered behind the windshield. These two aspects will cause a different influence on the image rays of the first and second stereo camera, respectively.
The mentioned effects on the rays will have an influence on the relative orientation and also on the calculated depth. In this contribution, this influence on the stereo baseline will be investigated. The propagation of these influences on depth calculation will be analyzed.
1.2 State of the art
Closely connected to it is radiometric camera calibration (Healey and Kondepudy, 1994; Seon and Pollefeys, 2008) dealing with estimation of the radiometric response function of a camera. Radiometric calibration can be done without a calibration pattern by using the known ratio of exposure between different images (Mitsunaga and Nayar, 1999). Geometric camera calibration estimates values for the interior and exterior orientation of a camera (Fraser, 2012; Hartley and Zisserman, 2003). Geometric calibration can also be used to obtain the relative orientation of two sensors (Zhang and Pless, 2004).
Camera calibration is also important for vehicle cameras in order to ensure reliable results of object detection in images (Ernst et al., 1999). Calibration of vehicle cameras can be done in two ways. Automatic calibration while the car is driven is often performed by extracting road markings from the images. Ribeiro et al. (2006) use this extraction method to calibrate an embedded camera. Road lanes are detected and road boundaries derived. Parameters of projective mapping are determined automatically using the projection of originally 3d coordinates of the road to 2d image coordinates. Therefore, a flat road is assumed for a plane-to-plane mapping with projection error minimization (Gennery, 1977).
Manual calibration in a repair garage is often performed if a windshield has to be replaced (D&R, 2015). The methods used are similar to the calibration of hand-held cameras. Interior as well as exterior parameters will be obtained. The car is placed in front of a brand specific calibration pattern and a tool of the car’s camera control unit is used to take images of the pattern and to process them. To link the camera orientation to a car coordinate system, the position of the car relative to the calibration pattern has to be measured with high precision.
Sometimes the relative orientation of a vehicle camera to other car sensors has to be obtained. Catalá-Prat et al. (2006) use the extraction of road markings to co-register a front looking camera with the inertial measurement unit of the car.
For vehicle stereo camera systems, additionally stereo calibration has to be performed. As most critical and sensitive camera parameters of a stereo camera system, the relative orientation is identified (Marita et al., 2006). A drift of only a few seconds in the relative angle between the two cameras will lead to a lack of reconstructed 3d points. Therefore, these authors suggest a laboratory based initial estimation of the calibration parameters and a repeated driving based monitoring of these parameters.
The topic of calibrating vehicle cameras has to be separated from the calibration of fix-position traffic surveillance cameras. Dubská et al. (2014) describe a method for fully automatic estimation of the orientation of such camera relative to the direction of the traffic stream. Therefore two orthogonal directions are detected by tracking image points corresponding to moving vehicles. The orthogonal directions can be derived from vanishing points obtained from the movement of the tracked image points.
Nowadays, algorithms for depth estimation from stereo camera images are well known (e.g. Scharstein and Szeliski, 2002). Images are stereo rectified with the parameters obtained from the stereo camera calibration. Point-to-point correspondences are searched in rectified image pairs to calculate the disparity and to derive the depth.
Without using stereo cameras, depth estimation is also possible with a single depth-camera measuring the time-of-flight between camera and objects (Hoegner et al., 2014). The estimated depth is normally represented by a depth map (Zhu et al., 2008). A more efficient way are stixels. They describe the geometry by the
ground plane, the distance to objects and the object height (Badino et al., 2009). They allow faster extraction of stereo information, for example for fast pedestrian detection (Benenson et al., 2012).
Multimedia photogrammetry treats photogrammetric applications, in which image rays pass through different optical media with different refractive indices. (Maas, 1995). A typical example is underwater photogrammetry, where the ray path leads from water via a glass layer to air before entering the lens (Maas, 2015). A car windshield causes an air-glass and glass-air transition when rays are passing through it. Ray mirroring at the inner air-glass-transition is used for head-up-displays in cars. Optical aberrations like astigmatism or distortion have to be considered (Díaz, 2005). The same path take rays from undesirable reflections of the dashboard into a camera behind the windshield. Simon and Park (2015) propose a method to reduce these reflections by assuming that the reflection of the static dashboard remains static.
2. METHODOLOGY
This contribution proposes a method to analyze the influence of the windshield of a car on the calculated base length of a stereo camera system. The camera system is looking through the windshield. The base length is being calculated in a stereo calibration process.
A bundle adjustment is applied on a set of image pairs of a stereo camera system. The images show a calibration pattern with varying position, orientation and scale within the images. The parameters of the interior, relative and the exterior orientation are estimated. The 3d object coordinates of the calibration marks are kept fixed. The baseline between the two cameras is obtained. The bundle adjustment is performed for two image sets:
- Case 1: Through the windshield of a car - Case 2: Not through the windshield
The difference of the two calculated base lengths is determined and the significance of the difference checked with a statistical test. The effect of the base length difference on depth values calculated from the stereo system will be shown.
2.1 Bundle adjustment
The bundle adjustment estimates for each camera the interior orientation ( , , ), for each pair of cameras the relative orientation ( , , , rotation matrix �) and for each image the exterior orientation ( , , , �) of the cameras. Additionally, image distortion parameters are estimated (radial-symmetric , , , radial-asymmetric , (Brown, 1971), affinity and skew , (El-Hakim, 1986)) for each camera. The standard deviation of all orientation parameters will be obtained. Object coordinates , , and image coordinates , with their standard deviation are given a-priori. Object coordinates are kept fixed in the adjustment to introduce a scale constraint.
The calculation will be formulated as a least squares adjustment with redundancy based on the collinearity equations:
= − ⋅� ( − )+� ( − )+� ( − ) � ( − )+� ( − )+� ( − ) (1)
The adjustment minimizes the differences � , � (equation 3, 4) between the measured image coordinates , and the values for the image coordinates ̂ , ̂ calculated from the collinearity equations with the estimated orientation parameters:
� = ̂ − (3)
� = ̂ − (4)
The projection through the windshield will not be modelled.
2.2 Calculation of the stereo base length
The stereo base length will be calculated from the position
with containing the partial derivatives of this formula (equation 5) with respect to the error-prone items. All three position parameters are considered as error-prone:
= [�� �� �� ] (7)
The covariance matrix � contains the variance and covariances of the error-prone items: through the windshield and another time the base length _ is calculated for images taken not through the windshield.
2.3 Statistical hypothesis testing
A two-sided Welch’s t-test (Welch, 1947) is used to test the significance in the difference between and _ . Welch’s t-test is a statistical two-sample test derived from the Student’s t -test (Student, 1908). It is used for independent samples with different variances.
The base lengths can be seen as independent, as the corresponding images are taken independently during different measurement processes.
The t-test statistic is calculated as follows:
= | �− o_ws| (9)
using the variance of the base lengths and the redundancy of the bundle adjustments.
The degrees of freedom and the significance level � are used to obtain the threshold value −�;� for a two-sided test from the
t-distribution. The hypothesis � is false, if
{ | < − −�;�} or {| > −�;�}. (12)
Otherwise � is true.
The hypothesis � for the base length test is assuming equality of the base lengths:
� : − _ = (13)
The alternative hypothesis � is assuming inequality of the base lengths. Inequality can mean that is smaller than _ and vice versa:
� : − _ ≠ (14)
2.4 Effect on calculated depth
The depth of a pixel in an image pair can be calculated from the disparity value obtained from the rectified images:
= ⋅�
� (15)
with the base length and the focal length � of the rectified images. The metric distance between corresponding image points is calculated as follows:
= ( + − ) ′ (16)
with the disparity in pixels and with the column pixel coordinate / of the rectified principal points of camera 1 and 2, respectively. ′ is the metric distance between the centers of two neighboring pixels on the image sensor plane.
The variance of the depth can be calculated also by error propagation:
� = ⋅ � ⋅ � (17)
with the partial derivatives
= [�� ��� ��
�] (18)
considering errors in the base length, the focal length and the metric distance between corresponding image points and
� = [ �
��
� �
]. (19)
from the rectification after the bundle adjustment. The standard deviation �� will be calculated by error propagation with
equation 16 assuming � = � and a value for � from the rectification. The depth values will be calculated for a given set of disparity values. The disparity values will be chosen as a series of increasing values resulting in decreasing depth values.
3. EXPERIMENTS
The calibration will be performed for two cameras of a stereo camera system (Figure 2). The cameras are mounted rigidly on a metal platform. The basis between the cameras is mainly orthogonal to the optical axis of the cameras and is around 33 cm. Theoretical analysis has shown, that smaller base length values lead to a strong decrease in depth accuracy in the desired working range up to 100m (approx. reaction and braking distance from 100 km/h), while larger values only lead to a small increase in depth accuracy. Though, a much larger base length would lead to a decrease in depth accuracy near the car (approx. 3m).
Figure 2. Rigid stereo cameras looking nearly parallel through the curved windshield of a car. Curvature of windshield along
and across the driving direction can be seen.
The optical axes of the cameras are almost parallel. For case 1 (cf. section 2), the platform is mounted on the dashboard of a car. For case 2, the platform is mounted on a table. Neither the car nor the table are being moved during image acquisition.
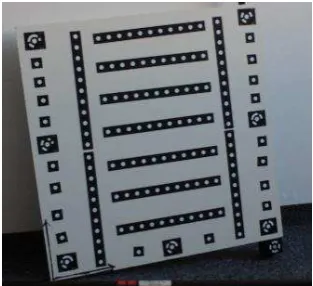
As calibration pattern photogrammetric marks on a planar target are used (Figure 3). This target was chosen for its handiness, as a person can turn and move the target easily. A static target would make it necessary to move the car, which requires lot of space
and can’t be done for all degrees of freedom.
Figure 3. Planar calibration pattern with photogrammetric marks. Coded (w/ annulus) and uncoded marks are used. Marks
printed on adhesive paper labels are fixed on a wooden board.
The 3d object coordinates of the marks are obtained by bundle adjustment with high precision reference scales and reference origin points. The mean standard deviation of the three coordinate components of the marks is around . �� each. The stereo cameras are two industrial cameras of the same model with a 6 mm lens (Table 1). Images are taken for case 1 through (Figure 4) and for case 2 not through (Figure 5) the windshield. Around 30 images are taken by each camera in each case. The distance of the calibration pattern to the cameras is between 1m and 3m in both cases. The full field of view of each camera is covered by the calibration pattern over the whole image series. The calibration pattern is rotated between the images. The images are taken during daylight with infinite focus of the camera and a fixed focal number. Corresponding stereo images are taken simultaneously.
Figure 4. Image of the left industrial camera showing the calibration pattern through the windshield of the car.
For the separate image processing of both cases, the image coordinates of the calibration marks are measured. The 2d image coordinates of the marks are co-registered with the 3d object coordinates of the calibration pattern. Several iterations of the bundle adjustment are performed until the adjustment converges. The interior, relative, exterior orientation as well as the image and object coordinates are adjusted.
Figure 5. Image of the left industrial camera showing the calibration pattern without looking through the windshield.
The two values for the stereo base length are calculated. The hypothesis test is performed. Depth and standard deviation are calculated.
Camera (SVS, 2015)
SVS-VISTEK SVCam eco655MVGE Monochrome CCD
2448 x 2050 px 3.45 x 3.45 µm Optics
(VS, 2015)
VS Technology SV-0614H Focal length 6mm Focal number 1.4 ~ 16
4. RESULTS AND DISCUSSION
The bundle adjustment is calculated for both cases with two variations in the adjustable parameter sets (results Table 2). It converges in every case. The first variation considers the interior (including distortion coefficients), relative and exterior orientation as well as the image coordinates as adjustable. The second variation considers, that the pre-calibrated interior orientation (and the distortion coefficients) of the cameras do not depend on whether the images are taken through a windshield or not (cf. Peipe and Tecklenburg, 2006) and therefore these items are fixed in the bundle adjustment. On the other side, the first variation allows changes in the values of the interior orientation to investigate, whether and how much these items can compensate the effects of the windshield. In both variations, the object coordinates are kept fixed to introduce a scale constraint as the calibration pattern is not influenced by the windshield.
The prior interior orientation for the cameras is obtained from a geometric camera calibration performed separately for both cameras. The prior for the relative orientation is obtained from a stereo calibration using the corners of a planar chessboard pattern.
The results of the bundle adjustment show that the base length differs between cases 1 and 2 by around 8-10 mm. The base lengths are shorter for case 1. The standard deviation of the base length in case 2 is clearly lower than in case 1 with a ratio more than 5. The difference of the base lengths is much bigger than the
� interval around the calculated values.
It is likely, that the high standard deviation in case 1 and the difference between the base length values is caused by the windshield of the car. A few effects have to be taken into account. First, the windshield is curved. Additionally, the curvature of the windshield is different within the field of view of a camera. The windshield has certain fabrication tolerances which might effect slight variations in the curvature. These aspects will lead to a different fraction of the image rays from the calibration marks outside the car going to the camera inside the car. They will influence the measured image coordinates. Second, the two cameras are looking through the windshield at different positions. The variations in the curvature will therefore be different for the field of view of both cameras. It will have an effect on the measured image coordinates of corresponding points in a stereo image pair. Third, the cameras are not placed exactly central behind the windshield. The curvature of the windshield differs between its edges and its center. The angle between the windshield and the optical axis of the lenses will therefore be different for both cameras. This might add different fraction to the image rays for the two cameras coming from outside the car.
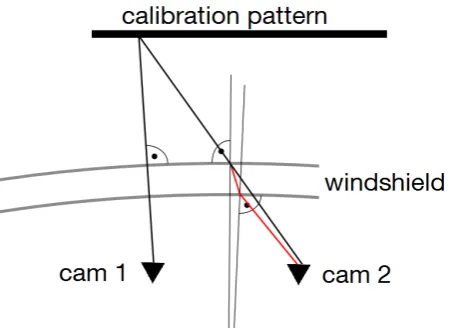
The measured image coordinates might be also influenced by the maximum distance of 3m of the calibration pattern away from the cameras. This causes highly non-parallel image rays from the different calibration marks to the camera in a pinhole model. The image rays therefore intersect the windshield in different angles and are therefore fractured differently (Figure 6). An indicator for
this effect might be the RMS of the image coordinate residuals (Table 3), which is much higher for the right camera. It is also much higher for case 1 than for case 2. Compared to the absolute values of the image coordinates (around 1-2 mm), the RMS of the residuals is still smaller by at least factor 1000.
Left camera Right camera Case � [��] � [��] � [��] � [��]
1 0.0551 0. 0710 0. 7479 0. 6238 2 0. 0099 0. 0086 0. 1913 0. 1912 Table 3. RMS of the image coordinate residuals (x = horizontal,
y = vertical) for the bundle adjustment with the interior orientation not fixed.
Plots (Figure 7) of the image coordinate residuals confirm that the residuals are much smaller if the windshield is not within the image ray path. In all plots the x- and y-residuals (x = horizontal, y = vertical) have a Gaussian shape. Although, the mean of the Gaussian shape of the x- and y-residuals differs slightly in each plot. There is no systematic occurrence, which one of the two coordinate components has a lower mean. In the case through the windshield, the Gaussian shape widens at the bottom more up, than in the case without the windshield. This might indicate, that the residuals scatter with a higher value around the mean.
Figure 6. Schematic top down view: Image rays (black lines) of a calibration mark intersecting the windshield. If intersection is not orthogonal to windshield, the image ray is fractured (red
line).
A larger distance of the calibration pattern would make the image rays more parallel. This might lead to a more similar intersection angle and therefore a more similar fraction. It can be assumed, that this would reduce the influence of the windshield and its curvature on the image coordinates. A greater distance would also meet the range requirements for depth estimation in cars better.
The typical depth range is influenced by the driving speed and braking distances, which is much greater than 3 m. On the other Table 2. Results of bundle adjustment. Column 2: Fixed parameters, which are not adjusted during bundle adjustment. (IO = Interior
Orientation, OC = object coordinates) Colum 3 and 4: Focal length. Column 5: Redundancy. Columns 6 and 7: Base length and standard deviation. Column 8: Result of test for significant difference.
Case Fix Focal length left camera [mm]
Focal length right camera [mm]
Redundancy [��] � [��] Significant difference
1 OC 5.0322 6.4079 11311 327.4408 0.2611 yes
2 OC 6.4393 6.3494 11342 335.3535 0.0415
1 OC, IO
6.1058 6.1098 11305 323.8055 0.2584 yes
Figure 7. Residuals of image coordinates of all images. From top: Left camera with windshield, right camera with windshield,
left camera without windshield, right camera without windshield.
hand, the camera calibration was already performed with the camera focus set to infinity, so a greater distance will not affect the camera settings.
At the moment, physical changes of the relative orientation of the cameras are not considered. Such changes may occur because of thermal heating caused by solar irradiation or due to mechanical forces affecting the camera platform and mounting caused by shocks while driving.
The used movable calibration pattern is advantageous for the proposed task. Using a not movable pattern would make it necessary to move the car. Besides the needed space and effort to do it, the camera system would be exposed to mechanical forces. On the other side, a movable target might not be as rigid as a non-movable one. It might be affected by torsion or small movements of the target during image exposure.
Keeping the interior orientations fixed has only minor influence on the results of bundle adjustment. In both cases it leads to a slightly shorter base length. Also the standard deviation does not change very much compared to adjustable interior orientations. Adjustment of the interior orientation leads to a much larger change of the focal length of the left camera from the pre-calibrated value in case 1 than in case 2. The different intersection angle through the windshield might cause this effect. Though in both variations the correlation � between the focal length and the base length is small (− . ≤ � ≤ . ).
The statistical test (results Table 2) is performed with a significance level � = 99%. Due to the high redundancy obtained from the bundle adjustments, the degree of freedom can be assumed to be infinite for the calculation of the test threshold.
The Welch’s test proves that the base length differs significantly between cases 1 and 2. This applies if all orientation parameters are being adjusted as well as if the interior orientation is kept fix. All other measurement conditions are the same for the two cases. These results allow the conclusion, that there is a significant influence of the windshield on the base length. Further modelling of the path of the image rays through the windshield should be considered in the bundle adjustment to reduce the influence.
The difference in the base length has influence on the depth values (Figure 8) of the stereo system calculated for the cases 1 and 2.
Figure 8. Calculated depth for a chosen set of disparity values. Case 1: Images through windshield (lower curve). Case 2: Images not through windshield (upper curve). Approx. 0.5m
Between the cases, the depth values differ approximately 0.5m for certain disparity values. As all other parameters are the same for both cases, this difference can be drawn back to the base length. As the absolute distance range relevant for car stereo cameras is typically much larger than .5�, the effect of this difference on driver assistance systems can be seen as small.
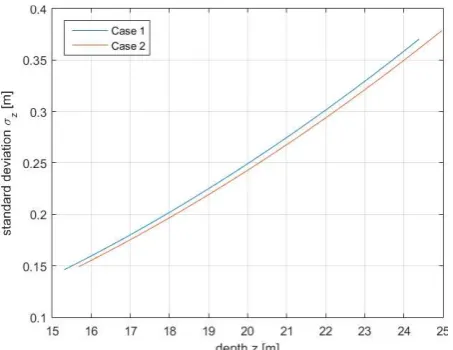
Also the calculated standard deviation of the depth (Figure 9) is influenced by the base length. As expected due to the higher standard deviation of the base length in case 1, also the standard deviation of the depth is higher for this case. This difference is small compared to the absolute values of the standard deviation. The influence of the image coordinate measurements on the standard deviation of the depth is small. Only if the measurement quality is very low (~ RMS 1px), its influence on the standard deviation of the depth increases remarkably. The biggest influence even for small changes of its values has the rectified principal point.
Figure 9. Standard deviation of the calculated depth for cases 1 (upper curve) and 2 (lower curve).
This makes it difficult to recognize an influence of the windshield only from the standard deviation. It underlines, that the influence of the standard deviation of the base length on the standard deviation of the depth is small compared to other aspects.
5. CONCLUSION
In this paper, the effect of a car windshield on the depth calculation from stereo images was discussed. A set of image pairs of a rigid stereo camera system showing a planar calibration pattern has been taken both with and without a windshield in between. Bundle adjustment was used to derive the base length. Statistical tests proved a highly significant difference between the base lengths derived in the two situations. It was shown, that the estimated depth values differ by approximately .5�. It could further be shown, that the difference in the base length results also in a slightly different standard deviation of the depth values. Images through the windshield are shown to have a bigger standard deviation. This can be interpreted as the necessity to model the image ray path through the windshield in the bundle adjustment to avoid this problem.
Further research has to be done in the modelling of the geometry of the windshield and the integration of the model into a bundle adjustment. Future experiments should involve calibration targets with varying distances over the complete relevant range for driver assistance applications. High-precision distance measurements from the camera to the calibration targets should
be performed to evaluate the accuracy of the calculated depth values.
ACKNOWLEDGEMENTS
The authors want to thank Sebastian Tuttas for the support during the acquisition of the calibration images.
REFERENCES
Asada, N., Amano, A., Baba, M., 1996. Photometric calibration of zoom lens systems. In: Pattern Recognition, 1996, Proceedings of the 13th International Conference on, vol. 1, pp. 186-190.
Badino, H., Franke, U., Pfeiffer, D., 2009. The Stixel World - A Compact Medium Level Representation of the 3D-World. In: Proceedings of the 31st DAGM Symposium on Pattern Recognition, pp. 51-60.
Benenson, R., Mathias, M., Timofte, R., Van Gool, L., 2012. Fast stixel computation for fast pedestrian detection. In: Computer Vision – ECCV 2012. Workshops and Demonstrations, vol. 7585, pp. 11-20.
Catalá-Prat, Á., Rataj, J., Reulke, R., 2006. Self-calibration system for the orientation of a vehicle camera. In: Maas, H.-G., Schneider, D. (eds), Proceedings of the ISPRS Commission V Symposium 'Image Engineering and Vision Metrology', pp. 68-73.
Díaz, L. S., 2005. Optical aberrations in head-up displays. Thesis, Comillas Pontifical University, ICAI School of Engineering.
D&R, 2015. Dick and Ricks Auto Interiors Inc: Windshield Replacement. http://www.dickandricks.com/blog/windshield-replacement-not-the-same-glass-repair-as-yr-last-vehicle (2015-12-08).
El-Hakim, S., 1986. Real-time image metrology with CCD cameras. In: Photogrammetric Engineering & Remote Sensing, vol. 52(11), pp. 1757-1766.
Ernst, S., Stiller, C., Goldbeck, J., Roessig, C., 1999. Camera Calibratoin for Lane and Obstacle Detection. In: 1999 IEEE/IEEJ/JSAI International Conference on, pp. 356-361.
Franke, U., Pfeiffer, D., Rabe, C., Knoeppel, C., Enzweiler, M., Stein, F., Herrtwich, R.G., 2013. Making Bertha See. In: Computer Vision Workshops (ICCVW), 2013 IEEE International Conference on, pp. 214-221.
Fraser, C.S., 2013. Automatic camera calibration in close-range photogrammetry. In: Photogrammetric Engineering and Remote Sensing, vol. 79(4), pp. 381-388.
Gavrila, D., 2000. Pedestrian Detection from a Moving Vehicle. In: Vernon, D. (ed), Computer Vision — ECCV 2000, Lecture Notes in Computer Science, vol. 1843, pp. 37-49.
Gennery, D. B., 1977. A stereo vision system for an autonomous vehicle. In: IJCAI'77 Proceedings of the 5th international joint conference on Artificial intelligence, vol. 2, pp. 576-582.
Healey, G. E., Kondepudy, R., 1994. Radiometric CCD camera calibration and noise estimation. In: Pattern Analysis and Machine Intelligence, IEEE Transactions on, vol. 16(3), pp. 267-276.
Hoegner, L., Hanel, A., Weinmann, M., Jutzi, B., Hinz, S., Stilla, U., 2014. Towards people detection from fused time-of-flight and thermal infrared images. In: International Archives of the Photogrammetry, Remote Sensing and Spatial Information Sciences, vol. XL-3, pp. 121-126.
Horgan, J., Hughes, C., McDonald, J., Yogamani, S., 2015. Vision-Based Driver Assistance Systems: Survey, Taxonomy and Advances. In: Intelligent Transportation Systems (ITSC), 2015 IEEE 18th International Conference on, pp. 2032-2039.
Kingslake, R., 1983. Optical system design. Academic Press, Waltham, USA.
Krawczyk, G., Goesele, M., Seidel, H.-P., 2005. Photometric Calibration of High Dynamic Range Cameras. Research Report. Max-Planck Institute for Informatics, Saarbrücken, Germany.
Maas, H.-G., 1995. New developments in Multimedia Photogrammetry. Optical 3D Measurement Techniques III.
Maas, H.-G., 2015. A modular geometric model for underwater photogrammetry. In: International Archives of the Photogrammetry, Remote Sensing and Spatial Information Sciences, vol. XL-5/W5, pp. 139-141.
Marita, T., Oniga, F., Nedevschi, S., Graf, T., Schmidt, R., 2006. Camera Calibration Method for Far Range Stereovision Sensors Used in Vehicles, In: Intelligent Vehicles Symposium, 2006 IEEE, pp. 356-363.
Mitsunaga, T, Nayar, S. K., 1999. Radiometric self calibration. In: Computer Vision and Pattern Recognition, 1999. IEEE Computer Society Conference on, vol. 1, pp. 374-380.
Peipe, J., Tecklenburg, W., 2006. Photogrammetric camera calibration software – a comparison. In: Proceedings of the
ISPRS Commission V Symposium ‘image Engineering and Vision Metrology’, ISPRS Archives, vol. XXXVI-5.
Ribeiro, A. A. G. A., Dihl, L., Jung, C. R., 2006. Automatic camera calibration for driver assistance systems. In: Proc. International Conference on Systems, Signals and Image Processing, pp. 173-176.
Scharstein, D., Szeliski, R., 2002. A Taxonomy and Evaluation of Dense Two-Frame Stereo Correspondence Algorithms. In: International Journal of Computer Vision, vol. 47(1), pp. 7-42.
SCN, 2015. ZF TRW demos Highway Driving Assist and new camera and radar systems. http://safecarnews.com/zf-trw-demos-
highway-driving-assist-and-new-camera-and-radar-systems_ju625/ (2015-12-10).
Seon, J. K., Pollefeys, M., 2008. Robust Radiometric Calibration and Vignetting Correction. In: Pattern Analysis and Machine Intelligence, IEEE Transactions on, vol. 30(4), pp. 562-576.
Simon, C., Park, I. K., 2015. Reflection removal for in-vehicle black box videos. In: Computer Vision and Pattern Recognition (CVPR), 2015 IEEE Conference on, pp. 4231-4239.
Student, 1908. The Probable Error of a Mean. In: Biometrika, vol. 6(1), pp. 1-25.
SVS, 2015. Factsheet Camera eco655MVGE. https://www.svs-vistek.com/de/svcam-kameras/svs-svcam-factsheet.php?id= eco655MVGE&type=cameras&lang=de (2015-12-08).
VS, 2015. Factsheet Optics SV-0614H. https://www.vst.co.jp/de/products/machinevision/lenses/mega-pixel-cctv-lenses/ (2015-12-08).
Welch, B. L., 1947. The Generalization of `Student's' Problem when Several Different Population Variances are Involved. In: Biometrika, vol. 34(1/2), pp. 28-35.
Zhang, Q., Pless, R., 2004. Extrinsic Calibration of a Camera and Laser Range Finder (improves camera calibration). In: Intelligent Robots and Systems, 2004. Proceedings. 2004 IEEE/RSJ International Conference on, vol. 3, pp. 2301-2306.