USE OF EARTH OBSERVATION FOR GEOSPATIAL CROP WATER ACCOUNTING OF
RAIN-FED AGRO-ECOSYSTEM IN INDIA
N. R. Patel, Manish Sarkar and Suresh Kumar Indian Institute of Remote Sensing, ISRO, Dehradun – 248001
Email: [email protected]
Commission VIII, WG VIII/6
KEY WORDS: Earth observation, seasonal phenology, WRSI, rain-fed agro-ecosystem, crop yield
ABSTRACT:
Use of earth observation by means of remote sensing and in-situ meteorological network in integrated manner have improved ability to track water availability and associated yield reduction in rain-fed crops as potential indicators of early warning and food security. the present study aims at monitoring of WRSI and production potential of rain-fed agro-ecosystems in eastern Rajasthan. The study was carried out during the kharif season using remote sensing, meteorology and soil information from year 1998 to 2004. Important datasets used in the study are Dekadal Normalized Difference Vegetation Index (NDVI) from SPOT-VEGETATION, gridded rainfall based on 300 rain-gauge stations, reference ET (ETo), and gridded soil water holding capacity (WHC). In addition, crop statistics and crop calendar information were also used in this study. The phenological metrices from time-series of SPOT-VGT NDVI were derived on inter-annual scales by applying Gaussian fit within TIMESAT procedure. WRSI was found promising in capturing inter-annual and spatial variability in water availability to rain-fed crops. The WRSI has also showed significant relationship with reported yield particularly in drone-prone areas. Water limited-yield stays on higher side but it has showed strong response to large scale drought.
1. INTRODUCTION
The problem of food security along with the question of sustainability of livelihood system poses a key policy challenge in the rain-fed regions of monsoon Asia because erratic monsoon in these areas causes recurrent drought episodes and lead to large variation in agricultural yields. India ranks first among the rain-fed agricultural countries of the world in terms of both extent (86 M ha) and value of produce. The climate in these regions is characterized by complex climatic deficiencies, manifested as water scarcity for rain-fed crop production.
Tracking the spatial and temporal patterns of rainfall with respect to crop and soil characteristics can reveal situations of yield reduction due to water deficits. Crop water accounting to provide information on water availability for optimum crop harvest is critical to achieve sustainability of rain-fed agriculture. Spatially explicit and inter-annual variability on water requirement satisfaction index (WRSI) and related water-limited production are potential indicators of crop performance and their responses to climate variability. The WRSI model by definition represents relative relationship between water demand and supply for rain-fed crop throughout the crop growing season (Frere and Popov, 1986) and also provides information on water availability for crop production. WRSI can be related to crop production using a linear yield reduction function specific to a crop (FAO, 1977; FAO, 1979) and the reduction of crop yield due to water deficit is simulated from it (Doorenbos and Pruitt, 1992). The WRSI concept attempts to capture the water-limited level of production without modeling potential production (Victor et al., 1988; Patel et al., 2004; Patel et al., 2005). Yield reduction estimates based
on WRSI contribute to food security preparedness and planning. The WRSI model can have flexibility to be integrated either with independent estimate of potential yield (Drissen and Konjin, 1992) or embedded in process based models for operational yield forecasting.
ISPRS Archives XXXVIII- 8/W20; Workshop Proceedings: Earth Observation for Terrestrial Ecosystems ecosystem responses to climate variability (White et al., 1997;
Heumann et al., 2007; Brown and de Beurs, 2008). Space-based inputs of phonological parameters are thus, a necessary to WRSI model for policy making decision related to food security, water allocation and carbon sequestration. In view of immense significance of multi-temporal remote sensing and water balance modeling in monitoring water availability to crop and, consequently, crop performance, we focused on improving crop water accounting in rain-fed crops (e.g. sorghum, pearlmillet and maize) of eastern Rajasthan by implementing WRSI model on a grid basis with length of growing season and SOS as parameter obtained from time-series of SPOT-vegetation data.
2. MATERIALS AND METHODS
2.1 WRSI model
The WRSI model uses simple water balance procedure that is applicable to variety of crops by specifying appropriate constants as described by Doorenbos and Kassam (1986), Doorenbos and Pruitt (1992), and the FAO (1986). In general, WRSI represent the extent to which water requirement of a crop met during a growing season. When water supply is limited, actual evapotranspiration (ET
a) is less than maximum evapotranspiration
(ET
m), and the crop suffers water-stress. The WRSI for a season is
calculated as the ratio of seasonal actual evapotranspiration (ETa) to the seasonal crop water requirement (ETm). The monthly decadal record of water-stress are subsequently summed over the season and subtracted from 100 to yield the seasonal WRSI as follows :
ETm is calculated from Hargreaves method based potential
eva-potranspiration (PET) using the crop coefficient (Kc) to adjust for the growth stage of the crop: Crop specific parameters such as KC and duration of stages for maize, sorghum and pearlmillet ob-tained from literature (Tyagi et al., 2000 & 2003; Kichar et al., 2003).
ETm = PET * KC (2)
ETa represents the actual (as opposed to the potential) amount of
water withdrawn from the soil water reservoir ("bucket"). When-ever the soil water content is above the maximum allowable dep-letion (MAD) level (based on crop type), the ETa will remain the same as ETm, i.e., no water stress. But when the soil water level is
below the MAD level, the ETa will be lower than WR in
propor-tion to the remaining soil water content.
The soil water content is obtained through a simple mass balance equation where the level of soil water is monitored in a bucket de-fined by the available holding capacity (WHC) of the soil and the crop root depth, i.e.,
SWi = SWi-1 + PPTi – ETai (3)
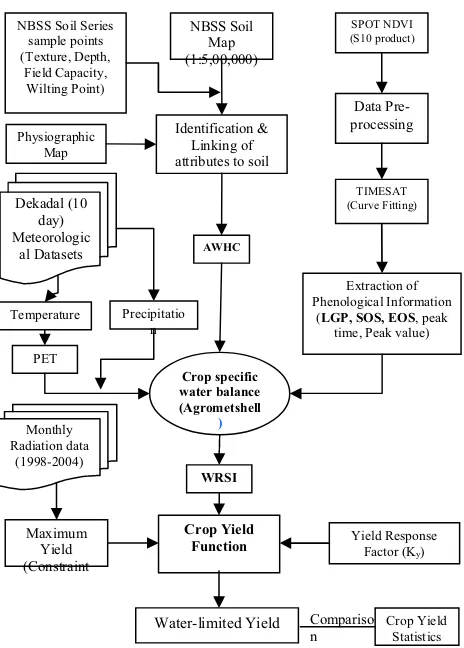
Where, SW is soil water, PPT is precipitation, and i is the time step index. The water balance model was operated within Agrometshell on 0.1 degree grid and at decadal time step over 36 dekads in a year. The most important inputs to the model were precipitation and potential evapotranspiration (PET) at 0.1 degree grid. The WRSI calculation also requires a start-of-season time (SOS) and end-of-season time (EOS) for each modeling grid-cell. The SOS and EOS parameter for each grid obtained from time-series NDVI of SPOT-VGT sensor. The schematic diagram of methodological steps is also presented in figure 1.
Fig. 1 Schematic diagram for geospatial estimation of WRSI and water-limited yield of rain-fed crops
WRSI can be related to crop production or yield estimate by using the following linear yield-reduction function (FAO yield-water use model):
Actual Yield (Ya) = Ym – (Ym * Ky * (1 – WRSI)) (4)
The response of yield to water supply is quantified through the yield response factor (ky) which relates relative yield decrease
(1-Ya/Ym) to relative evapotranspiration deficit (1-ETa/ETm). The
yield response factors were taken from FAO Irrigation and Drainage paper (FAO, 1979). Ym is the constraint-free or potential
yield, generally obtained from process-based model or estimated based on generic crop photosynthetic properties and radiation data. In the present study, constraint-free yield for all three crops
NBSS Soil
Water-limited Yield Crop Yield
Statistics
ISPRS Archives XXXVIII- 8/W20; Workshop Proceedings: Earth Observation for Terrestrial Ecosystems computed as per method described by Driessen and Konijn
(1992). The ky values for most crops are derived on the
assumption that the relationship between relative yield (Ya/Ym)
and relative evapotranspiration (ETa/ETm) is linear and is valid for
water deficits of up to about 50 percent.
2.2 Estimation of growing season parameters
Phenological metrices such SOS, EOS and length of growing period (LGS) were estimated for each grid for kharif season (June-October) from 1998 to 2004 using dekadal (10 day) SPOT-VGT NDVI data. Curve fitting approach was adopted for deriving the phenological metrics from time series SPOT-VGT NDVI. The software TIMESAT was used within MATLAB for fiting a smooth continuous curve to time series of NDVI data using asymmetrical Gaussian functions (Jönsson & Eklundh, 2002, 2004). For improving accuracy of curve fitting to derive seasonal parameters, eleven homogeneous zones with respect to unique seasonality character were obtained by unsupervised classification of first three components of time-series principal component analysis. The mean time-series profile of the 11 classes were taken from the signature file and were selected as an input for phenological information extraction of the 11 classes. Phenological parameters extracted from the temporal NDVI dataset includes SOS, EOS, length of the season, peak time and peak value.
2.3 Data sets and Tools
2.3.1 Satellite data
:
Ten-day composite of NDVI products (S10) available from SPOT-VEGETATION (VGT) sensor for the period from May, 1998 to April, 2007 were downloaded from the VGT free data product Internet site (http://free.vgt.vito.be) for the present study. The product was georeferenced using the Albers Conical Equal Area projection. The original data comprised of the whole of the Southeast-Asian region. From the image the area comprising of the Rajasthan was extracted by overlaying the Rajasthan state boundary. Wavelet filtering was applied to 10-day NDVI composite to reconstruct a cloud-free seasonal profile of NDVI.2.3.2 Meteorological data: Daily Precipitation data of 300 mandal level raingauge stations for the year 1998 to 2004 were obtained for the entire state of Rajasthan. The daily data was added up to get the dekadal (10 day) sum. Inverse distance weighted (IDW) interpolation was used for interpolating the point data to acquire the dekadal pattern. IDW method gives each neighbouring station a weight which is proportional to a power of the inverse of the station distance. Thus, closer stations have more weight in the interpolation procedure than stations that are further away. Daily maximum and minimum temperature data of 27 stations were directly used for the potential-evapotranspiration (PET) calculation following Hargreaves method.
2.3.3 Available water holding capacity: Available water holding capacity for 1m depth was determined as product of difference in volumetric moisture content at field capacity (FC) and permanent wilting point (PWP) and depth of soil layers. Spatially-explicit map of AWHC was derived by assigning AWHC of 117 sites corresponding with soil series to physiographic soil mapping units
based on texture, depth and geographic positions.. The soil series attributes for 117 sample points were taken from the soil series of Rajasthan published by NBSS & LUP. The soil map published by the NBSS & LUP at 1:5,00,000 scale was used for the creation of the digital soil database. The soil series locations and their characteristics were taken from the soil series of Rajasthan published by NBSS & LUP
.
2.3.4 Crop yield data: Historical crop yield statistics used in this study were downloaded from website, statistics at a glace hosted by Ministry of Agriculture. Crop yields of sorghum, maize and pearlmillet at district level in eastern Rajasthan for the period of 1998-2004 were compiled for further analysis.
2.3.5 The AgroMetShell : is a new tool developed by FAO SDRN that provides a toolbox for agrometeorological crop monitoring and forecasting. It is a user friendly tool with a “visual menu” that offers easy access to some of the most often used functions. The programme includes a database that holds all the weather, climate and crop data needed to analyse the impact of weather on crops. Data of available water holding capacity and decadal time-series of rainfall and potential evapotranspiration of each grid inputed in Ascii format. These databases comprised a total of 1513 covering the entire part of Eastern Rajasthan. Within the AgroMetShell, the FAO Crop Specific Soil Water Balance was operated in “monitoring mode” which provided an analysis and outputs of water balance parameters (ETa, ETm, water deficit and water surplus etc) for each grid during different growth stages of crop under study..
3. RESULTS AND DISCUSSION
3.1 Variability in growing season parameters
Time-series of NDVI had biomadal pattern due to mostly double crop practiced in a region. Analysis of seasonal parameters in the present study was however mainly confined to kharif season only. The temporal and spatial pattern in start-of-season (SOS) reveals that SOS varies from first dekad of June to last dekad of July (Fig.2).
ISPRS Archives XXXVIII- 8/W20; Workshop Proceedings: Earth Observation for Terrestrial Ecosystems curvilinear and weak in humid (R2 = 0.22, N= 43) and sub-humid
(R2 = 0.33, N = 28) tract of eastern Rajasthan. The LGP was found to vary from 75 days to 135 days across time and space. LGP in eastern Rajasthan was above 100 days during normal years e.g. 1998 and 2003. However, drought stress during 2002 and 2004 caused reduction in LGP by 20-30 days (LGP < 100 days) due to delayed SOS on account of delayed onset of monsoon or advancement of EOS parameter. The semi-arid plains had in general lower LGP than areas falling in sub-humid and humid part of study area. The highest LGP in the order of 120-130 days were observed during 1998 and 2003. Whereas the lowest LGP in the order of 80-90 days was noticed in 2002 and 2004. In general, mean LGP over eastern Rajasthan showed declining trend from 1998 onwards, barring year 2003 (Fig. 3).
3.2 Spatial patterns in WRSI
The crop water requirement satisfaction index (WRSI) computed grid-wise (10km x 10km) for Sorghum, Pearl Millet and Maize over 1998-2004 period and mean spatial pattern presented in fig. 4.. The water requirement satisfaction index varies from 0 to 100. A value of 0 indicates that the crop suffered from severe water stress and a value of 100 indicates there was no water stress during the growing season. Spatial pattern reveals relatively less magnitude of WRSI in western part of study area. The low WRSI in western part reflects that rain-fed crop are more subjected to water stress. Water stress was more severe in semi-arid and transitional plains as depicted by low WRSI. However, humid part of study area covering Banswara, Kota and Dungarpur districts had experienced little water stress.
3.3 Inter-annual variability in WRSI
The temporal trend in WRSI of rain-fed crops across the years for the different agro-climatic zones shows that degree of water stress experienced by pearl millet is lesser as compared to sorghum and maize (Fig.5). WRSI of three crops was drastically declined during 2002 in semi-arid and transitional plain because these regions are more sensitive to fluctuation in rainfall caused by large scale drought. The WRSI value was less than 50 for sorghum and maize except pearl millet having a WRSI value less than 60. However the humid zones were less affected due to the drought related water stress. The temporal trend also showed that the water requirement satisfaction index for the three crops was higher across all years in the humid south eastern plain as compared to the other agro-climatic zones. In humid zone, the WRSI was found almost above 80 for all years.
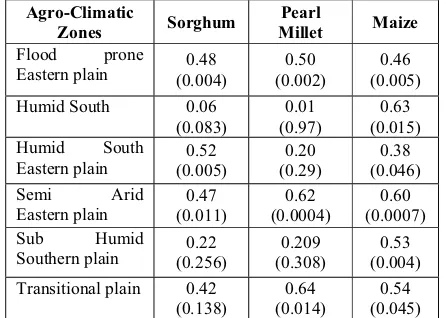
3.4 Relationship between WRSI and reported yield
The WRSI as yield estimator was investigated by comparing district level yield against district-average WRSI for various group of districts forming agro-climatic zones (Table 1). We observed that the correspondence in mean inter-annual patterns between WRSI and reported yield of three crops is promising. The relationship between mean reported yield and WRSI of entire study area was highly significant and positive with R2 (> 0.5, p < 0.05) for all three rain-fed crops. While comparing agro-climatic zone wise, the WRSI of all three crops was found to be strongly related to reported district level yield for districts falling in semi-arid eastern plain and flood prone eastern plain. In humid south eastern plain, WRSI of sorghum and Maize showed significantly
positive association with corresponding district-level yield (p < 0.05). Poor association of WRSI of pearlmillet in this region was due to very less area coverage of this crop in districts falling in this region. It would be therefore necessary to test influence of percent area of crop within a district on WRSI and yield relationship. Apart from this, yield variability in humid-climate is much more controlled by management practices compared to inter-annual fluctuation in climate. Strong relationship of WRSI with yield indicates that WRSI could track variability in yield of rain-fed crops in water-limited districts.
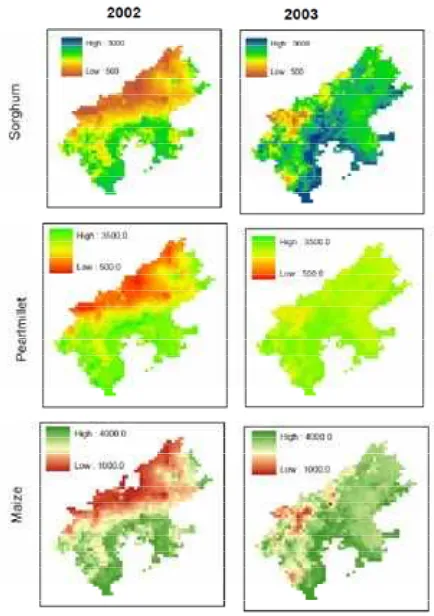
3.5 Water limited yield and their patterns
Spatio-temporal dynamics of water-limited yield of sorghum, maize and pearlmillet was generated by relating WRSI with potential yield based on FAO approach. Simulated water limited yield showed distinct spatial variability. The spatial pattern reveals that the eastern part of the study area had high levels of water-limited yield and decreased gradually towards the western part for the study area. This pattern in simulated yield was caused by variation in water availability in eastern and western bound areas. The simulated water-limited yield was higher in humid south and humid south eastern plain than transitional plain and semi arid eastern plain. The water limited yield in sub humid southern plain and flood prone eastern plain falls between these two limits. The transitional plain showed the minimum water-limited yield incase of sorghum and maize whereas semi arid eastern plain showed the minimum incase of pearl millet out of all the agro-climatic zones. Inter-annual pattern of average water limited yield over eastern Rajasthan captured the effect of drought stress on crop performance. Water limited yield of all three crops declined drastically, particularly in the semi arid eastern plain due to severe drought in year 2002. The water-limited yield for sorghum, pearl millet and maize was reduced to 1014 kg/ha, 1180 kg/ha, 786 kg/ha in the year 2002 as compared to 2421 kg/ha, 2516 kg/ha, 3327 kg/ha in the normal year 2003, respectively. The mean water-limited yield for sorghum, pearl millet and maize from 1998-2004 was found to be 2114 kg/ha, 2258 kg/ha, 2795 kg/ha. Transitional plain 0.42
(0.138)
0.64 (0.014)
0.54 (0.045) Table 1. Correlation coefficient between WRSI and actual yield,
ISPRS Archives XXXVIII- 8/W20; Workshop Proceedings: Earth Observation for Terrestrial Ecosystems
Fig. 2 Spatial variation in start of season (SOS) over eastern Rajasthan
Fig. 3 Inter-annual variability in LGP
Fig. 4. Spatial pattern of mean WRSI of rain-fed crops
Fig. 5. Inter-annual variation in WRSI of rain-fed crops
Fig. 6 Spatial pattern of water-limited yield of rain-fed crops in drought (2002) and Normal (2003) years.
4. CONCLUSIONS
This study explores use of phonological metrices such as SOS and LGP in deriving spatio-temporal dynamics of WRSI and associated reduction in production potential of rain-fed crops under water stress. The significant and positive relationship of LGP with rainfall indicate that multi-temporal NDVI could captured variability in growing season caused by fluctuation in timing and amount of rainfall. The resultant WRSI patterns correspond well with reported yield, particularly in highlighting
80 85 90 95 100 105 110 115 120 125 130
1998 1999 2000 2001 2002 2003 2004
Year
L
G
P
(
d
ays
)
semi-arid plain sub-humid plain Mean LGP
S ub Humid S outhern Plain
0 20 40 60 80 100
1998 1999 2000 2001 20022003 2004
Year
WR
S
I
Humid zone
0 20 40 60 80 100
1998 1999 2000 2001 2002 2003 2004
Year
WR
S
I
S emi Arid Eastern Plain
0 20 40 60 80 100
1998 1999 2000 2001 2002 2003 2004
Year
WR
S
I
Transitional Plain
0 20 40 60 80 100
1998 1999 2000 2001 2002 2003 2004
Year
WR
ISPRS Archives XXXVIII- 8/W20; Workshop Proceedings: Earth Observation for Terrestrial Ecosystems the relatively dry year of 2002. The high degree of correlation
between WRSI and yield of maize, pearlmillet and sorghum in semi-arid areas reflects that WRSI has potential in tracking yield variability in drought-prone areas. So WRSI can characterized water-limited yield in years that faced large-scale drought and appeared to be a good indicator in early warning for water and food.
REFERENCES
Brown, M. E. and de Beurs, K. M., 2008, Evaluation of multi-sensor semi-arid crop season parameters based on NDVI and rainfall. Remote Sensing of Environment 112: 2261–2271. Driessen, P. M. and Konijn, N. T., 1992, Land-use systems analysis. Wageningen: Wageningen Agricultural University FAO, 1977, Crop water requirements. FAO Irrigation and Drainage Paper No. 24, by Doorenbos J and W.O. Pruitt. FAO, Rome, Italy.
FAO, 1979, Yield Response to Water. FAO Irrig. And Drain. Paper No. 33, Doorenbos, J. and Kassam, A.H., Fao, Rome, Italy. 193 Pp.
Frere, M. and Popov, G. F., 1986, Early Agrometeorological crop yield forecasting. FAO Plant Production and Protection paper No. 73, FAO, Rome, Italy.
Heumann, B. W., Seaquist, J. W., Eklundh, L. and Jönsson, P., 2007, AVHRR derived phenological change in the Sahel and Soudan, Africa, 1982–2005. Remote Sensing of Environment 108 : 385–392.
Khichar M. L., Niwas, R. and Prakash, O., 2003, Crop coefficients of pearl millet (Pennisetum Glaucum) under rainfed condition. Annals of Agricultural Research New Series 24: 838 – 41
Patel, N. R., 2004, SW-CROP and its potential for mapping water deficit and relative yield potential in rainfed wheat using GIS. Journal of Agrometeorology, 6(2):178-187.
Patel, N. R., Suresh Kumar and Pande, L. M., 2005, Quantifica-tion of Water Limited Yield in Rainfed Crops Using GIS Based Modeling. Journal of Applied Hydrology : 61-67.
Senay, G.B. and J. Verdin, 2003. Characterization of Yield Re-duction in Ethiopia Using a GIS-Based Crop Water Balance Model. Canadian Journal of Remote Sensing, 29(6):687-692. Tyagi N. K., Sharma, D. K. and Luthra S. K., 2000, Evapotrans-piration and Crop Coefficients of Wheat and Sorghum Climate in India. Journal of Irrigation and Drainage Engineering 126: 215-22 Tyagi, N. K., Sharma, D. K. and Luthra, S. K., 2003, Determination of evapotranspiration for maize and berseem clover. Irrigation Science 21: 173-81
Verdin, J. and R. Klaver, 2002, Grid cell based crop water accounting for the famine early warning system. Hydrological Processes, 16:1617-1630.
Victor, U. S., Srivatsava, N. N. and Ramana Rao, B.V., 1988, Quantification of crop yields under rainfed conditions using a simple soil water balance model. Theoretical and Applied Climatology, 39: 73-78
White M.A., Thornton P.E. and Running S.W., 1997, A continental phenology model for monitoring vegetation responses to inter-annual climatic variables. Global Biogeochemical Cycles, 11, 217–234.
ACKNOWLEDGEMENT