Ionospheric potential as a proxy index for global
temperature
Ralph Markson
a,), Colin Price
ba
Airborne Research Associates, 46 Kendal Common Road, Weston, MA 02493, USA
b
Tel AÕiÕUniÕersity, Ramat AÕiÕ69978, Israel
Received 15 December 1997; received in revised form 3 August 1998; accepted 15 November 1998
Abstract
Since the global circuit is maintained by currents from thunderstorms and electrified clouds,
Ž .
which are controlled by temperature, we are investigating the use of ionospheric potential VI as a measure of the variation of global temperature. We report positive correlation between V andI
global temperature obtained from three different data sets. V is also positively correlated with anI
inferred global lightningrdeep cloud index which is positively correlated with global temperature. Thus, there is a consistent picture of warmer temperatures leading to more deep convection and higher V . Since a series of single V soundings at any appropriate location may provide a globallyI I representative measure of temperature variation in real time, it is suggested that routine monitoring of this parameter could provide considerable cost and operational advantages compared to current methodology involving observations at thousands of ground stations and satellite radiation measurements.q1999 Elsevier Science B.V. All rights reserved.
Keywords: Ionospheric potential; Satellite; Surface temperature
1. Introduction
This is an interim report of an ongoing program to study the possibility of utilizing relatively simple and inexpensive measurements of the global circuit to monitor changes
Ž .
in global temperature. The ionospheric potential V , a measure of the totality ofI
currents from all atmospheric electrical generators, is a simple scaler quantity which can
)Corresponding author. Tel.:q1-781-8991834; E-mail: [email protected]
0169-8095r99r$ - see front matterq1999 Elsevier Science B.V. All rights reserved.
Ž .
Ž . Ž .
be determined from aircraft Clark, 1958; Markson, 1976 or balloon Muhleisen, 1971
¨
electric field soundings. Because of convective activity leading to thunderstorms and electrified shower clouds, the generators maintaining V , are controlled by temperature,I particularly in the equatorial zone, tropics and mid-latitudes. We have been investigating the possibility of using V measurements to monitor global temperature variation.I
The fact that VI is maintained by a natural phenomenon—deep convection and
probably currents from less electrified shower clouds that cover a much larger fraction of the Earth’s surface than thunderclouds—is particularly appealing for observing
atmospheric variability. One can consider V data as in effect a remote thermometer inI
Ž
space continually taking the integrated average temperature of the Earth. While most
Ž .
deep convection is at lower latitudes, Angell 1992 finds high correlation between radiosonde temperatures in the tropics and extratropical latitudes leading to the
conclu-.
sion that tropical temperature variation is globally representative. Satellite observations are subject to errors due to clouds, water vapor and other meteorological factors. Also, their instruments cannot measure surface temperatures in regions with clouds, the areas of most interest. The temperature records show significant short-term variations which
may be affected by data collecting procedures. Monitoring V variation may provide anI
independent parameter for comparison with temperature measurements both on the
short-term as well as trends over decades. To obtain one globally representative VI
measurement requires only a single sounding which can be obtained by two people in an hour. The measurement is available in close to real time.
Ž
The initial study of satellite cloud imagery compared to VI variation, Markson,
.
1986 concluded that ‘‘V time-series at just one location may provide a high-resolutionI measure of intense tropical convection’’. Subsequent studies support this concept.
Ž .
Williams 1992 reported an extremely nonlinear increase in tropical lightning rate when temperature rose above a critical threshold. This indicates a similar nonlinear sensitivity of thunderstorm activity to temperature. He also reported high correlation between monthly mean tropical surface air temperature and Schumann resonance
Ž .
measurements of global lightning activity. Williams 1994 continued analysis of global circuit response to global temperature variation and found both annual and semi-annual
Ž .
variations. He reports a 18C 1r3% increase in temperature results in a 10% increase in global lightning frequency.
Ž .
Due to the lack of global lightning observations, Price and Rind 1992 developed an inferred index of global lightning activity using readily available satellite cloud data
Ž . Ž .
from the International Satellite Cloud Climatology Project ISCCP . Price 1993
showed that global lightning frequency increased with satellite-derived global tempera-ture. He suggested that a 1% increase in global surface temperature could result in a 20% increase in V .I
The initial report of an ongoing program to investigate the relationship of V toI
Ž .
global temperature was by Markson and Lane-Smith 1994 . Using radiosonde balloons,
31 electric field soundings of V were obtained in August and September 1992. It wasI
found that global temperature data from low latitudes correlated well with the VI
Americas. In this period, thunderstorms from the Americas were the major contributor to the global generator. Lag analysis shows the correlation coefficient maximized for the temperature 2 h before the soundings. This is probably due to the time delay between maximum heating and maximum thunderstorm activity. An important factor in the time delay between heating and convective cloud development is that the outflows from the first storms trigger subsequent storms over a wider area.
2. Measurements and data analysis
Three global temperature data sets were utilized in the study reported here. The
Ž .
ISCCP data uses infrared IR measurements from several satellites. Surface tempera-tures from noncloudy pixels are used. Another data set is from the TIROS Operational
Ž .
Vertical Sounder TOVS using polar orbiting satellites employing a combination of IR sensing and microwave sounding systems. As with ISCCP data, surface temperatures are derived from blackbody radiances in clear areas. Only one global temperature is
Ž .
provided for each day. The National Meteorological Center NMC data set consists of in situ thermometer readings at ground stations. These data are biased toward mid-lati-tudes in the Northern Hemisphere where most of the stations are located.
Ž .
The Inferred Global Lightning Index was derived by Price and Rind 1992 from ISCCP data by quantifying the clouds with optical depth greater than 23 above 440 mb. It assumes that lightning frequency over the ocean is proportional to the 1.7 power of
Ž .
cloud height derived from cloud top temperature and over land, the frequency is proportional to the 4.9 power. Thus, this index is basically a measure of theÕariation of deep continental conÕection. The index has a time resolution of 3 h, the resolution of the ISCCP data.
The V data have been obtained by Markson during a dozen field programs starting inI
Ž
1971 which have been continued at irregular intervals until the present Markson, 1976;
.
Markson, 1985; Markson and Lane-Smith, 1994; Markson et al., 1996 . The measure-ments analyzed here were for the period when the earliest ISCCP temperature data became available in July 1983 extending through 1990. They include 69 measurements on 29 different days. The first 56 soundings were made with aircraft, the last 13 were made with balloons.
3. Results and discussion
3.1. Ionospheric potential–inferred global lightningrdeep cloud relationship
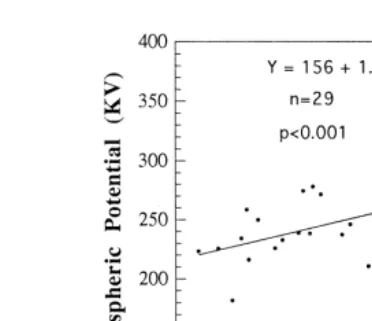
Fig. 1 illustrates the relationship between the global lightningrdeep cloud index and V data on 29 days between July 1983 and September 1990. The Global Lightning IndexI data used are only for 1500 LST at all global locations since this is the time of
Ž .
maximum convection. The correlation coefficient is 0.59 p-0.001 . This is to be
Fig. 1. The relationship between ionospheric potential measured at a single location and a globally integrated lightning index derived from deep, mostly continental clouds. When more than one ionospheric potential measurement was made on a given day, these data were averaged.
3.2. Ionospheric potential–global temperature relationship
In order to insure data independence, only measurements that were separated from
each other by at least 5 days were utilized. This reduced the available number of VI
observations; however, as shown in Fig. 2a–c, significant positive correlations exist. These figures resulted from analysis of the three different data sets described earlier. Fig. 2a utilizes the ISCCP data, Fig. 2b is for the TOVS data, and Fig. 2c is for the NMC surface data. In each case, V shows a similar sensitivity to temperature with eachI independent data set. A one degree warming corresponds to about a 13 kV increase in
Ž .
Fig. 2. The relationship between ionospheric potential and global surface temperatures derived from a ISCCP
Ž . Ž .
Ž .
V . Put differently, the sensitivity is such that a 1% increase in temperature 3I 8C
Ž .
corresponds to about a 15% 33 kV increase in V .I
Ž .
This result can be compared with the estimate of Price 1993 that a 1% change in
global temperature would cause a 20% change in V . At this time, we are uncertainI
regarding the precision of V measurements and airplane measurements appear to beI
Ž .
more reliable than those made from balloons see companion paper in this volume . It is
Ž .
estimated that aircraft data have a precision of better than qry5% Markson, 1985
and balloon data should be aboutqry5% under favorable meteorological conditions.
Ž .
Assumingqry5% precision, this would translate to 1r3% uncertainty 18C in global
temperature. This precision can be applied to short-term temperature variations. The literature on global warming has focused on long-term variations so the various sources of fluctuations are filtered out. It is unclear what sort of resolution is possible from the existing satellite and surface data collection methods for short-term monitoring of global
temperature, but it seems possible that the real time high precision of V -inferredI
observations may be useful for forecasting and weather research. For example, a large volcano could have a rapid effect on global temperature which could be observed with V measurements. The volcanic aerosol would affect satellite-derived surface tempera-I ture data and its possible affect on the global circuit would also have to be considered. This could be measured.
There are several advantages in being able to monitor global temperature variation indirectly through changes in the global circuit. The literature contains numerous discussions on the limitations and sources of error in surface measurements. The tropics, the region of particular interest for global change studies, is undersampled compared to mid-latitudes. The number of stations reporting surface temperatures on a given day vary from 1000 to 6000. These data must be obtained and transmitted to central repositories for analysis and subsequent dissemination. Satellites may provide a better way of observing global temperature variation than surface thermometer measurements because they sample the Earth more uniformly, but they have their own sources of error.
Acknowledgements
This work was supported in part by the National Science Foundation under Grant No. DMI-9304487, ‘New Technology for Monitoring Global Change’.
References
Angell, J., 1992. Personal communication. NOAArClimatic and Global Change Program. Silver Spring, MD.
Ž .
Clark, J.F., 1958. The fair-weather atmospheric electrical potential and its gradient. In: Smith, L.G. Ed. , Recent Advances in Atmos. Elect. Pergamon, NY, pp. 61–74.
Markson, R., 1976. Ionospheric potential variations obtained from aircraft measurements of potential gradient. J. Geophys. Res. 81, 1980–1990.
Markson, R., 1986. Tropical convection, ionospheric potentials and global circuit variation. Nature 320, 588–594.
Markson, R., Lane-Smith, D.R., 1994. Global change monitoring through the temporal variation of ionospheric potential. In preprint volume, Fifth Symposium on Global Change Studies and the Symposium on Global Electrical Circuit, Global Change and the Meteorological Applications of Lightning Information, Ann. Meeting AMS, Nashville, TN, Jan. 1994, Am. Meteor. Soc., Boston, pp. 279–287.
Markson, R., Ruhnke, L.H., Williams, E.R., 1996. Global scale comparison of simultaneous ionospheric potential measurements. Proc. 10th Conf. on Atmos. Elect., Osaka, Japan.
Muhleisen, R.P., 1971. New determination of air-earth current over the ocean and measurements of¨
ionospheric potentials. Pure Appl. Geophys. 84, 112–117.
Price, C., 1993. Global surface temperatures and the atmospheric electrical global circuit. Geophys. Res. Lett. 20, 1363–1366.
Price, C., Rind, D., 1992. A simple lightning parameterization for calculating global lightning distributions. J. Geophys. Res. 97, 9919–9933.
Williams, E.R., 1992. The Schumann resonance: a global tropical thermometer. Science 256, 1184–1187. Williams, E.R., 1994. Global circuit response to seasonal variations in global surface air temperature. Mon.