NEW MICROWAVE-BASED MISSIONS APPLICATIONS FOR RAINFED CROPS
CHARACTERIZATION
N. Sánchez a,b, J. M. Lopez-Sanchez c, B. Arias-Pérez b, R. Valcarce-Diñeiro b , J. Martínez-Fernández a, J. M. Calvo-Heras a, A. Camps d, A. González-Zamora a, F. Vicente-Guijalba c
a CIALE, Universidad de Salamanca, Duero 12, 37185 Villamayor, Salamanca, Spain - (nilda, gheras, jmf, aglezzamora)@usal.es b Departamento de Ingeniería Cartográfica y del Terreno, Hornos Caleros 50, 05003 Ávila, Spain - (benja, ruben.v.d)@usal.es
c IUII, Universidad de Alicante, P.O. Box 99, E-03080 Alicante, Spain - (Juanma.Lopez, fernando.vicente)@ua.es d Universitat Politècnica de Catalunya–BarcelonaTech, Department of Signal Theory
and Communications (TSC), Jordi Girona 1-3, 08034 Barcelona, Spain - [email protected]
Commission I, WG I/2
KEY WORDS: Radar, crops, Landsat 8, Radarsat-2, GNSS-R
ABSTRACT:
A multi-temporal/multi-sensor field experiment was conducted within the Soil Moisture Measurement Stations Network of the University of Salamanca (REMEDHUS) in Spain, in order to retrieve useful information from satellite Synthetic Aperture Radar (SAR) and upcoming Global Navigation Satellite Systems Reflectometry (GNSS-R) missions. The objective of the experiment was first to identify which radar observables are most sensitive to the development of crops, and then to define which crop parameters the most affect the radar signal. A wide set of radar variables (backscattering coefficients and polarimetric indicators) acquired by Radarsat-2 were analyzed and then exploited to determine variables characterizing the crops. Field measurements were fortnightly taken at seven cereals plots between February and July, 2015. This work also tried to optimize the crop characterization through Landsat-8 estimations, testing and validating parameters such as the leaf area index, the fraction of vegetation cover and the vegetation water content, among others. Some of these parameters showed significant and relevant correlation with the Landsat-derived Normalized Difference Vegetation Index (R>0.60). Regarding the radar observables, the parameters the best characterized were biomass and height, which may be explored for inversion using SAR data as an input. Moreover, the differences in the correlations found for the different crops under study types suggested a way to a feasible classification of crops.
1. INTRODUCTION
The consolidated Earth observing remote sensing missions, such as the Sentinel at the Copernicus programme from the
European Space Agency (ESA), coexist with new,
experimental, and sometimes low cost missions, which need to be validated and tested. Among them, a new family of satellites based on the Global Navigation Satellite Systems Reflectometry (GNSS-R) have been explored, such as the upcoming satellite missions CYGNSS from NASA (launch October 2016), and 3Cat-2 (launch foreseen in July 2016), a 6-unit nano-satellite mission (~10 cm x 20 cm x 30 cm) developed at the Universitat Politècnica de Catalunya Barcelona Tech (UPC), Spain. While CYGNSS will measure Delay-Doppler Maps at GPS L1 and C/A code, 3Cat-2 will use the multi-constellation (GPS, Galileo and Glonass), dual-band (L1&L2), and dual-polarization (RHCP&LHCP) PYCARO GNSS-R receiver. The application of the GNSS-R technique for soil moisture monitoring (Egido et al., 2012; Katzberg et al., 2006; Rodriguez-Alvarez et al., 2011, Camps et al., 2016), and vegetation estimations (Egido et al., 2014; Guerriero et al., 2013; Sánchez et al., 2015) is a challenging and open issue.
So far, only the TechDemoSat-1 satellite (SSTL, 2016) is collecting routinely GNSS-R data. Recent studies (Camps et al., 2016) showed the sensitivity of TechDemoSat-1 GNSS-R data to soil moisture at global scale over different types of surfaces, and for a wide range of values of the normalized difference vegetation index (NDVI). Over bare soils, the sensitivity to soil moisture was found to be as high as ~38 dB/(m3/m3), with a
high Pearson correlation, R = 0.63. The presence of vegetation attenuates the GNSS signals, but there is still sensitivity to soil moisture.
Conversely, recent radar-based missions, like Radarsat-2, Sentinel-1 and TanDEM-X are being explored for soil and vegetation estimations taking advantage of their polarimetric and interferometric capabilities for agriculture. The use of SAR polarimetry (PolSAR) in agriculture applications is based on the known sensitivity of microwaves to crop structure (size, shape, and orientation of leaves, stalks, and fruits), dielectric properties of the canopy (related to the water content), and the physical properties of the underlying soil (roughness and moisture). Crop structure and plant water content vary as a function of crop type, growth stage and crop condition. Consequently, different crops types, or the same type at different growth stages, produce different polarimetric signatures which can be identified in the acquired images and used to establish classification algorithms. Moreover, the dependence of PolSAR observables on scene characteristics can be exploited to estimate physical parameters of interest, such as soil moisture, plant water content and biomass (Lopez-Sanchez and Ballester, 2009; McNairn and Brisco, 2004).
field campaigns needed to validate and test the backscatter or reflectometry from other sources. Thus, the first objective of this work is to optimize the crop characterization through Landsat-8 and Moderate Resolution Imaging Spectroradiometer (MODIS) images, testing and validating parameters such as the leaf area index, the fraction of vegetation cover and the percentage of water content, among others, as well as its phenological stage. Besides, the main objective is to quantify and assess the temporal variation of Synthetic Aperture Radar (SAR) measurements over cereal and pasture fields. Thus, the sensitivity of radar observables to the development of crops is analyzed, and then the crop parameters the most impact the radar signal were defined. The potential biophysical information to be retrieved, such as growth conditions, growing stage and water content is of the main interest in crop monitoring and yield prediction.
2. DATA AND METHODS
2.1 Study area
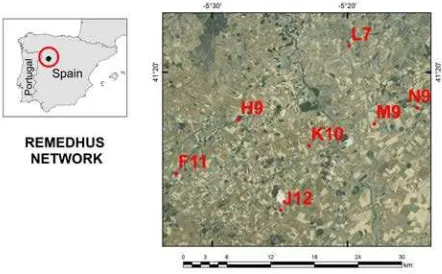
The field campaign took place during the growing season of 2015 for rainfed crops (February to June, 2015) in the central part of the Iberian Peninsula, located in the Duero basin (Figure 1). The measurements were taken fortnightly (n=9). In this area the Soil Moisture Stations Network of the University of Salamanca, REMEDHUS (Sánchez et al., 2012b) has been providing soil moisture and other agro-climatic data used in remote sensing and modeling applications, such as validation of active and passive missions (Brocca et al., 2011; González-Zamora et al., 2015; Petropoulos et al., 2014; Wagner et al., 2008). The area is mainly agricultural, with continental semi-arid Mediterranean climate. Taking this network as reference, the field measurements took place in seven plots where the REMEDHUS stations were installed, namely J12, K10 and L7 (wheat), F11 and M9 (barley), N9 (rye) and H9 (natural pasture). These crops are the most frequent in the area, being approximately 80% (Sánchez et al., 2010).
Figure 1. Study area and selected REMEDHUS stations.
2.2 Field measurements
The protocol of estimations followed that described in Sánchez et al. (2012a). Vegetation samples were collected over a frame of 1 m2. Average height was measured and the phenological stage was estimated. Zenithal photographs were taken for the subsequent estimation of the Fraction of Vegetation Cover (FVC). Leaf Area Index (LAI), fresh (biomass) and dry weights, vegetation water content (VWC), and percentage of water content (PWC, the relation in % between VWC and
biomass) were estimated at the laboratory. The
photosynthetically active leaves were extracted from the sample, and then scanned and scaled to retrieve the LAI. VWC was estimated as the difference between wet and dry weights (after been dried in an oven at 70ºC for at least 24 h) considering the total amount of water in the stems and leaves. Finally, FVC was estimated from the digital photographs using a supervised classification routine. Soil moisture measurements from the REMEDHUS stations were also collected with the Hydra Probes Soil Sensors (Stevens® Water Monitoring System Inc.) installed at 5 cm depth in each plot.
2.3 Optical imagery
Landsat 8 scenes were collected between February and July. The Landsat scenes were provided at Level 1T, geometrically and terrain corrected. Ground reflectance was retrieved using atmospheric correction with the module ATCOR of PCI Geomatics 2014 (Richter et al., 2006), applying the file metadata. As a well-known and widely used index, the Normalized Difference Vegetation Index (NDVI) was used in the present study as a reference of the vegetation greenness and vigor (Rouse et al., 1974).
February-16 March-16 April-16 May-16 May-16 June-16
Field measurement Landsat MODIS Radarsat-2
Figure 2. Correspondence between field measurements and imagery acquisition dates.
Owing the presence of clouds, several images were discarded, and finally only five scenes were useful (Figure 2). To fill the gap, the MODIS NDVI 16 days and 250 m resolution, MOD13Q1 product was included (4 dates).
2.4 Radar imagery
Twenty Radarsat-2 Fine Quad-Pol images acquired with incidence angles of 26, 31 and 36 degrees were acquired over the study area between February and July 2015 (Figure 2). Azimuth and range resolutions are 5 m approximately for all of them. The processing was carried out using open source software developed by ESA, the Sentinel-1 Toolbox. Each image was radiometrically calibrated, and then the coherency matrix T3 was generated for each pixel in the image. A 9 x 9 boxcar filter was used to reduce speckle noise. Finally, a geometric correction was applied to orthorectify the images. After processing the images, PolSARpro was used to obtain SAR observables.
2.5 SAR observables
stronger attenuation for VV than for HH (Lopez-Sanchez et al., 2012).
The phase difference between HH and VV, also known as polarisation phase difference (PPD), is different from zero in some agricultural scenes due to the interaction between stems and ground and it has been analysed for rice (Lopez-Sanchez et al., 2012; Lopez-Sanchez et al., 2014) and other crops (Lopez-Sanchez et al., 2013). The normalised correlation (coherence) between HH and VV (γhhvv) is also sensitive to the scene properties. It is very high (close to 1) when the scattering is dominated by surface scattering, e.g. at the early stages.
The coherence between the first and the second Pauli channels
(γP1P2), HH+VV and HH-VV, was already analysed in previous research (Lopez-Sanchez et al., 2012; Lopez-Sanchez et al., 2013) for the identification of phenological stages of rice fields. To exploit the information contained in the fully polarimetric data set provided by Radarsat-2, we have also employed two parameters derived from eigenvalue/vector decomposition (entropy and α1), which have been used before in crop monitoring studies (Lopez-Sanchez et al., 2012; Lopez-Sanchez et al., 2013; Lopez-Sanchez et al., 2014). The dominant alpha
angle (α1) is extracted from the first eigenvector.
3. RESULTS AND DISCUSSION
3.1 Vegetation growing cycle
The height evolution (Figure 3) showed a similar growth pattern for wheat, pasture and barley (excepting F11, with some delay), with maxima at the beginning of May maintained until the senescence. The rye (N9) is much higher than the rest of covers.
For the FVC (Figure 4), the higher density was for the pasture (H9), keeping high values since winter. It should be taken into account this is a natural pasture with annual cycle. On the contrary, the cereals showed an increasing curve until reaching the maxima around the first May, plateau-shaped in the case of the rye and wheat, and with a peak for the barley.
The LAI evolution (Figure 5) showed the highest values for the pasture, in concordance with the FVC, owing its dense coverage. The barley showed the smaller LAI and a slight delay in comparison to wheat and rye, which early started, especially rye.
01/02/2015 01/03/2015 01/04/2015 01/05/2015 01/06/2015
H
Wheat (J12, L7, K10) Rye (N9)
Barley (F11, M9) Pasture (H9)
Figure 3. Height evolution for the seven plots clustered by type of crop.
01/02/2015 01/03/2015 01/04/2015 01/05/2015 01/06/2015
F
V
C
(
%)
Wheat (J12, L7) Rye (N9)
Barley (F11, M9) Pasture (H9)
Figure 4. FVC evolution for the seven plots clustered by type of crop. K10 is not shown.
01/02/2015 01/03/2015 01/04/2015 01/05/2015 01/06/2015
L
Wheat (J12, L7, K10) Rye (N9)
Barley (F11, M9) Pasture (H9)
Figure 5. LAI evolution for the seven plots clustered by type of crop.
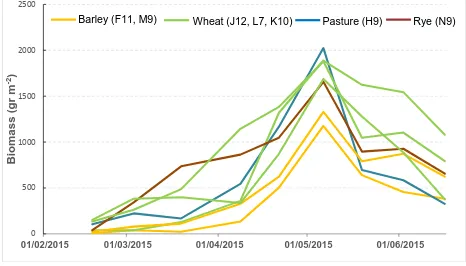
The biomass results (Figure 6) were the most homogeneous among covers and dates. All curves exhibited a similar pattern. The highest biomass (ranging from 1 kg m-2 to 2 kg m-2) corresponded to the pasture area, followed by wheat, rye and barley. The biomass evolution typically represents the curve of crop growth and has similarities with the biomass evolution.
0
01/02/2015 01/03/2015 01/04/2015 01/05/2015 01/06/2015
B
Wheat (J12, L7, K10) Rye (N9)
Barley (F11, M9) Pasture (H9)
Figure 6. Biomass evolution for the seven plots clustered by type of crop.
smallest PWC corresponded to the wheat, which conversely showed the highest development in terms of LAI (Figure 5) and biomass (Figure 6), suggesting a more efficient fresh biomass production for this crop.
20 40 60 80 100
01/02/2015 01/03/2015 01/04/2015 01/05/2015 01/06/2015
P
W
C
(
%)
Wheat (J12, L7, K10) Rye (N9)
Barley (F11, M9) Pasture (H9)
Figure 7. PWC evolution for the seven plots clustered by type of crop.
01/01/2015 01/02/2015 01/03/2015 01/04/2015 01/05/2015 01/06/2015
P
Figure 8. Soil moisture evolution for the seven plots clustered by type of crop. Precipitation data is also shown.
3.2 NDVI and field measurements relationships
In the time evolution of the NDVI (Figure 9), three phases can be distinguished, crop development, mid-season and late (maturity and senescence). The characteristic plateau stage of the NDVI curve corresponding to the middle phase (when the growth rate keeps constant) is typically longer for well-watered crops (Calera et al., 2004), in this case corresponding to the pasture plot. For the rye and wheat, this plateau was shorter, showing a peak in the case of the barley. Comparing to LAI and biomass (Figure 5 and 6), a certain delay with respect the NDVI was detected, more pronounced for the biomass. This time lag represents the time required for green photosynthetic tissue to accumulate biomass in all plant tissues (Wang et al., 2005). The NDVI increase begins earlier than the effective development of leaves and biomass. For this reason, NDVI is commonly integrated over weeks, or part of the growing season (also as a whole) to estimate yield or biomass.
The range of NDVI values agreed well with the FVC, LAI and biomass, i.e., the smaller rates correspond to the barley plots, followed by rye, wheat and pasture, as also occurred for FVC, LAI and biomass (Figures 4, 5, and 6).
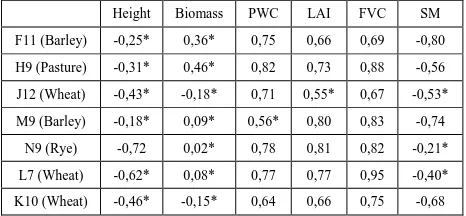
The correlation between NDVI and field estimations (Table 1) afforded poor results for the comparison with height and biomass. However, for the rest of estimations, the correlations are encouraging, especially for PWC, LAI and FVC. These parameters are crucial in the active microwave estimations,
while masking or attenuating the signal reflected coherently and thus introducing incoherent scattering (Ferrazzoli et al., 2011). Thus, this proved relationship with the NDVI suggests a possible inclusion in the retrieval algorithms using radar or GNSS-R signals, as did, for example, in the SMAP soil moisture algorithm including the NDVI for vegetation correction, which resulted in robust and stable soil moisture retrievals (Entekhabi et al., 2010).
Unexpectedly, acceptable correlations took place between NDVI and soil moisture in four plots, even though it was observed that the response of the vegetation to the soil moisture content suffers from a lag, varying in the literature from several days to several months (Li et al., 2014; Schnur et al., 2010; Thenkabail et al., 2004). The negative correlations indicate the inverse relationship between the vigor and the soil water content, since the plants consume most soil moisture during the growing season.
01/01/2015 01/02/2015 01/03/2015 01/04/2015 01/05/2015 01/06/2015
NDV
I
Wheat (J12, L7, K10) Rye (N9)
Barley (F11, M9) Pasture (H9)
Figure 9. NDVI evolution for the seven plots
Height Biomass PWC LAI FVC SM
Table 1. Correlation (R Pearson) between field estimations and NDVI. Non-significant correlations at 95% confidence level are
indicated by *.
3.3 Radar estimations and field measurements relationships
The correlation between PPD and biophysical variables provided good results for wheat (J12, Table 2 and L7, Table 3), barley (M9, Table 6) and pasture (H9, Table 7), especially for height, biomass and LAI.
SAR
Observables Height Biomass PWC LAI FVC SM
α1 0.74 0.90 -0.17* 0.80 0.74 -0.42*
H 0.46* 0.51* -0.16* 0.56* 0.70 -0.38*
HH 0.43* 0.35* -0.49* -0.11* -0.26* 0.15*
HH/VV 0.73 0.92 -0.13* 0.83 0.77 -0.49*
γhhvv -0.69 -0.79 0.26* -0.69 -0.67 0.31*
HV 0.33* 0.38* -0.18* 0.20* 0.18* -0.18*
HV/VV 0.49* 0.73 0.12* 0.87 0.91 -0.60*
γP1P2 0.75 0.94 -0.16* 0.79 0.71 -0.46*
PPD 0.71 0.43* -0.88 -0.35* -0.27* 0.01*
VV -0.36* -0.57* -0.20* -0.79 -0.84 0.53*
Table 2. Correlation (R Pearson) between SAR observables and field estimations for J12 (wheat). Non-significant correlations at
95% confidence level are indicated by *.
SAR
Observables Height Biomass PWC LAI FVC SM
α1 0.61* 0.84 -0.19* 0.36* -0.03* -0.40*
H 0.50* 0.78 -0.10* 0.45* 0.18* -0.83
HH 0.39* -0.18* -0.43* -0.62* -0.75 -0.04*
HH/VV 0.57* 0.89 -0.13* 0.49* 0.06* -0.40*
γhhvv -0.55* -0.89 0.10* -0.44* -0.11* 0.58*
HV 0.56* 0.23* -0.30* -0.30* -0.48* -0.81
HV/VV 0.51* 0.90 -0.02* 0.57* 0.22* -0.67
γP1P2 0.68 0.78 -0.37* 0.30* -0.18* -0.20*
PPD 0.77 0.47* -0.62* -0.18* -0.54* -0.28*
VV -0.25* -0.82 -0.13* -0.75 -0.47* 0.30*
Table 3. Correlation (R Pearson) between SAR observables and field estimations for L7 (wheat). Non-significant correlations at
95% confidence level are indicated by *.
SAR Observables Height Biomass PWC LAI FVC SM
α1 0.53* 0.87 -0.10* 0.48* -0.03* -0.28*
H 0.02* 0.48* 0.31* 0.54* 0.16* -0.20*
HH 0.16* 0.25* -0.03* -0.14* -0.38* 0.15*
HH/VV 0.60* 0.89 -0.15* 0.52* -0.05* -0.32*
γhhvv -0.39* -0.78 0.00* -0.50* 0.04* 0.21*
HV -0.26* 0.17* 0.51* 0.21* 0.12* 0.02*
HV/VV 0.14* 0.67* 0.33* 0.67 0.31* -0.32*
γP1P2 0.70 0.87 -0.30* 0.40* -0.11* -0.29*
PPD -0.02* -0.39* -0.30* -0.52* -0.46* 0.13*
VV -0.41* -0.58* 0.11* -0.55* -0.24* 0.38*
Table 4. Correlation (R Pearson) between SAR observables and field estimations for K10 (wheat). Non-significant correlations
at 95% confidence level are indicated by *.
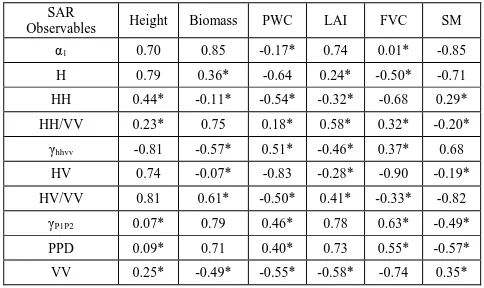
The correlation coefficient for γhhvv was very high with biomass for all crops. In this case the negative sign is a consequence of the opposite behaviour of this coherence, which is high in presence of surface scattering and low in presence of a
vegetation volume. For pasture, instead, it was better correlated with height than with biomass.
The coherence between the two first Pauli channels, γP1P2, showed high correlations with biomass for wheat (J12, L7, K10), barley (M9) and pasture (H9), as well as with height and LAI for wheat, barley and pasture.
SAR
Observables Height Biomass PWC LAI FVC SM
α1 0.52* 0.86 0.13* 0.73 0.74 -0.43*
H 0.42* 0.85 0.23* 0.81 0.82 -0.40*
HH -0.07* -0.08* -0.26* -0.12* -0.11* 0.22*
HH/VV 0.80 0.58* -0.23* 0.19* 0.21* -0.45*
γhhvv -0.45* -0.85 -0.22* -0.78 -0.78 0.44*
HV 0.25* 0.75 0.15* 0.75 0.76 -0.24*
HV/VV 0.47* 0.88 0.21* 0.80 0.81 -0.44*
γP1P2 0.26* -0.13* -0.51* -0.38* -0.36* 0.15*
PPD 0.06* -0.25* -0.43* -0.28* -0.28* 0.39*
VV -0.39* -0.31* -0.11* -0.17* -0.18* 0.37*
Table 5. Correlation (R Pearson) between SAR observables and field estimations for F11 (barley). Non-significant correlations
at 95% confidence level are indicated by *.
SAR
Observables Height Biomass PWC LAI FVC SM
α1 0.89 0.91 -0.22* 0.53* 0.50* -0.44*
H 0.88 0.92 -0.38* 0.55* 0.49* -0.50*
HH 0.31* 0.21* -0.11* -0.15* -0.26* 0.08*
HH/VV 0.87 0.99 -0.31* 0.58* 0.45* -0.49*
γhhvv -0.90 -0.93 0.32* -0.55* -0.50* 0.42*
HV 0.76 0.71 -0.24* 0.27* 0.17* -0.40*
HV/VV 0.86 0.92 -0.27* 0.58* 0.52* -0.64*
γP1P2 0.91 0.88 -0.43* 0.30* 0.16* -0.21*
PPD 0.62* 0.71 -0.19* 0.58* 0.56* 0.03*
VV -0.07* -0.22* 0.02* -0.40* -0.46* 0.30*
Table 6. Correlation (R Pearson) between SAR observables and field estimations for M9 (barley). Non-significant correlations
at 95% confidence level are indicated by *.
SAR
Observables Height Biomass PWC LAI FVC SM
α1 0.70 0.85 -0.17* 0.74 0.01* -0.85
H 0.79 0.36* -0.64 0.24* -0.50* -0.71
HH 0.44* -0.11* -0.54* -0.32* -0.68 0.29*
HH/VV 0.23* 0.75 0.18* 0.58* 0.32* -0.20*
γhhvv -0.81 -0.57* 0.51* -0.46* 0.37* 0.68
HV 0.74 -0.07* -0.83 -0.28* -0.90 -0.19*
HV/VV 0.81 0.61* -0.50* 0.41* -0.33* -0.82
γP1P2 0.07* 0.79 0.46* 0.78 0.63* -0.49*
PPD 0.09* 0.71 0.40* 0.73 0.55* -0.57*
VV 0.25* -0.49* -0.55* -0.58* -0.74 0.35*
Table 7. Correlation (R Pearson) between SAR observables and field estimations for H9 (pasture). Non-significant correlations
at 95% confidence level are indicated by *.
Entropy was found to be highly correlated with biomass for
high correlations with most biophysical parameters, and especially with height and biomass. This behaviour comes from the gradual change in the scattering mechanisms that dominate the radar response from crops along their growth, starting from surface scattering and moving towards volume scattering and then, at the end, going down again due to the reduced contribution from the plants. Based in this principle, alpha alngle was used by Lopez-Sanchez et al. (2013) to estimate the phenological stage of several cereals.
SAR
Observables Height Biomass PWC LAI FVC SM
α1 0.51* 0.92 -0.25* 0.19* 0.40* -0.08*
H 0.58* 0.78 -0.55* 0.38* 0.26* -0.31*
HH 0.59* 0.11* -0.53* -0.67 -0.61* -0.38*
HH/VV 0.63* 0.78 -0.31* -0.07* 0.26* -0.20*
γhhvv -0.56* -0.91 0.40* -0.30* -0.36* 0.14*
HV 0.64* 0.39* -0.72 -0.15* -0.39* -0.54*
HV/VV 0.65* 0.92 -0.45* 0.28* 0.37* -0.32*
γP1P2 0.52* 0.64* -0.18* -0.07* 0.28* -0.13*
PPD 0.40* 0.64* -0.34* -0.11* 0.03* 0.05*
VV -0.20* -0.70 -0.08* -0.43* -0.72 -0.08*
Table 8. Correlation (R Pearson) between SAR observables and field estimations for N9 (rye). Non-significant correlations at
95% confidence level are indicated by *.
4. CONCLUSIONS
The main phenological stages of the plants could be tracked through the NDVI evolution, even though a time lag is observed between NDVI response and biomass production. Thus, it is recommended to apply a certain time lag on the application of NDVI to estimate yield-related parameters (e.g., biomass). The PWC, LAI and FVC showed a relevant correlation with the NDVI (R>0.60), suggesting a potential synergy with the microwave active observations to account for the vegetation effects on the backscattered signal.
Among the wide set of radar observables analysed in this work, the most significant results are provided by the ratios of backscattering coefficients (HV/VV and HH/VV), the coherence between the copolar channels and between the first two Pauli channels, and the dominant alpha angle. It is shown that biomass is the biophysical variable better correlated with more radar variables, followed by vegetation height. The differences in the correlations found for different crop types could be used for classification purposes, whereas the correlations themselves will be explored for inversion of biophysical variables using SAR data as an input.
The results pave the way for future crops estimations using synergetic GNSS-R and radar observations with optical imagery.
ACKNOWLEDGEMENTS
This study was supported by the Spanish Ministry of Economy and Competitiveness, MINECO (Projects AYA2012-39356-C05, ESP2015-67549-C3-3 and TIN2014-55413-C2-2-P), the European Regional Development Fund, FEDER, and the European Community Seventh Framework Programme (FP7-Space-2013-1, Project E-GEM-ID 607126). The Fundación
Memoria D. Manuel Solórzano Barruso of the University of Salamanca funded the field campaign.
RADARSAT-2 Data and Products @ MacDonald, Dettwiler and Associates Ltd. (MDA, 2015) – All Rights Reserved. RADARSAT is an official trademark of the Canadian Space Agency (CSA). All RADARSAT-2 images have been provided by MDA and CSA in the framework of the SOAR-EU2 Project ref. 16375.
REFERENCES
Brocca, L., Hasenauer, S., Lacava, T., Melone, F., Moramarco, T., Wagner, W., Dorigo, W.A., Matgen, P., Martínez-Fernández, J., Llorens, P., Latron, J., Martin, C., Bittelli, M., 2011. Soil moisture estimation through ASCAT and AMSR-E sensors: an intercomparison and validation study across Europe.
Remote Sens. Environ., 115, pp. 3390-3408.
Calera, A., González-Piqueras, J., Meliá, J., 2004. Monitoring barley and corn growth from remote sensing data at field scale.
Int. J. Remote Sens., 25, pp. 97-109.
A. Camps, H. Park, M. Pablos, G. Foti, C. Gommenginger, Pang-Wei Liu, J. Judge, Soil Moisture and Vegetation Impact in GNSS-R TechDemoSat-1 Observations, 2016 International
Geoscience and remote sensign symposium, Beijing, China,
July 10-15, 2016.
Egido, A., Caparrini, M., Ruffini, G., Paloscia, S., Santi, E., Guerriero, L., Pierdicca, N., Floury, N., 2012. Global Navigation Satellite Systems Reflectometry as a remote sensing tool for agriculture. Remote Sens., 4, pp. 2356-2372.
Egido, A., Paloscia, S., Motte, E., Guerriero, L., Pierdicca, N., Caparrini, M., Santi, E., Fontanelli, G., Floury, N., 2014. Airborne GNSS-R polarimetric measurements for soil moisture and above-ground biomass stimation. IEEE J. Sel. Top. Appl., 7, pp. 1522-1532.
Entekhabi, D., Njoku, E., O’Neill, P.E., Kellogg, K.H., Crow, W.T., Edelstein, W.N., Entin, J.K., Goodman, S.D., Jackson, T., Johnson, J., Kimball, J., Piepmeier, J.R., Koster, R.D., Martin, N., McDonald, K.C., Moghaddam, M., Moran, S., Reichle, R., Shi, J.C., Spencer, M.W., Thurman, S.W., Tsang, L., Van Zyl, J., 2010. The Soil Moisture Active Passive (SMAP) mission.
Proceedings of the IEEE, 98, pp. 704-716.
Ferrazzoli, P., Guerriero, L., Pierdicca, N., Rahmoune, R., 2011. Forest biomass monitoring with GNSS-R: theoretical simulations. Advances in Space Research, 47, pp. 1823-1832.
González-Zamora, A., Sanchez, N., Martínez-Fernández, J., Gumuzzio, A., Piles, M., Olmedo, E., 2015. Long-term SMOS soil moisture products: a comprehensive evaluation across scales and methods in the Duero Basin (Spain). Phys. Chem.
Earth, 83-84, pp. 123–136.
Guerriero, L., Pierdicca, N., Pulvirenti, L., Ferrazzoli, P., 2013. Use of satellite radar bistatic measurements for crop monitoring: a simulation study. Remote Sens., 5, pp. 864-890.
reflectivity and dielectric constant: Results from SMEX02.
Remote Sens. Environ., 100, pp. 17-28.
Larrañaga, A., Alvarez-Mozos, J., Albizua, L., Peters, J., 2013. Backscattering behavior of rain-fed crops along the growing season. IEEE Trans. Geosci. Remote Sens. Letters, 10, pp. 386-390.
Li, R., Tsunekawa, A., Tsubo, M., 2014. Index-based assessment of agricultural drought in a semi-arid region of Inner Mongolia, China. J. Arid Land, 6, pp. 3-15.
Lopez-Sanchez, J.M., Ballester, J.D., 2009. Potentials of Polarimetric SAR Interferometry for Agriculture Monitoring.
Radio Sci., 44, pp. RS2010.
Lopez-Sanchez, J.M., Cloude, S.R., Ballester-Berman, J.D., 2012. Rice phenology monitoring by means of SAR polarimetry at X-band. IEEE Trans. Geosci. Remote Sens., 50, pp. 2695-2709.
Lopez-Sanchez, J.M., Vicente-Guijalba, F., Ballester-Berman, J.D., 2013. Estimating phenology of agricultural crops from space. In Proceedings of the ESA living planet symposium, vol. ESA-SP 722, Edinburgh, UK., September 2013.
Lopez-Sanchez, J.M., Vicente-Guijalba, F., Ballester-Berman, J.D., Cloude, S.R., 2014. Polarimetric response of rice fields at C-band: analysis and phenology retrieval. IEEE Trans. Geosci.
Remote Sens., 52, pp. 2977-2993
McNairn, H., Brisco, B., 2004. The application of C-band polarimetric SAR for agriculture: a review. Can. J. Remote
Sens., 30, pp. 525-542.
Moran, S.M., Alonso, L., Moreno, J.F., Cendrero Mateo, M.P., de la Cruz, D.F., Montoro, A., 2012. A Radarsat-2 quad-polarized time series for monitoing crop and soil conditions in Barrax, Spain. IEEE Trans. Geosci. Remote Sens., 50, pp. 1057-1070.
Petropoulos, G.P., Ireland, G., Srivastava, P.K., Ioannou-Katidis, P., 2014. An appraisal of the accuracy of operational soil moisture estimates from SMOS MIRAS using validated in situ observations acquired in a Mediterranean environment. Int.
J. Remote Sens., 35, pp. 5239-5250.
Richter, R., Schläpfer, D., Müller, A., 2006. An automatic atmospheric correction algorithm for visible/NIR imagery Int. J.
Remote Sens., 27, pp. 2077-2085.
Rodriguez-Alvarez, N., Vall-llossera, M., Camps, A., Bosch-Lluis, X., Monerris, A., Ramos-Perez, I., Valencia, E., Marchan-Hernandez, J.F., Martinez-Fernandez, J., Baroncini-Turricchia, G., Pérez-Gutiérrez, C., Sánchez, N., 2011. Land geophysical parameters retrieval using the interference pattern GNSS-R technique. IEEE Trans. Geosci. Remote Sens., 49, pp. 71-84.
Rouse, J.W., Haas, R.H., Shell, J.A., Deering, D.W., Harlan, J.C., 1974. Monitoring the vernal advancement of retrogradation of natural vegetation. Final Report, Type III. NASA/GSFC, Greenbelt, MD, p. 371.
Sánchez, N., Alonso-Arroyo, A., Martínez-Fernández, J., Piles, M., González- Zamora, A., Camps, A., Vall-llosera, M., 2015. On the synergy of airborne GNSS-R and Landsat 8 for soil moisture estimation. Remote Sens., 7 pp. 9954-9974.
Sánchez, N., Martínez-Fernández, J., Calera, A., Torres, E.A., Pérez-Gutiérrez, C., 2010. Combining remote sensing and in situ soil moisture data for the application and validation of a distributed water balance model (HIDROMORE). Agr. Water
Manage., 98, pp. 69-78.
Sánchez, N., Martínez-Fernández, J., González-Piqueras, J., González-Dugo, M.P., Baroncini-Turricchia, G., Torres, E., Calera, A., Pérez-Gutiérrez, C., 2012a. Water balance at plot scale for soil moisture estimation using vegetation parameters.
Agr. Forest Meteorol., 166-167, pp. 1-9.
Sánchez, N., Martínez-Fernández, J., Scaini, A., Pérez-Gutiérrez, C., 2012b. Validation of the SMOS L2 soil moisture data in the REMEDHUS network (Spain). IEEE Trans. Geosci.
Remote Sens., 50, pp. 1602-1611.
Schnur, M.T., Xie, H., Wang, X., 2010. Estimating root zone soil moisture at distant sites using MODIS NDVI and EVI in a semi-arid region of southwestern USA. Ecol. Inform., 5, pp. 400-409.
SSTL, Surrey Satellite Technology Ltd., 2016.
TechDemoSat-1: Mission page from SSTL
(http://www.sstl.co.uk/Missions/TechDemoSat-1-Launched-2014). Accessed April, 2016.
Thenkabail, P.S., Gamage, M.S.D.N., Smakhtin, V.U., 2004. The use of remote sensing data for drought assessment and monitoring in Southwest Asia, Research Report 85. International Water Management Institute, Colombo, Sri Lanka, p. 34.
Wagner, W., Pathe, C., Doubkova, M., Sabel, D., Bartsch, A., Hasenauer, S., Blöschl, G., Scipal, K., Martínez-Fernández, J., Low, A., 2008. Temporal stability of soil moisture and radar backscatter observed by the Advanced Synthetic Aperture Radar (ASAR). Sensors, 8, pp. 1174-1197.
Wang, C., Qi, J., Moran, S., Marsett, R., 2004. Soil moisture estimation in a semiarid rangeland using ERS-2 and TM imagery. Remote Sens. Environ. 90, pp. 178-189.