QUALITY ANALYSIS OF 3D SURFACE RECONSTRUCTION USING
MULTI-PLATFORM PHOTOGRAMMETRIC SYSTEMS
Z. Lari*, N. El-Sheimy
Department of Geomatics Engineering, University of Calgary, 2500 University Drive NW, Calgary, AB, Canada T2N 1N4 (zlari, Elsheimy)@ucalgary.ca
Commission III, WG III/1
KEY WORDS: Quality Analysis, 3D reconstruction, Laser scanning, Multi-platform photogrammetric systems, Unmanned Aerial Vehicle (UAV), Terrestrial imaging
ABSTRACT:
In recent years, the necessity of accurate 3D surface reconstruction has been more pronounced for a wide range of mapping, modelling, and monitoring applications. The 3D data for satisfying the needs of these applications can be collected using different digital imaging systems. Among them, photogrammetric systems have recently received considerable attention due to significant improvements in digital imaging sensors, emergence of new mapping platforms, and development of innovative data processing techniques. To date, a variety of techniques haven been proposed for 3D surface reconstruction using imagery collected by multi-platform photogrammetric systems. However, these approaches suffer from the lack of a well-established quality control procedure which evaluates the quality of reconstructed 3D surfaces independent of the utilized reconstruction technique. Hence, this paper aims to introduce a new quality assessment platform for the evaluation of the 3D surface reconstruction using photogrammetric data. This quality control procedure is performed while considering the quality of input data, processing procedures, and photo-realistic 3D surface modelling. The feasibility of the proposed quality control procedure is finally verified by quality assessment of the 3D surface reconstruction using images from different photogrammetric systems.
1. INTRODUCTION
Over the past few decades, accurate 3D surface reconstruction has been established as a necessity for a variety of mapping, modelling, and monitoring applications such as urban planning, environmental monitoring, infrastructure monitoring, cultural heritage documentation, indoor localization, and disaster management (Campos et al., 2015; Poullis and You, 2011; Kwak et al., 2013; Kemec et al., 2009; Zou et al., 2012). The required data for the reconstruction of 3D surfaces satisfying the needs of the aforementioned applications are generally collected using different passive and active digital imaging systems (e.g., laser scanning systems, high-end photogrammetric systems, and range cameras) mounted on static or mobile airborne and terrestrial platforms. Among these systems, laser scanners have received more attention due to their fast and accurate data acquisition capability, flexibility, and applicability in different atmospheric conditions (Arefi, 2009). In spite of their proven feasibility for 3D data acquisition, these systems cannot be efficiently employed for semantic large-scale modelling applications due to their high initialization costs, the need for users with high-level of technical expertise, and the lack of descriptive information along the scanned surfaces (Pu and Vosselman, 2009). To overcome these limitations, significant research attempts have recently been made to propose innovative image processing techniques (e.g. multi-view dense matching procedure) and revive photogrammetric systems as efficient and feasible tools for the collection of required data for 3D surface reconstruction (Haala, 2011; Mathias Rothermel et al., 2012; Wiechert et al., 2012). The significant advancements in image processing techniques, together with progressive hardware developments (e.g., low-cost high-resolution digital cameras and multi-camera systems), and emergence of new cost-effective mapping platforms (terrestrial platforms, Unmanned Aerial Vehicles – UAVs, and mobile robots) have strived to shift the focus of attention from laser scanning systems to modern photogrammetric systems for 3D modelling
activities. Although these systems have been noticed tremendously due to their cost saving and ability to provide more detailed information from the scanned scenes, they still are not widely used in different applications due to concerns about quality of delivered mapping products and 3D models (Lari and El-Sheimy, 2015). This concern originates from the use of lower-grade sensors onboard these platforms which might pose several processing challenges and deteriorate the quality of final products (Nex and Remondino, 2014). In order to verify the feasibility of newly-developed photogrammetric data processing techniques in dealing with these challenges, well-established quality control procedures are needed to evaluate the quality of 3D reconstructed surfaces using the images collected onboard emerging photogrammetric systems (i.e., UAV-borne and terrestrial photogrammetric systems). Hence, this paper introduces a quality analysis procedure for the evaluation of image-based 3D surface reconstruction. This quality analysis procedure is implemented by qualitative and quantitative evaluation of the reconstructed 3D surfaces in three successive steps: In the first step, the quality of input data for 3D surface reconstruction is investigated while considering the inaccuracies in raw system measurements (georeferencing and
imaging sensors’ measurements), the performance of initial
processing steps (i.e., pose estimation and dense image matching) and data gaps caused by nearby objects during data acquisition. In the second step, the quality of extracted 3D surfaces is investigated using a novel quality control procedure for the assessment of point cloud processing procedure (i.e., segmentation). Furthermore, geometric quality of the extracted 3D surfaces from imagery-based 3D point clouds is investigated using a novel quality control technique based on the estimated roughness factor of those surfaces. A surface matching between the reconstructed surfaces and control surfaces extracted from other data sources is also performed to verify the quality of the reconstructed surfaces using images. In the third step, the quality of the reconstructed 3D surfaces is inspected from visualization point of view. The reconstructed 3D surfaces can
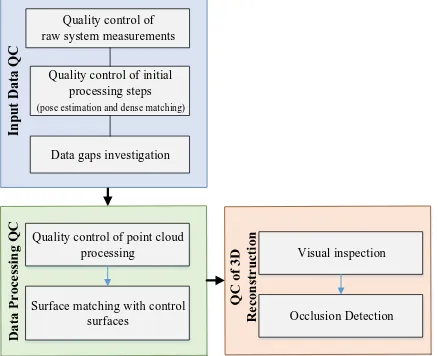
be textured photo-realistically or represented by their boundaries as wireframe models. These 3D models will be also investigated for possible occlusions or problems wireframe modelling procedures. Figure 1 shows the outline of the analysis of 3D reconstruction using photogrammetric data This paper starts by the introduction of the proposed approach for the quality analysis of 3D surface reconstruction using photogrammetric data. Afterwards, the feasibility of the proposed quality control procedure is verified through quality assessment of the 3D surface reconstruction using images from UAV-borne and airborne photogrammetric systems. A comparative analysis of the reconstructed surfaces from imagery collected onboard the emerging photogrammetric systems and overlapping surfaces extracted from laser scanning data is also performed to confirm the feasibility of these systems for the acquisition of data required for accurate 3D surface reconstruction. The implemented experimental results prove the competency of modern photogrammetric systems for the collection of geospatial data utilized for 3D modelling and monitoring applications. Finally, concluding remarks and recommendations for future research work are summarized.
2. QUALITY CONTROL OF INPUT DATA
The first step in quality assessment of 3D surface reconstruction using photogrammetric data (collected on different platforms) is to investigate the quality of acquired data. The collected data using these systems usually include multi-spectral images and positioning and orientation (POS) information provided by georeferencing sensors onboard these photogrammetric platforms. The quality assessment of input data for 3D surface starts by quality control of the collected data by onboard sensors. Subsequently, initial processing procedures (i.e., accurate pose estimation and multi-view dense matching procedures) are implemented to generate 3D point clouds from multi-view stereo images. Therefore, quality analysis procedures need to be developed for the assessment of generated 3D information using the collected images and POS information. Finally, the quality of the generated point clouds should be investigated from completeness point of view. Hence, point density quantification procedures are implemented to evaluate data completeness for 3D surface reconstruction and identify areas with lower point densities. In the following subsections, the utilized procedures for the quality evaluation of input data for photogrammetric 3D surface reconstruction will be discussed, in detail.
2.1 Quality control of raw system observations
Since the quality of 3D surface reconstruction from photogrammetric data is highly dependent on the quality of the input imagery and provided POS information, an accuracy analysis procedure is implemented in the first step to ensure the quality of the utilized data before further processing. This procedure is implemented to identify low-quality images (i.e., the images that suffer from problems such as noise, distortions, low radiometric quality, shadows, etc) and images which exhibit texture-less surfaces or surfaces with repeated textures (Remondino et al., 2013) (Figure 2). The existence of such problems in the collected images will lead to the generation of noisy point clouds or failure in feature extraction and image dense matching procedures. In order to solve first group of problems, image manipulation, geometric and radiometric calibration techniques can be performed. However, for the second set of problems no effective solutions have yet been
Figure 2. Examples of low quality images: (a) shadowed image, (b) image with high radial distortion, (c) image with low radiometric quality, and (d) image with repeated textures The quality of the collected POS information will be assessed using a well-distributed network of ground control points. The coordinates of these control points are re-estimated using image coordinate measurements and compared to their reference coordinates. The calculated differences in object space
represents the overall accuracy of the photogrammetric system’s
direct georeferencing components (Cramer et al., 2000). 2.2 Quality analysis of initial processing steps
The quality control of input data for 3D surface reconstruction is continued by quality control of initial processing steps for the generation of 3D point clouds from overlapping imagery. These procedures mainly comprise pose estimation and multi-view dense matching. The pose estimation procedure aims at accurately estimating the position and orientation of the utilized camera/cameras at exposure moments using known image features. The quality of pose estimation procedure is highly dependent on the accuracy of camera calibration, quality of feature extraction procedure from imagery, and the initial POS information approximations (Yoon et al., 2006).
On the other hand, the objective of dense matching procedure is to generate 3D information from the scanned surfaces based on the matched pixels in overlapping imagery. The accuracy of this procedure and the quality of the delivered 3D point clouds depends on the quality of the captured imagery and quality of camera calibration, pose estimation, and matching steps (Remondino et al., 2013). Figure 3 shows the impact of a poor
camera calibration procedure on the quality of the generated 3D point cloud.
(a)
(b)
Figure 3. The impact of poor system calibration on the quality of the generated 3D point clouds using: (a) inaccurate and (b) accurate camera calibration parameters
2.3 Data gaps
Although the introduced pre-processing procedures strive to provide complete accurate 3D point clouds over the scanned scenes, there are still several issues that cause gaps within the provided data. These gaps may originate from occlusions within the images, mismatching problems due to repeated or low quality image textures, or problems in accurate POS information estimation. In order to investigate these data gaps and areas with low point density in the generated point clouds, new point density quantification techniques will be applied (Lari and Habib, 2013). These techniques estimate the local point density indices while considering the 3D relationships among the neighbouring points and the nature of their enclosing surfaces. In other words, they reflect point density variations along the scanned surfaces. The areas with lower point density indices will be considered as data gaps and will be investigated for the possibility of visibility in the other captured images. Figure 4 represents a point density map derived for a generated point cloud according to these techniques.
Figure 4. The point density map of a generated 3D point cloud for the identification of data gaps
3. QUALITY CONTROL OF DATA PROCESSING
PROCEDURES
The generated 3D point clouds does not provide semantic information about the type and characteristics of the scanned features. Therefore, these point clouds should undergo processing techniques to deliver the required products for
different mapping, modelling, and monitoring applications. In order to verify the validity of these products, quality control techniques need to be developed for the assessment of these processing procedures. Among these processing procedures, segmentation is considered to be the most important one. The objective of this procedure is to identify features (i.e., surfaces) of interest and reduce scene complexity within the 3D generated point clouds. The far majority of existing point cloud segmentation techniques do not provide built-in procedures for the evaluation of the processing outcome. Therefore, quality control technique introduced in Lari et al. (2014) is used to identify possible problems affecting point cloud segmentation without user intervention and suggest alternatives for the resolution of these problems.
In addition, the quality of extracted surfaces can be investigated with respect to control surfaces. This quality control procedure is performed based on surface-by-surface matching and surface roughness comparison between the reconstructed surfaces and control surfaces. In the following subsections, the introduced procedures for the quality control of point cloud processing will be discussed, in detail.
3.1 Quality control of point cloud processing
As mentioned before, different approaches have been proposed for the extraction of primitive surfaces from 3D point clouds. Since none of these approaches are exempted from possible anomalies, a quality control procedure is required to evaluate the validity of the segmentation outcome. In this section, a recently developed technique for quality control of point cloud processing (i.e., segmentation) is described. One should note that this technique is implemented without the need for reference data and can be applied regardless of the utilized processing procedure. As a pre-requisite tool for the quality control of the extracted surface, roughness measure/factor is used (Wöhler, 2012). The roughness factor for a given surface is defined as the deviation of the segmented points within that surface from the best fitted plane/line to those points. This deviation is estimated as in Equation (1).
� ℎ � = � ���= √
∑�
= (1)
Where ndi is the normal distance between the ith point within the jth extracted surface and the best-fitted plane/line/cylinder through the constituent points and n is the number of clustered points in the extracted surface.
The possible issues in the processing outcome are then detected based on the estimated surface roughness factors as follows: (1) Non-Segmented Points
The unincorporated points are defined as those belonging to the extracted surfaces, while they could not be clustered during the processing procedure. The instances of this problem can be included in their neighbouring extracted surfaces if their normal distance to the best-fitted surface through the points of that cluster is not more than a pre-specified threshold which is determined based on the roughness factor of the neighbouring extracted surfaces.
(2) Over-Segmentation
The over-segmentation problem occurs when an individual surface is segmented into several surfaces. This problem might happen due to using strict processing thresholds or problems in surface parameterization procedure. To identify instances of this problem, the similarity between surface parameters (normals to neighbouring planar surfaces and directional parameters of neighbouring linear/cylindrical surfaces) are firstly investigated. If the parameters of the investigated surfaces are deemed to be similar, those surfaces are merged together as a single surface.
499613 pts/m2
0.13 pts/m2
(3) Under-Segmentation
The under-segmentation problem occurs when multiple surfaces with different parameters segmented a single surface. This problem might happen due to using relaxed processing thresholds and improper problems in surface parameterization procedure. In order to detect instances of the under-segmentation problem, the average surface roughness factors (ASRF) for all extracted surfaces are firstly estimated. For each of the extracted surfaces, if its surface roughness factor is more than a pre-defined threshold (e.g., 2-3 times of the average surface roughness factor of all derived surfaces in the same category), that surface is suspected to be undersegmented. For the suspected under-segmented surfaces, the segmentation process is repeated while changing the processing thresholds to check if they can be segmented into their constituent surfaces. (4) Invading/Invaded surfaces
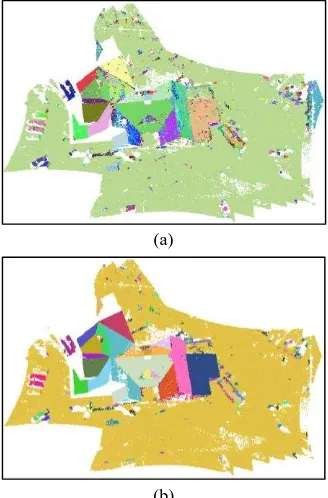
This problem occurs when an extracted surface is invading/being invaded by another neighbouring surface/surfaces. This issue might happen due to falsely evaluated surface parameters or poorly-chosen processing thresholds. To identify instances of this problem, the points which belong to the boundary of each extracted surface will be examined to determine if they can be incorporated into their neighbouring surfaces. If the normal distance between the boundary point in question and the best-fitted plane/line/cylinder through the constituents of a neighboring surface is less than the normal distance between that point and best-fitted plane/line/cylinder through the points of its original surface, that boundary point will be incorporated in its neighbouring surface. This procedure proceeds until no more points can be transferred from invading to invaded surfaces. Figure 5 shows how the introduced quality control procedure improves the outcome of point cloud processing.
(a)
(b)
Figure 5. The segmented point (a) before quality control procedure and (b) after quality control procedure
3.2 Quality control of the extracted surface w.r.t control surfaces
The quality control of the extracted surfaces from the generated point clouds can be also performed with respect to control surfaces extracted from other data sources (e.g, laser scanning
data). In order to perform such an evaluation, a few corresponding surfaces between two point clouds are identified. Once the correspondence between two point clouds established, optimal rotation and translation parameters between the two point clouds will be estimated. The estimated transformation parameters assist for the identification of other corresponding surfaces between the two point clouds.
The corresponding surfaces are then compared according to their estimated surface parameters or roughness factors. The deviation of the extracted surface parameters is utilized as a measure for the assessment of the quality of the extracted surfaces. Figure 6 shows how the quality control of an extracted planar surface with respect to a control planar surface is performed.
Extracted Surface
Control Surface Surface Normal
Surface Normal
Figure 6. Quality control of an extracted planar surface with respect to a control planar surface is performed
4. QUALITY CONTROL OF 3D SURFACE
RECONSTRUCTION
The extracted surfaces from the generated point clouds can be represented as wire-frame model using their boundaries or textured using the captured images to provide a realistic 3D view of the scanned scene. The quality control of the reconstructed 3D models can be carried out in two steps: qualitative evaluation of the reconstructed 3D model and identification of occluded surfaces within captured images. The qualitative evaluation of the 3D model is performed through visual inspection of the reconstructed 3D surfaces to find possible defects and imperfections. In addition, an occlusion detection procedure can be implemented during the texturing of the extracted surfaces to detect the parts of the surfaces that cannot be textured using the captured images. In the following subsection, the utilized approach for the identification of possible occlusions within the reconstructed 3D model will be described in detail.
4.1 Occlusion detection
In this section, an occlusion detection procedure introduced in Lari and Habib (2015) is described to check the visibility of the extracted surfaces within the captured imagery. This procedure also aims to investigate if the extracted surfaces are occluding or being occluded by other surfaces within the established 3D model. This occlusion detection procedure is established through the following steps: In the first step of this procedure, the suitability of available images for the texturing of an extracted surface is analysed while considering the angle between the surface normal and the optical axes of available images (α). For an extracted surface, the image in question is considered appropriate for the texturing procedure if the surface normal makes an acute angle with the optical axis of the image (Figure 7). Once this suitability analysis is carried out for all surfaces, a list of the appropriate images that could be used for the texturing of a given region is established.
Planar region of interest
n
Figure 7. The suitability analysis of available images for the texturing of an extracted surface
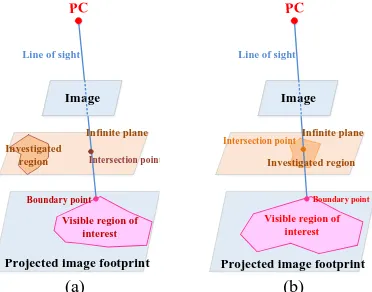
In the second step, the parts of the extracted surfaces which are occluding/being occluded by other surfaces within appropriate images are identified. This occlusion detection is implemented based on the visibility of boundaries of the extracted surfaces within those images. This visibility analysis is performed by intersecting the line segments between the perspective center of a given image and individual boundary points of an extracted surface with all surfaces that can be textured using that image. If the intersection point is outside the investigated region, the boundary point is not occluding/being occluded by that surface within the image in question. However, if the intersection point happens to be inside the investigated region, either the boundary point is occluded by the intersection points or the boundary point is occluding the intersection point (Figure 8).
Figure 8. Occlusion analysis of a surface’s boundary point in a given image, (a) intersection point outside of surface boundary (b) intersection point inside surface boundary
Once this occlusion detection procedure completed for entire extracted surfaces, the boundary points of the occluding surfaces are projected onto the occluded surfaces to accurately determine their obstructed parts. These occluded parts are identified by overlapping the extracted surfaces of interest with the projected occluding regions onto the infinite plane of that
In this section, experiments using real multi-platform photogrammetric data are conducted to verify the feasibility of the introduced approach for quality analysis of 3D surface reconstruction. The first experiment is implemented to investigate the feasibility of the proposed quality control procedure for the evaluation of extracted surfaces from a point cloud generated from images captured onboard a UAV-borne photogrammetric system. The UAV-borne images (167 images) utilized in this experiment have been collected using a Sony Nex 7 camera in Dortmund, Germany. In this experiment, the generated point cloud is initially processed for the extraction of individual planar surfaces (Figure 10). The introduced quality control procedure is then utilized to evaluate the quality of the extracted surfaces through point cloud processing and resolve problems affecting the quality of point cloud processing. Table 1 presents the frequency of possible issues occurring in processing outcome.
Figure 10.The extracted surfaces through point cloud processing procedure
The second experiment is carried out to evaluate the quality of 3D surface reconstruction using the images collected onboard a UAV with respect to control surfaces derived from an airborne LiDAR data processing. The utilized imagery data in this experiment have been collected using a GoPro Hero3 camera onboard a UAV system and control LiDAR data has been collected using an Optech ALTM 3100 airborne LiDAR system. The quantitative evaluation of the extracted surfaces in two point clouds is performed by comparison of the estimated surface roughness factors for all of the extracted surfaces in both point clouds. Figure 11 shows the extracted surfaces from airborne LiDAR point cloud and imagery-based point cloud and Figure 12 represents the accumulation of the extracted surfaces with respect to their estimated surface roughness factors. The comparison of the estimated values in both point clouds shows that higher quality surfaces have been extracted from LiDAR point cloud.
(a)
(b)
Figure 11. The extracted surfaces from (a) LiDAR point cloud and (b) imagery-based point cloud
(a)
(b)
Figure 12. Comparative analysis of the quality of the extracted surfaces from: (a) LiDAR-based point cloud and (b) imagery-based point cloud
The quality assessment of the extracted surfaces from imagery-based cloud is then implemented imagery-based on the control surfaces derived from overlapping LiDAR point cloud. Figure 13 represents the deviations of the extracted surfaces from imagery-based point-cloud with respect to their matched control surfaces from LiDAR point cloud.
Figure 13. The distribution of the extracted surfaces from imagery-based point cloud based on their deviations from matched LiDAR-derived control surfaces
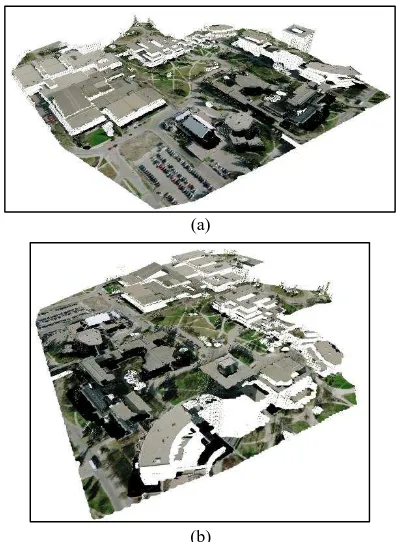
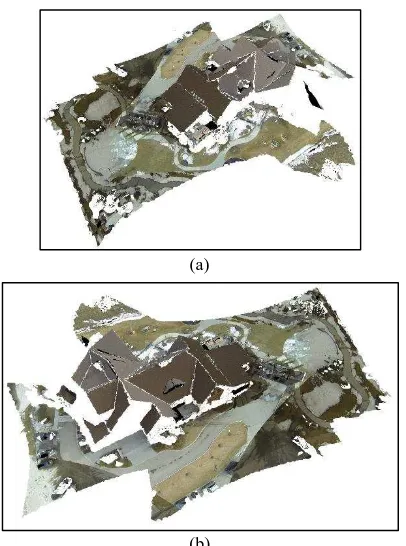
The third experiment provides photo-realistic 3D models generated using images collected onboard airborne and UAV-borne photogrammetric systems. The utilized airUAV-borne imagery in this experiment has been collected over University of Calgary campus, Canada using a RC30 camera and the utilized UAV-borne imagery have been captured by a GoPro Hero3 Camera. Figure 14 and 15 show different views of photo-textured realistic 3D models generated using the provided multi-platform photogrammetric data.
(a)
(b)
Figure 14. Two different views of a photo-realistic 3D model generated from airborne photogrammetric data
0% 10% 20% 30% 40%
0 -2 cm 2 - 4 cm 4 -8 cm 8 - 10 cm 10 - 15
cm
P
er
ce
n
tag
e
of
th
e
ex
tr
ac
ted
\s
u
rf
ac
es
Surface roughness factors
Evaluation of the surface roughness factors of the extracted surfaces from LiDAR-based point cloud
0% 20% 40%
0 -6 cm 6 -10 cm 10 -15 cm 15 - 20
cm
20 - 45 cm
P
er
ce
n
tag
e
of
th
e
ex
tr
ac
ted
su
rf
ac
es
Surface roughness factors
Evaluation of the surface roughness factors of the extracted surfaces from imagery-based point
cloud
15%
22%
38% 18%
7%
the distribution of the extracted surfaces based on their devaiation from the control LiDAR surfaces
0 - 2° 2 - 5° 5 -8° 8 -12° 12 -20°
(a)
(b)
Figure 15. Two different views of a photo-realistic 3D model generated from UAV-borne photogrammetric data
Qualitative evaluation of the reconstructed 3D models through visual inspection of Figures 14 and 15 verify the quality photo-realistic 3D surface reconstruction using overlapping images while considering the possible occlusions by different surfaces within the images. One should note that in these textured 3D models, the occluded areas are visualized in black color.
6. CONCLUSIONS AND RECOMMENDATION FOR
FUTURE RESEARCH WORK
In this paper, we have described a new methodology for quality analysis of 3D surface reconstruction using images collected onboard multi-platform photogrammetric systems. These reconstructed 3D models have been acquired through automated point cloud generation from the collected imagery, 3D point clouds processing and surface extraction, and texturing of the extracted surfaces. The quality control of 3D models is then implemented from three different aspects: quality of input data, quality of data processing, and quality of 3D surface reconstruction and texturing. The quality control of input data is performed by the evaluation of the captured imagery and collected POS information onboard photogrammetric systems. The quality of initial processing steps for pose estimation and 3D point cloud generation is also assessed in this step. In the next step, the quality control of further processing steps for surface extraction from 3D point clouds is investigated. The quality of the extracted surfaces is also verified by comparing the surface parameters of those surfaces with surface parameters of the matched control surfaces extracted other data sources. In the third step, the quality of the reconstructed 3D model is evaluated from visualization point of view. The possibility of surface occlusions by other surface for image-based texturing of the reconstructed 3D models is also investigated in this step. In conclusion, this paper provides a comprehensive platform for quality assessment of the reconstructed 3D models using data provided by photogrammetric systems. One should note that the quality analysis procedure presented in this paper is not limited to 3D surfaces reconstructed using photogrammetric data and
can be applied for 3D models extracted from other data sources (e.g., LiDAR and range systems). Future research work will be concentrated on the investigation of other issues that might affect the quality of 3D surface reconstruction to provide a more comprehensive quality analysis framework.
ACKNOWLEDGEMENTS
The authors would like to thank the Natural Sciences and Engineering Research Council of Canada Strategic Project Grants (NSERC SPG) for financial support of this research work. They would also like to acknowledge the provision of the datasets by ISPRS and EuroSDR, released in conjuction with the ISPRS scientific initiative 2014 and 2015, led by ISPRS ICWG I/Vb.
REFERENCES
Arefi, H., 2009. From LIDAR Point Clouds to 3D Building Models (thesis).
Campos, R., Garcia, R., Alliez, P., Yvinec, M., 2015. A Surface Reconstruction Method for In-detail Underwater 3D Optical Mapping. Int J Rob Res 34, 64–89.
Cramer, M., Stallmann, D., Haala, N., 2000. Direct georeferencing using gps/inertial exterior orientations for photogrammetric applications, in: International Archives of Photogrammetry, Remote Sensing and Spatial Information Sciences. pp. 198–205.
Haala, N., 2011. Multiray photogrammetry and dense image matching, in: Photogrammetric Week 2011. Stuttgart, Germany, pp. 185–195.
Kemec, S., Sebnem Duzgun, H., Zlatanova, S., 2009. A conceptual framework for 3D visualization to support urban disaster management, in: Proceedings of the Joint Symposium of ICA WG on CEWaCM and JBGIS Gi4DM. Praugue, Czech, pp. 268–278.
Kwak, E., Detchev, I., Habib, A., El-badry, M., Hughes, C., 2013. Precise photogrammetric reconstruction using model-based image fitting for 3D beam deformation monitoring. J. Surv. Eng. 139, 143–155.
Lari, Z., Al-Durgham, K., Habib, A., 2014. A novel quality control procedure for the evaluation of laser scanning data segmentation. ISPRS - Int. Arch. Photogramm. Remote Sens. Spat. Inf. Sci. XL-1, 207–210.
Lari, Z., El-Sheimy, N., 2015. System considerations and challenges in 3d mapping and modelling using low-cost UAV images, in: ISPRS - International Archives of the Photogrammetry, Remote Sensing and Spatial Information Sciences. pp. 343–348.
Lari, Z., Habib, A., 2015. A new approach for segmentation-based texturing of laser scanning data, in: ISPRS - International Archives of the Photogrammetry, Remote Sensing and Spatial Information Sciences. pp. 115–121.
Lari, Z., Habib, A., 2013. New approaches for estimating the local point density and its impact on LiDAR data segmentation. Photogramm. Eng. Remote Sens. 79, 195–207.
Mathias Rothermel, K.W., Fritsch, D., Haala, N., 2012. SURE: photogrammetric surface reconstruction from imagery, in: Proceedings LCD Workshop.
Nex, F., Remondino, F., 2014. UAV for 3D mapping applications: a review. Appl. Geomat. 6, 1–15.
Poullis, C., You, S., 2011. 3D Reconstruction of Urban Areas, in: Visualization and Transmission 2011 International Conference on 3D Imaging, Modeling, Processing. Presented at
the Visualization and Transmission 2011 International Conference on 3D Imaging, Modeling, Processing, pp. 33–40. Pu, S., Vosselman, G., 2009. Building Facade Reconstruction by Fusing Terrestrial Laser Points and Images. Sensors 9, 4525– 4542.
Remondino, F., Spera, M.G., Nocerino, E., Menna, F., Nex, F., Gonizzi-Barsanti, S., 2013. Dense image matching: Comparisons and analyses, in: Digital Heritage International Congress (DigitalHeritage), 2013. Presented at the Digital Heritage International Congress (DigitalHeritage), 2013, pp. 47–54.
Wiechert, A., Gruber, M., Karner, K., Ponticelli, M., Schachinger, B., 2012. The power of multi-ray photogrammetry -Ultramap 3.0, in: Proceedings of 2012 ASPRS Annual Conference. Sacramento, CA, USA.
Wöhler, C., 2012. 3D Computer Vision: Efficient Methods and Applications. Springer Science & Business Media.
Yoon, J.-H., Park, J.-S., Kim, C., 2006. Increasing camera pose estimation accuracy using multiple markers, in: Pan, Z., Cheok, A., Haller, M., Lau, R.W.H., Saito, H., Liang, R. (Eds.), Advances in Artificial Reality and Tele-Existence, Lecture Notes in Computer Science. Springer Berlin Heidelberg, pp. 239–248.
Zou, Y., Chen, W., Wu, X., Liu, Z., 2012. Indoor localization and 3D scene reconstruction for mobile robots using the Microsoft Kinect sensor, in: IEEE 10th International Conference on Industrial Informatics. Presented at the IEEE 10th International Conference on Industrial Informatics, pp. 1182–1187.