ASSESSMENT OF SATELLITE PRECIPITATION PRODUCTS IN
THE PHILIPPINE ARCHIPELAGO
M. D. Ramos a,b, E. Tendencia b, K. Espana b, J. Sabido b, G. Bagtasa a, a
Institute of Environmental Science & Meteorology, University of the Philippines b
IBM Philippines, Inc.
(ramosmm,tendenea,espana,jay.sabido)@ph.ibm.com, [email protected] Commission I, WG VI/5
KEY WORDS: Precipitation, rainfall, The Philippines, tropics, clouds.
ABSTRACT:
Precipitation is the most important weather parameter in the Philippines. Made up of more than 7100 islands, the Philippine archipelago is an agricultural country that depends on rain-fed crops. Located in the western rim of the North West Pacific Ocean, this tropical island country is very vulnerable to tropical cyclones that lead to severe flooding events. Recently, satellite-based precipitation estimates have improved significantly and can serve as alternatives to ground-based observations. These data can be used to fill data gaps not only for climatic studies, but can also be utilized for disaster risk reduction and management activities. This study characterized the statistical errors of daily precipitation from four satellite-based rainfall products from (1) the Tropical Rainfall Measuring Mission (TRMM), (2) the CPC Morphing technique (CMORPH) of NOAA and (3) the Global Satellite Mapping of Precipitation (GSMAP) and (4) Precipitation Estimation from Remotely Sensed information using Artificial Neural Networks (PERSIANN). Precipitation data were compared to 52 synoptic weather stations located all over the Philippines. Results show GSMAP to have over all lower bias and CMORPH with lowest Mean Absolute Error (MAE) and Root Mean Square Error (RMSE). In addition, a dichotomous rainfall test reveals GSMAP and CMORPH have low Proportion Correct (PC) for convective and stratiform rainclouds, respectively. TRMM consistently showed high PC for almost all raincloud types. Moreover, all four satellite precipitation showed high Correct Negatives (CN) values for the north-western part of the country during the North-East monsoon and spring monsoonal transition periods. daily weather phenomenon. Studies of rainfall patterns in global and regional scale have shown variations in annual precipitation trends for different regions (Dore 2005, Mauguet 2006, Allen 2007, Tan et al 2015), and larger changes are projected due to changes in the recurrence frequency of precipitation extremes in a warming world (Huntingford et al., 2003; Frei et al., 2006). The use of remotely sensed precipitation data has been helpful in the analysis of rainfall variability and trends worldwide. One of the most commonly used datasets is from the operational Tropical Rainfall Measuring Mission (TRMM) Multisatellite Precipitation Analysis (TMPA) that has 17 years of high-resolution global Quantitative Precipitation Estimation (QPE). The timescale covered by this dataset can already be considered appropriate for short-term climate studies. However, there are calibration issues that still exist especially on mountainous regions (Yong et al).
The Philippines is an archipelago consisting of more than 7100 islands situated between the western rim of the Pacific Ocean and South China Sea (locally known as the West Philippine Sea). It is dominated by complex terrain with long mountain ranges in the two largest islands Luzon and Mindanao, and Visayas comprising of smaller islands. The meridional migration of the Inter-Tropical Convergence Zone across the archipelago that gives rise to the summer and winter monsoon periods determines the seasonality of rainfall in different regions of the Philippines. The western part of the country is
significantly influenced by convective rains from the warm moist air of the southwest during the Boreal summer while the eastern part gets orographically induced precipitation from low-level easterlies originating from the Pacific on winter season (Akasaka, 2007). In addition, rainfall is also influenced by El Niño and La Niña occurrences (Ropelewski and Halpert, 1996, Lyon et al. 2006, Hilario et al. 2009).
In-situ rainfall observations can be significantly influenced by its surrounding environment. Hence, determining the meteorological characteristics of a region where a rain gauge is located is important in understanding the resulting rainfall data. The Philippines is categorized as a tropical rainforest / monsoon climate (Koppen, 1936). Locally, it is divided into four distinct climate types by Corona (1923), and later modified by Flores (1969) where Type I climate covers most of the western region having two pronounced seasons, dry from November to April and wet the rest of the year. Type II climate describes the eastern regions where there is no dry season for the whole year but with more rain during the winter monsoon period. Type III climate is defined in areas where seasons are not distinct but relatively drier from November to April and Type IV climate with rainfall being evenly distributed all throughout the year. Rainfall in many parts of the Philippines is also affected by tropical cyclones. Certain regions in northern Philippines can have as much as over half (53%) of its annual rain from passing tropical cyclones (Kubota and Wang, 2009). While there is still no consensus on the effects of global warming on tropical cyclone behaviour (IPCC AR5, 2013), current remotely-sensed precipitation products can be an indispensible tool in elucidating our understanding of tropical cyclone precipitation. The aim of this study is to assess four satellite precipitation datasets, namely Tropical Rainfall Measurement Monitoring
TRMM 3B42, Precipitation Estimation from Remotely Sensed information using Artificial Neural Networks (PERSIANN), Global Satellite Mapping of Precipitation (GSMaP) project and the National Oceanic and Atmospheric Administration, Climate Prediction Center (NOAA,CPC) Morphing Technique (CMORPH) precipitation product, and characterize their corresponding errors in precipitation estimation .
2. METHODOLOGY
2.1 Satellite Precipitation products
Four satellite precipitation products are used in this study. TRMM Multi-satellite Precipitation Analysis is widely used in climatological rainfall studies (Wang et al. 2014; Liu 2015; Bren˜a-Naranjo et al. 2015). The 3B42 version 7 gridded data are gauge adjusted and provides coverage from 50N–50S. It is based on the Advanced Microwave Scanning Radiometer-Earth Observing System (AMSR-E), Advanced Microwave Sounding Unit-B (AMSU-B), TRMM Microwave Imager (TMI) and Spectral Sensor Microwave Imager/Sounder (SSMI/S). CMORPH (Hsu et al. 1999) global precipitation dataset uses precipitation estimates that have been derived from low orbiter satellite microwave observations. These features are transported via spatial propagation information that is obtained from geostationary satellite IR data. Data are derived from passive microwaves aboard the DMSP 13, 14 & 15 (SSM/I), the NOAA-15, 16, 17 & 18 (AMSU-B), AMSR-E onboard NASA’s Aqua and TRMM-TMI. PERSIANN system uses neural network function classification/approximation procedures to compute an estimate of rainfall rate from infrared brightness temperature image provided by geostationary satellites (GOES-8, GOES-10, GMS-5, Metsat-6, and Metsat-7). The 3 datasets, TRMM, CMORPH and PERSIANN rainfall rate estimates at 0.25° x 0.25° grid cell spatial resolution. Similar to the algorithm of CMORPH, the GSMAP algorithm combines rainfall estimates from GPM-Core GMI (Microwave Imager), TRMM TMI, Aqua AMSR-E, DMSP (Defense Meteorological Satellite Program) series, NOAA AMSU-A/-B and Microwave Humidity Sounder (MHS). Background cloud images are globally merged IR data produced by NOAA Climate Prediction Center (CPC), using IR data observed by JMA's MTSAT satellite, NOAA's GOES satellites and EUMETSAT's Meteosat satellites. GSMAP version 5 from 2000 to 2010 and version 6 from 2012 to 2015 are used in this study. Both versions have spatial resolution of 0.01° x 0.01°. Daily accumulated rainfall are calculated from the datasets and compared with rain-gauge measurements.
2.2 Statistical metrics
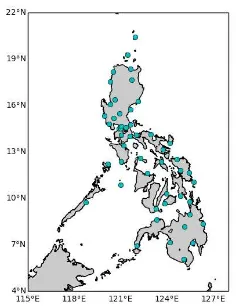
The satellite precipitation datasets are compared with ground synoptic rainfall observations from the Global Surface Summary of the Day (GSOD) data provided by the National Climatic Data Center (NCDC). A total of 52 stations scattered all over the Philippines were used in the comparison from 1998 to 2015, as shown in figure 1. These synoptic stations are operated and maintained by the Philippine weather bureau PAGASA (Philippine Atmospheric, Geophysical, and Astronomical Services Administration).
Figure 1. Location of synoptic stations in the Philippines.
Different measures have been employed to evaluate the performance of satellite-derived parameters. In this paper, satellite precipitation measurements are compared against rain-gauge observations using several statistical tools including the Bias given by:
(1) where M and O are the mean of the measured (RS) and observed values, respectively. The mean absolute error (MAE), which is a function of the average error given as
(2) and the root mean square error RMSE
(3) where N is the total number of observed and measured values. The RMSE is a function the average and variability of the error magnitude.
In addition, to assess the ability of satellite measurement to predict rain/no rain events, a contingency table statistics (table 1) is utilized to calculate Proportion Correct (PC, Eqn. 4), the ratio of correct satellite measurements and total observation, and Correct Negatives (CN Eqn. 5), which corresponds to
3. RESULTS AND DISCUSSION
3.1 Daily Mean Rainfall distribution
Figure 2 (a-c) show rainfall distribution of all the satellite precipitation products. The southeast region of the Philippines is climatologically the rainiest location in the country that receives an average of 3600 mm annually. This feature is evident in all datasets. However, daily mean rainfall of the eastern coast is generally lower for CMORPH data. On the other hand, the western region of the country gets significant rain during the southwest monsoon season. It is estimated that 43% of total Philippine rainfall falls during this season (Asuncion and Jose, 1980). TRMM and GSMAP data show apparent contrast between the western coast and inland regions of Luzon. This feature is not evident in CMORPH and PERSIANN data. Furthermore, only GSMAP data show coastal rainfall consistent with topographic land features. Higher rainfall is seen on the coastal regions in the northeast, west of Central Luzon and southwest Philippines. It also shows less rain in the plains of Luzon. These features (not seen in other datasets) are likely due to the higher spatial resolution of GSMAP. CMORPH data has relatively less overall rainfall among all datasets, particularly inland and along the western island of Palawan.
a) TRMM b) CMORPH
c) GSMap d) PERSIANN
Figure 2. Mean Daily Rainfall of (a) TRMM, (b) CMORPH, (c) GSMAP and (d) PERSIANN satellite precipitation products.
3.2 Tempo-spatial Statistical Validation
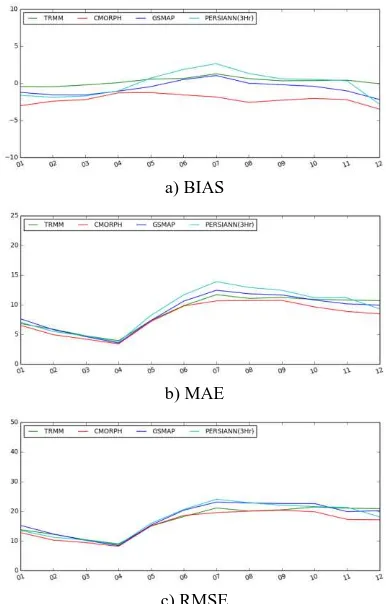
Combined mean Bias, MAE and RMSE for all stations are shown in Fig. 3 (a-c). Overall, mean Bias is relatively low with positive wet bias in the middle of the year and a dry bias towards year end. MAE tends to be lower during the spring monsoonal transition period which is the driest season of the year and peaks during southwest monsoon season. RMSE follows a similar monthly trend as MAE.
a) BIAS
b) MAE
c) RMSE
Figure 3. (a) Bias, (b) MAE and (c) RMSE of all station for each satellite precipitation dataset
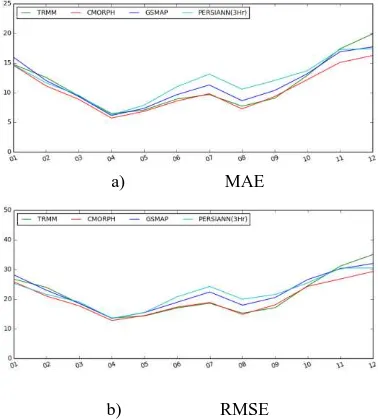
Active convection on the western coast of the Philippines is prevalent during the southwest monsoon season. On the other hand, precipitation on the eastern coast is produced from the interaction of northeasterly and/or trade winds with local topography during the northeast monsoon season. Ten (10) stations (SYNOP station: Laoag, Baguio, Cabanatuan, Dagupan, Subic, Clark, Manila, NAIA, Science Garden, San Jose, Iba and Vigan) located to the west and eleven (11) stations (SYNOP station: Appari, Virac, Legazpi, Guian, Catarman, Infanta, Daet, Borongan, Surigao, Hinatuan, Dipolog) on the eastern coast of the Philippines were chosen to represent the different rainfall regimes of the archipelago.
Figure 4 (a) and (b) show MAE and RMSE, respectively, from observations located on the western coast. While figure 5 (a-b) are for stations from the east coast. All datasets generally follow the same trend. As expected, higher error is found during the peak rainy season of both coasts.
a) MAE
b) RMSE
Figure 4. (a) MAE and (b) RMSE of West coast stations
a) MAE
b) RMSE
Figure 5. (a) MAE and (b) RMSE of East coast stations c)
4. CONCLUSION
Changes in rainfall intensity and distribution can have a significant impact on different sectors of a society. Recent advances in rainfall estimation algorithm from microwave and IR remote sensing have produced high spatial and temporal resolution global rainfall datasets. These datasets are now spanning more than a decade and this makes it an invaluable tool in climatological rainfall studies. Moreover, availability of near real-time rainfall data is enabling disaster managers in the Philippines to address risks in ways that were not possible in the past. To the authors’ knowledge, this study is one of the initial satellite-derived precipitation data assessments in the Philippine region.
As expected, higher error (MAE and RMSE) are found on peak rain seasons. Consequently, results also revealed high Correct Negatives (CN) values for the different dry seasons of the west and east coast. Overall, all datasets follow the same monthly
This is likely due to positive and negative bias of west and east coast rain, respectively, that produced a net flat monthly bias. This paper describes only the first part of this study as further investigation is warranted in the assessment of these datasets. Additional assessment using denser network of rain gauge and better data quality control can improve our understanding of each dataset’s strengths and limitations. A composite rainfall product derived from existing datasets may also minimize errors which can be better used for climatological studies. Finally, separate analysis for tropical cyclone induced rain can help in precipitation nowcasting to reduce the destructive impacts of such extreme meteorological events that regularly affect the Philippines.
REFERENCES
Akasaka I., Morishima W., Mikami T., 2007: Seasonal march and its spatial difference of rainfall in the Philippines. Int J Climatol 27 pp. 715-725.
Allen, M.R. and Ingram, W.J., 2007: Constraints on Future Changes in Climate and Hydrological Cycle. Nature, 419, pp. 224-232.
Asuncion, J., and Jose A., 1980: A study of the characteristics of the northeast and southwest monsoons in the Philippines. NRCP assisted project, 49 pp. 307-308 (available from the Philippine Atmospheric Geophysical and Astronomical Services Administration, Quezon City, Philippines).
Breña-Naranjo J.A, Pedrozo-Acuña A., and Rico-Ramirez M.A., 2015. World's greatest rainfall intensities observed by satellites. Atmospheric Science Letters. Vol 16 (3) pp. 420-424. doi: 10.1002/asl2.546
Coronas, J., 1920: The climate and weather of the Philippines, 1903 to 1918. Bureau of Printing, Manila.
Dore, M.H.I., 2005: Climate Change and Changes in Global Precipitation Patterns: What Do We Know?. Environmental International, 31, pp. 1167-1181.
Ebert, E. E., Janowiak, J. E., and Kidd, C., 2007. Comparison of near-real-time precipitation estimates from satellite observations and numerical models, B. Am. Meteorol. Soc., 88, pp. 47–64, doi:10.1175/bams-88-1-47.
Flores, J. F. and Balagot, V. F., 1969. Climate of the Philippines. In World Survey of Climatology. ed. Arakawa, H. Vol. 8, Amsterdam: Elsevier Scientific Publishing Company.
Frei C., Schöll R., Fukutome S., Schmidli J., and Vidale P.L., 2006. Future change of precipitation extremes in Europe: Intercomparison of scenarios from regional climate models. J. Geophysical Res. Vol. 111, Issue D6 DOI: 10.1029/2005JD005965.
Hilario, F., R. de Guzman, D. Ortega, and P. Hayman, 2009: El nin˜o southern oscillation in the 349 Philippines: impacts, forecasts, and risk management. Philipp. J. Dev., 36, pp. 9–34.
Hsu, K. L., Gupta, H. V., Gao, X. G., and Sorooshian, S., 1999. Estimation of physical variables from multichannel remotely sensed imagery using a neural network: Application to rainfall estimation,
Water Resour. Res., 35, pp. 1605–1618.
Huntingford C., Jones R.G., Prudhomme C., Lamb R., Gash J. H. C., and Jones D. A., 2009. Regional climate-model predictions of extreme rainfall for a changing climate. Quarterly Journal of the Royal Meteorological Society. Vol 129(590), pp. 1607–1621, April 2003
IPCC, 2013: Climate Change 2013: The Physical Science Basis.
Köppen W., 1936. Das geographische System der Klimate. In: Handbuch der Klimatologie. ed. Köppen W., Geiger R., Gebrüder Borntraeger, Berlin, pp. 1−44.
Kubota, H., and B. Wang, 2009: How much do tropical cyclones affect seasonal and interannual 354 rainfall variability over the western north pacific? J. Climate, 22, pp. 5495–5510, doi:10.1175/355 2009JCLI2646.1.
Lyon, B., Cristi, H., Verceles, E.R., Hilario, F.D., Abastillas, R., 2006. Seasonal reversal of the ENSO rainfall signal in the Philippines.
Geophys. Res. Lett. 33, pp. 1–5.
Meng J., Li L., Hao Z., Wang J., Shao Q., 2014. Suitability of trmm satellite rainfall in driving a distributed hydrological model in the source region of yellow river. J Hydrol. 509: 320–332. doi: 10.1016/j.jhydrol.2013.11.049
Ropelewski, C.F. and Halpert, M.S., 1996: Quantifying Southern Oscillation-Precipitation Relationships. J. Climate, 9, pp. 1043–1059.
Tan J., Jakob C., Rossow W.B., Tselioudis G., 2015. Increases in tropical rainfall driven by changes in frequency of organized deep convection. Nature 519, pp. 451-454. Online publication date: 25-Mar-2015.
Yong B., Liu D., Gourley J.J., Tian Y., Huffman G.J., Ren L., and Hong Y., 2015. Global View Of Real-Time Trmm Multisatellite Precipitation Analysis: Implications For Its Successor Global Precipitation Measurement Mission. B. Am. Meteorol. Soc., 96(2), pp. 283–296, doi: 10.1175/BAMS-D-15-00198.1.
World Bank, 2012. Employment in Agriculture.
http://data.worldbank.org/indicator/SL.AGR.EMPL.ZS (accessed 25 October 2014).