ENABLING EARTH SCIENCE MEASUREMENTS WITH NASA UAS CAPABILITIES
Randal Albertson1, Susan Schoenung2,*, Matt Fladeland3, Frank Cutler1, Bruce Tagg4
1
NASAArmstrong Flight Research Center, Edwards, California 93523 USA - (randal.t.albertson, frank.w.cutler)@nasa.gov 2
Longitude 122 West, Inc., 885 Oak Grove Avenue, Menlo Park, California 94025 USA - [email protected] 3
NASA Ames Research Center, Moffett Field, California 94035 USA - [email protected] 4
NASA Airborne Science Program, 300 E Street SW, Washington DC 20546 USA - [email protected]
KEY WORDS: NASA, UAS, UAV, airborne, aircraft, Earth Science
ABSTRACT:
NASA’s Airborne Science Program (ASP) maintains a fleet of manned and unmanned aircraft for Earth Science measurements and observations. The unmanned aircraft systems (UAS) range in size from very large (Global Hawks) to medium (SIERRA, Viking) and relatively small (DragonEye). UAS fly from very low (boundary layer) to very high altitude (stratosphere). NASA also supports science and applied science projects using UAS operated by outside companies or agencies. The aircraft and accompanying data and support systems have been used in numerous investigations. For example, Global Hawks have been used to study both hurricanes and atmospheric composition. SIERRA has been used to study ice, earthquake faults, and coral reefs. DragonEye is being used to measure volcanic emissions. As a foundation for NASA’s UAS work, Altair and Ikhana not only flew wildfires in the US, but also provided major programs for the development of real-time data download and processing capabilities. In 2014, an advanced L-band Synthetic Aperture Radar flew for the first time on Global Hawk, demonstrating UAVSAR, which has been flying successfully on a manned aircraft. This paper focuses on two topics: 1) results of a NASA program called UAS-Enabled Earth Science, in which three science teams flew UAS to demonstrate platform and sensor performance, airspace integration, and applied science results from the data collected; 2) recent accomplishments with the high altitude, long-duration Global Hawks. The challenges experienced with flying UAS are discussed. Recent upgrades to data processing, communications, tracking and flight planning systems are described.
1. INTRODUCTION
1.1 NASA’s Airborne Science Program (ASP)
The Airborne Science Program (ASP) is part of the Earth Science Division (ESD), which in turn is part of NASA’s Science Mission Directorate (SMD). ASP maintains and flies a fleet of both manned and unmanned aircraft systems modified and adapted to investigations for the Earth Science and Applied Science communities. ASP also provides aviation services to the science community and facilitates flights of non-NASA aircraft for relevant science. The program website can be found at http://airbornescience.nasa.gov.
1.2 Science and applications
ASP supports NASA Earth Science in the following capacities:
- Process studies
- Satellite mission instrument development, algorithm development and calibration and validation activities
- Instrument test
- Workforce development of next generation scientists and engineers
Airborne activities support all of NASA’s Earth Science and Applied Sciences areas. The Earth Science research programs are: Atmospheric Composition and Chemistry, Carbon Cycle and Ecosystems, Climate Change and Variability, Water and Energy Cycle, Earth Surface and Interior and Weather. http://science.nasa.gov/earth-science/.The current Applied Sciences program areas are: Disasters, Ecological Forecasting, Health & Air Quality, and Water Resources. http://www.nasa.gov/applied-sciences/
Aircraft are selected for science and applied science missions in a variety of ways, often by investigators responding to a * Corresponding author
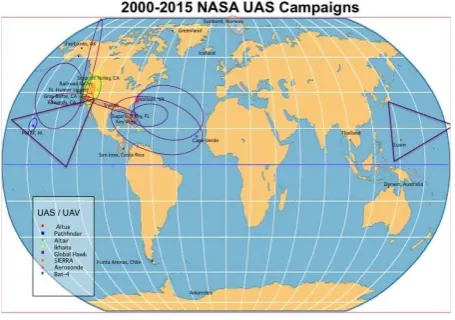
solicitation. As the aircraft needs to meet the requirements of the mission, NASA’s approach is to include both manned and unmanned aircraft in a common pool and to fly UAS when the unique capabilities of the system make it the appropriate choice. A map of recent UAS activities is shown in Figure 1.
Figure 1. Map of NASA UAS missions 2000-2015
1.3 Unmanned Aircraft Systems
NASA’s UAS range from small to large, with varying capabilities, as indicated in Table 1.
Aircraft / UAS
Max Altitude, km
Endurance, hrs
Payload Weight, kg
DragonEye 0.15 1 0.5
SIERRA 3.6 10 45
Viking 4.5 11 45
Ikhana 12 24 900
Global Hawk 20 30 860
NASA has been demonstrating the utility of UAS for Earth Science and Applied Science since the early 1990’s, beginning with the Environmental Research and Sensor Technology (ERAST) program (Schoenung, 2003), (ERAST, 2004) and then the UAV Science Demonstration Program (Wegener, 2003), (Yuhas, 2006). The high altitude Altair and then the Ikhana UAS flew Western States Fire missions (Ambrosia, 2011). SIERRA entered cryosphere science with Characterization of Arctic Sea Ice Experiment (CASIE) as an element in the International Polar Year (Schoenung, 2011), (Crocker, 2012). Global Hawk’s first science mission, which took place in 2010, was Global Hawk Pacific (GloPac). http://www.nasa.gov/centers/dryden/research/GloPac/. This was followed by the Genesis and Rapid Intensification Project (GRIP). References for these previous missions are included. More recent activities, UAS-Enabled Earth Science and two Earth Venture mission, are described in this paper.
2. UAS-ENABLED EARTH SCIENCE
2.1 Objectives / Background of the Program
The overall objective of this program was to make advances in Earth system science through innovative UAS-enabled science investigations that addressed elements of NASA’s Earth science goals and objectives. The secondary goal was to demonstrate unique or complementary capabilities of different classes of UAS, so as to report on UAS system and vehicle performance and to make recommendations for future considerations to accommodate science objectives. The 2010 solicitation resulted in selection of three projects, as listed in Table 2. Note that at least 2 UAS were to be used in each project, and one of those was to be a NASA UAS.
Project Principle Investigator
UAS
Earthquake Hazards
Jonathan Glen, USGS
SIERRA, SWIFT, XSCAV
Sea Grass and Coral
Stanley Herwitz, UAV Collaborative
BAT-4, SIERRA, Rotorcraft MIZOPEX James Maslanik,
University of Colorado
Scan Eagle, SIERRA, CU DataHawk
Table 2. UAS-Enabled Earth Science Projects
2.2 Earthquake Hazards Mission
“Long-term earthquake hazards and groundwater resources in a tectonically active region: Critical insights from UAS” was the title of the project thereafter called Earthquake Hazards. Jonathan Glen of USGS led a team of NASA, USGS and Carnegie Mellon University colleagues. The objective of the project was to map paths for groundwater flow and characterize seismic hazard potential in Surprise Valley, California, by utilizing UAS to collect high-resolution magnetic data along faults and fracture systems.
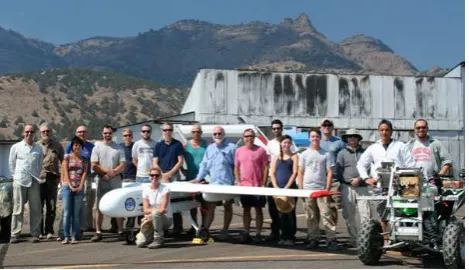
2.2.1 Aircraft: This project team made use of NASA’s SIERRA UAS during the first year of the project, as seen in Figure 2. During the second year, the team intended to fly a custom-designed platform (SWIFT) to demonstrate payload directed flight (PDF). Unfortunately, the UAS was not approved for flight because it used lithium-ion batteries in the propulsion system and overheating was a concern.
The replacement aircraft (XSCAV) made significant progress in development of the PDF architecture and simulation testing of
PDF control. Unfortunately, it did not complete testing on-site due to an instability-related crash.
Figure 2. SIERRA UAS with project crew in Surprise Valley
2.2.2 Payload and Science: The payload on the UAS consisted of a magnetometer and a lidar. In September 2012, the SIERRA flew a regional survey over the entire valley with detailed flight paths over several targeted areas. By all measures, the mission was a great success: the data quality and resolution far exceeded expectations, and the system functioned even better than anticipated, allowing collection of more data than was originally planned. A key outcome from this survey was the discovery that the hot springs correlate with breaks and bends in a buried structure imaged by the magnetic survey (Figure 3) – a finding that could never have been substantiated by ground-based data collection.
Figure 3. Magnetic grid derived from data collected by UAS in Surprise Valley, 2012. Hot springs shown as red dots
2.3 Seagrass/Coral Reef Mission
Another of the projects selected, titled High Resolution Assessment of Carbon Dynamics in Seagrass and Coral Reef Biomes, was led by Stanley R. Herwitz, Ph.D., Director of the UAV Collaborative at NASA Research Park. The research goal of the project involved testing the utility of UAS technology, particularly as it relates to assessments of change in seagrass and coral reef biomes. The team of investigators included University of South Florida, Florida Fish and Wildlife Research Institute and USGS. Detailed airborne and water-based datasets were systematically collected from representative seagrass and coral reef sites on the US Gulf Coast and in the Florida Keys. A total of 26 UAV flights involving 3 different UASs equipped with different multispectral and hyperspectral imaging payloads were completed in 2013.
2.3.1 Aircraft included SIERRA, BAT-4 (manufactured by MLB) and the Vision-II JetCopter UAV (manufactured by Xtreme Aerial Concepts). The BAT-4 and SIERRA, as relatively mature platforms, operated well during their respective missions. However, the helicopter (Figure 4) was found to be more suitable for this mission because it could take off and land from a fixed position without needing a runway, and could hover at low altitude for the observations required. For part of the mission, the UAS was launched from a barge off the coast. (Figure 5.)
Figure 4. Vision-II UAS carrying NovaSol hyperspectral imager
Figure 5. Aerial view of Cheeca Rocks reef, barge serving as UAV launch pad, and project’s associated research vessels
2.3.2 Payloads and Science: Payload instruments for the mission consisted of multispectral and hyperspectral sensors on the UAV, and numerous spectral instruments on the research vessels. The major science achievement was the collection of spectral data using UAV-based sensors in synchrony with intensive field measurements. The temporal and spatial dynamics of seagrass and coral biomes was a primary focus. Particular attention was directed to light-water interactions, the properties of the water column, benthic O2 and CO2 gas exchange, biological productivity, and the influence of these parameters on the reflectance characteristics of airborne imagery. (English, 2014)
2.3.3 Airspace Operations: Obtaining FAA authorization to fly approved UAVs at specific locations in the National Airspace System (NAS) required that the project’s Principal Investigator (PI) manage the preparation and presentation of documentation required by the Airworthiness and Flight Safety Review Board (AFSRB). Working in collaboration with the NASA Ames Research Center’s Office of Range Safety, the PI prepared the on-line submissions for FAA-approved Certificates of Authorization (COAs). Six COAs enabling UAV flights at specific sites in Class E and G Airspace at or below 3,000 ft (915 meters) MSL were successfully obtained from the FAA. These enabled: (1) pre-Deployment test flights of the Bat-4 UAV at Moffett Field North; (2) airborne data acquisition using the Bat-4 UAV in the Florida Keys (3) airborne data acquisition using the SIERRA UAV in the Florida Keys; (4) airborne data acquisition using the Bat-4 UAV at Cedar Key north of Tampa, Florida; (5) pre-Deployment test flights of the Vision-II UAV at Moffett Field North; and (6) airborne data acquisition using the Vision-II UAV in the Florida Keys; specifically, Sugarloaf Key and the Cheeca rocks reef site located offshore from Islamorada Key.
2.4 Sea Ice Mission - MIZOPEX
The Marginal Ice Zone Ocean and Ice Observations and Processes Experiment (MIZOPEX) was led by Professor James Maslanik of University of Colorado (CU), and included partners from NOAA, University of Alaska-Fairbanks (UAF) and NASA. The project goal was to assess the utility and challenges of using different classes of UAVs to characterize Arctic sea ice and Arctic Ocean temperatures. The region of interest in the Beaufort Sea is shown in Figure 6. The USAF Oliktok Facility was the site of operations. The majority of the experiment took place in summer 2013.
2.4.1 Aircraft: The MIZOPEX project used three UAS, the NASA SIERRA, UAF Scan Eagle and CU DataHawk, as shown in Figure 7. The Scan Eagle and DataHawk provided most of the project data. The SIERRA flew a 4.5-hour science flight before crashing into the sea due to an engine failure.
Figure 7. UAS used during MIZOPEX included SIERRA (top), ScanEagle (bottom left) and DataHawk (bottom right)
2.4.2 Payload and Science: Multiple sensors were carried on the three aircraft, as listed in Table 3.
UAS Sensors
SIERRA cameras, radars, altimeter, radiometers ScanEagle cameras, SAR, altimeter, radiometer DataHawk air-deployed microbuoys (ADMB)
Table 3. Sensors carried on the MIZOPEX platforms
Major science accomplishments included: acquisition of sea surface temperature (SST) and sea ice characteristics in/near the MIZ over a 20 x 20 km region, with multiple missions spaced over the deployment period, sufficient to document spatial and temporal variability of SST and ice conditions; and overlapped measurements of an SST grid with buoy measurements, sufficient to document spatial variability and relationships between remotely-sensed and in-situ measurements (Tschundi, 2014).
2.4.3 Airspace Operations: Permission to fly in the Arctic airspace was obtained from the FAA through a complicated process involving the USAF, DOE, and NASA. DOE oversees a restricted airspace zone (R-2204) centered over Oliktok Point proper. Availability of R-2204 and provision for its use by DOE and FAA were important aspects for ultimate approval of the flight permissions granted to MIZOPEX by FAA (including BLOS and multiple UAS use). The framework ultimately agreed upon for flight operations consisted of use of R-2204, designation of a flight corridor from R-2204 to international airspace, and then operation within international airspace under NASA Due Regard provisions. Cooperation received from USAF, DOE, along with FAA regarding facilities and airspace use was critical to the project. Also integral to FAA's granting of the COAs to operate in this manner was the inclusion by MIZOPEX of a ground-based radar system to assist with sense and avoid for local air traffic. This system was leased from and operated by Thales-Raytheon Systems Co. and was deployed on site during MIZOPEX. A test of the performance of the radar, evaluating its ability to detect air traffic, was required by FAA before it could be used as part of the sense and avoid plan.
3. GLOBAL HAWK AND EARTH SCIENCE
NASA operates two Global Hawk UAS (Figure 8). The aircraft has a maximum altitude of approximately 65,000 ft (20 km), 11,000-nautical-mile (20,000 km) range and 30-hour endurance, together with satellite and line-of-site communication links to the ground control station. Dedicated satellite communication links provide researchers with direct access to their onboard instrument packages during missions. Researchers have the ability to monitor instrument function from the ground control station and evaluate selected data in real time. Global Hawk has flown two major mission types to date – high altitude monitoring of hurricanes and severe weather and high altitude atmospheric sampling. Other mission concepts include long duration flight of SAR types including L-band and Ka-band, as well as concepts to carry lidars for column measurements of green house gases.
Figure 8. Global Hawk UAS
3.1 Hurricane and Severe Storm Missions
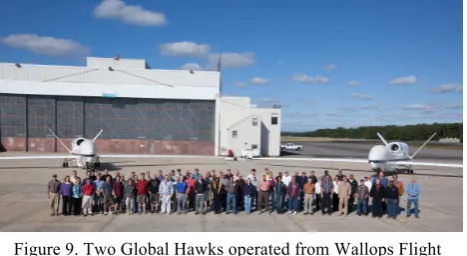
The Hurricane and Severe Storm Sentinel (HS3) mission was specifically targeted to investigate the processes that underlie hurricane formation and intensity change in the Atlantic Ocean basin. This 5-year mission was selected as part of NASA’s Earth Venture program in 2011. Major experiments were flown in 2012, 2013 and 2014. In 2013, two Global Hawks operated from NASA’s Wallops Flight Facility in Virginia (Figure 9), providing high level monitoring and in situ environmental measurements.
Figure 9. Two Global Hawks operated from Wallops Flight Facility in 2013 during HS3
A major effort for the science use of Global Hawk has been the development of the Global Hawk Operations Center (Figure 10). In addition to aircraft control, a separate room for scientists gives them real-time access to control and data from their instruments.
Figure 10. Global Hawk Operation Center (GHOC)
3.1.2 Science: One goal of the science team was to learn more about rapid storm intensification by following severe storms through their entire life cycle, from inception to dissipation. HS3 was able to do just that, with four flights over Hurricane Edouard (Gutro, 2014). That series of flights covered almost the entire life cycle of the storm, beginning with Edouard as a newly formed tropical storm during the first flight. The second flight provided an opportunity to observe rapid intensification from a weak category 1 hurricane into a strong category 2. The third flight provided great data with some well-placed dropsondes in the eye and eye wall of the storm when it was near maximum intensity. The final flight provided sampling of a rapidly weakening hurricane (Figure 11).
Figure 11. HS3 flight plan flight 4 for Hurricane Edouard
Airspace Operations: The HS3 mission operated from both the Atlantic and Pacific coasts, with the majority of activity in the Atlantic and Caribbean regions. The mission required access to both national and international airspace. In 2012, all science flights originated and were controlled from Armstrong Flight Research Center (AFRC) using the GHOC. In 2013 and 2014, Atlantic area flights were controlled from the second GHOC at Wallops Flight Facility (WFF) in Virginia. The aircraft flew from California to the East coast using a transit corridor along the US southern border that was established previously for Air
Force Global Hawk flights. Use of this route and other areas of the NAS were permitted by the FAA through the Certificate of Authorization (COA) process.
For access to international airspace, NASA’s Office of International and Interagency Relations (OIIR) worked through the State Department to communicate with countries in the mission airspace. In 2012-13, formal diplomatic clearances were requested. In 2014, the process was changed. Since science flights were flown only over water in international airspace, diplomatic clearances were not requested; rather, countries were provided notification of the overall plan, mission duration and particulars of the payloads and aircraft; and confirmation of awareness was received. These communications were established with the countries bordering or in the Gulf of Mexico and/or Caribbean, including the countries along the northern coast of S. America and islands near and countries along the coast of northeast Africa. HS3 mission flew in Havana Flight Information Region (FIR), but remained outside of Cuba-controlled airspace (12 nautical miles from the coast). Although not exercised, this would have permitted the aircraft to fly between Cuba and Haiti to reach storms in the southern Caribbean, saving valuable flight time. The notification process served to firm lines of communication for unusual events that affected flight planning, such as the French launch of an Arianne rocket into the Rochambeau FIR in late August 2013.
3.2 Atmospheric Composition Missions
Because of the ability to fly high for long hours, the Global Hawk UAS is ideally suited for studies of the tropical tropopause layer (the region of the atmosphere that controls the composition of the stratosphere). Another Earth Venture mission, Airborne Tropical TRopopause EXperiment (ATTREX), has been flying the Global Hawk to investigate the impact of stratospheric water vapor on Earth’s energy budget and climate, and to predict future changes in stratospheric humidity and ozone as a response to climate change (Jensen, 2013). The team consists of parties from NASA, NOAA, and instrument scientists from many universities and agencies. ATTREX flew 71 hours from California in 2013 and 145 hours from Guam in 2014.
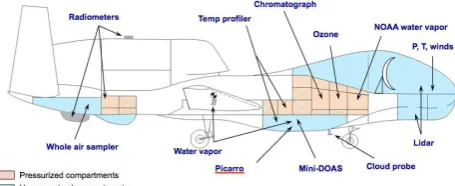
3.2.1 Payload: The ATTREX payload includes 12 in situ and remote sensing instruments that measure water vapor, clouds, multiple gaseous tracers (CO, CO2, CH4, NMHC, SF6, CFCs, N2O), reactive chemical compounds (O3, BrO, NO2), meteorological parameters, and radiative fluxes. A diagram of the payload arrangement is shown in Figure 12. In 2015, the ATTREX team has been joined by the UK Coordinated Airborne Studies in the Tropics (CAST) team to fly additional spectrometer and GHG instrumentation.
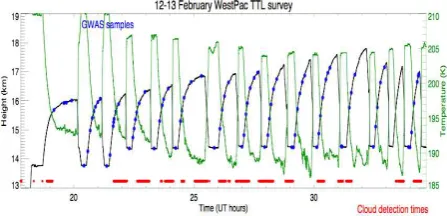
3.2.2 Science: The sampling strategy has primarily involved repeated ascents and descents through the depth of the TTL (about 13-19 km). Over 100 TTL profiles were obtained on each flight series. Note the profiles in Figure 13. The ATTREX dataset includes TTL water vapor measurements with unprecedented accuracy, ice crystal size distributions and habits. The cloud and water measurements provide unique information about TTL cloud formation, the persistence of supersaturation with respect to ice, and dehydration. The tracers measured on the Global Hawk flights are providing unique information about TTL transport pathways and time scales. The meteorological measurements are revealing dynamical phenomena controlling the TTL thermal structure, and the radiation measurements are providing information about heating rates associated with TTL clouds and water vapor.
Figure 13. Repeated profiles through the TTL during ATTREX
3.2.3 Airspace Operations: For the ATTREX mission, as for HS3, AFRC, who operates the Global Hawk, requested and received COAs from the FAA for flights in the NAS. Because the deployments from AFRC flew in the Eastern Pacific from Hawaii down to the equator and off the coast of Central America, and then during the Guam deployment the aircraft flew down to the equator and up off of the coast of Japan, international airspace was involved. For those flights in international air space, the Department of State was involved. For the first three deployments (two at DFRC and one in Guam), ATTREX had to estimate flight locations and which Flight Information Region (FIR) boundaries the aircraft would cross. The project then submitted a request to the Department of State, through the NASA OIIR, to get clearances from those countries in whose regions flights were planned. For the 2015 deployment from AFRC, the process had changed. Department of State stipulated that as long as Global Hawk was not flying over any countries' sovereign soil and was not using any instruments that included lasers and was not dropping anything (i.e., dropsondes), the countries that oversaw the FIRs where the aircraft flew would be properly notified by the flight plans that were filed prior to each flight.
4. UAS OPERATIONS AND TECHNOLOGY ADVANCES
In addition to flight hours, the Airborne Science Program offers payload integration and a wide range of aviation services. These activities are intended to enable science investigators to acquire the measurements and observations they need as efficiently as possible. Several recent capability enhancements include the areas of payload interfaces and on-board data processing, real-time data availability via satellite communications, and flight tracking, along with other real-time information. These capabilities are especially important for UAS missions, where instruments need to operate either autonomously or remotely.
4.1 Payload interfaces and data processing
Along with general payload engineering services, the airborne sensor facility designs and builds custom flight hardware for the
ASP real-time sensor network, includingthe network host and
navigation data server, and the standardized Experiment Interface Panels; as well as payload data systems for the Global Hawk, including the Telemetry Link Module and the Master
Power Control System. Payload IT operations on the Global
Hawks, as well as other aircraft equipped with payload SatCom
systems, are also supported. In fact, much of the payload
support that was first developed for Altair, Ikhana, and Global Hawk has been expanded to all aircraft in the ASP fleet.
4.2 Communications
Several types of airborne satellite communications systems are currently operational on the ASP core science platforms. High bandwidth Ku- and Ka-Band systems, which use large steerable dish antennas, are installed on the Global Hawk and Ikhana UAS, and on the WB-57F. New Inmarsat Broadband Global Area Network (BGAN) multi-channel systems using electronically-steered flat panel antennas are installed on many of the core aircraft. Data-enabled Iridium satellite phone modems are in use on most of the science platforms as well. Although Iridium has a relatively low data rate, unlike the larger systems, it operates at high polar latitudes and is lightweight and inexpensive to operate.
4.3 Mission tools
The NASA Airborne Science Mission Tools Suite (MTS) is a set of web-based capabilities to support airborne missions by providing situational awareness of the aircraft, instruments and environment during flight. MTS represents a ground-based complement to the on-board sensor network described above. Major functions of the MTS are flight tracking, overlay of environmental layers (especially weather), and visualization of any other datasets or model outputs of interest to the scientist. MTS also supports education and outreach through remote access at the Mission Tools for Education website: http://www.nserc.und.edu/outreach/k-12/k-12-1
5. UAS OPERATIONAL CHALLENGES
Despite the unique capabilities that UAS bring to NASA’s ASP portfolio, such as greater-than-12-hour endurance and enabling dangerous missions without putting flight crews at risk, there are challenges to fully integrating them into routine science use, especially when compared to manned aircraft. Three notable challenges are airspace access, cost and reliability.
Costs for UAS science missions are often underestimated and higher than similar manned aircraft missions. For long-duration missions, multiple crews, both for aircraft operations and instruments/science, are required. Payload integration costs can be high because UAS structures are sometimes unique and connection with the aircraft’s communication system for remote monitoring or operation is needed. An additional cost that comes with most NASA UAS missions is for satellite communications (SatCom) for monitoring and/or control of the aircraft. Another cost, not associated directly with the UAS, but at present impacting NASA’s more complex UAS missions, is the cost of adapting sensors for UAS operations. Compared to NASA manned aircraft missions, there are fewer miniaturized and autonomous science-grade instruments and most are new instruments that are undergoing their first aircraft integrations. Reliability is the third challenge. Just as manned aircraft span a very broad spectrum from single seat general aviation aircraft to A380 jumbo jets, NASA science UAS also cover a broad spectrum, as described previously. From the Global Hawk to the hand-launched DragonEye, UAS reliability challenges range from the issues associated with high system complexity to aircraft built from hobbyist’s radio control airplane parts. For the NASA Global Hawks, most of the reliability challenges stem from the complexity of the integrated autonomous functions and the fact that NASA’s been flying early Air Force prototype vehicles. With all NASA UAS, the lack of anti-icing or de-icing have limited some operations. SatCom reliability has also been an issue with those platforms that operate beyond line-of-sight because the aircraft sometimes perform at points in the mission without operator control/and/or situational awareness.
NASA considers all these issues in mission risk evaluations. Three smaller UAS have been lost in the past three years in NASA-affiliated missions. The causes varied in each mission. There were no injuries or lives lost, but project budgets could not absorb these losses of aircraft and specialized sensor systems. No replacement resources were included within each project’s budget because expectations were for successful missions. UAS are not yet on par with manned aircraft reliability, cost, and airspace access and this must be taken into account when formulating science missions. If the mission outcome justifies and the project can afford the risk, UAS are a viable tool for suitable missions for the Earth science community.
6. SUMMARY
Unmanned aircraft systems offer unique advantages for Earth Science by reaching study or monitoring locations that are either inaccessible to manned aircraft or satellites, or by providing improved spatial or temporal data. Very high or very low altitude, long range or long endurance are attractive characteristics of UAS. NASA continues to encourage the development and utilization of UAS for meeting the needs of the Earth Science community.
Cost of operations remains high for high altitude platforms, and partnering with other science agencies is viewed as one avenue to continued progress in the utilization of high altitude UAS. The small UAS world, on the other hand, is exploding with both capabilities and applications not previously imagined. If the Earth science and applied science communities think creatively, while addressing risks, small UAS can become a regular tool in their toolboxes.
REFERENCES
Ambrosia, V. et al., 2011. The Ikhana UAS Western States Fire imaging missions: from concept to reality (2006-2010). Geocarto International Journal, Taylor & Francis Publishing, Vol. 26, No. 2, April 2011, pp. 85-101.
Crocker, R. Ian, et al., 2012. A sensor package for ice surface observations using small unmanned aircraft systems. Geoscience and Remote Sensing, IEEE Transactions on 50.4 (2012) pp. 1033-1047.
English, D., et al., 2014. Hyperspectral remote sensing of shallow coastal waters in the Florida Keys using Unmanned Aircraft Systems (UAS): Initial results from atmospheric correction and glint correction. Ocean Optics XXII Conference, October 2014, Portland ME.
ERAST, 2004. The Promise of ERAST <http://www.nasa.gov/ centers/dryden/news/x-press/stories/102904_people_erast.html> (17 March 2015).
Gutro, R., 2014. NASA’s HS3 looks hurricane Edouard in the eye. < http://www.nasa.gov/content/goddard/nasas-hs3-looks-hurricane-edouard-in-e-eye/> (17 March 2015).
Jensen, E. et al., 2013. The NASA Airborne Tropical TRopopause EXperiment (ATTREX). Stratosphere-troposphere processes and their role in climate (SPARC) newsletter, No. 41, July 2013, pp. 15-24.
Schoenung, S. Wegener, S. and Wagaman, R., 2003. NASA ERAST: Suborbital persistent aircraft needs drive successful low Reynolds number aircraft design and flight demonstration. AIAA white paper, 2003.
Schoenung S. and Albertson, R., 2011. Remote sensing in the Arctic using autonomous sensors developed under NASA’s Airborne Science Program for the International Polar Year. Proceedings 34th ISRSE, Sydney, Australia, April 10-15, 2011.
Tschudi, Mark, et al., 2014. MIZOPEX: A UAS Arctic Campaign During Summer 2013. American Geophysical Union Fall Meeting, San Francisco, California, Dec 2014.
Wegener S. and Schoenung. S., 2003. Uninhabited Aerial Vehicle (UAV) Science Demonstration Project (SDP) Lessons Learned. AIAA 2nd UAV Conference, San Diego, California, Sep 2003.