TRACKING VESSELS TO ILLEGAL POLLUTANT DISCHARGES USING
MULTI-SOURCE VESSEL INFORMATION
J. Busler a, *, H. Wehn a, L. Woodhouse a
a
MDA Systems Ltd., 13800 Commerce Parkway, Richmond, British Columbia, Canada – [email protected]
KEY WORDS: Marine Traffic Monitoring, Automated Information Systems, Oil Spill Tracking
ABSTRACT:
Illegal discharge of bilge waters is a significant source of oil and other environmental pollutants in Canadian and international waters. Imaging satellites are commonly used to monitor large areas to detect oily discharges from vessels, off-shore platforms and other sources. While remotely sensed imagery provides a snap-shot picture useful for detecting a spill or the presence of vessels in the vicinity, it is difficult to directly associate a vessel to an observed spill unless the vessel is observed while the discharge is occurring. The situation then becomes more challenging with increased vessel traffic as multiple vessels may be associated with a spill event. By combining multiple sources of vessel location data, such as Automated Information Systems (AIS), Long Range Identification and Tracking (LRIT) and SAR-based ship detection, with spill detections and drift models we have created a system that associates detected spill events with vessels in the area using a probabilistic model that intersects vessel tracks and spill drift trajectories in both time and space. Working with the Canadian Space Agency and the Canadian Ice Service’s Integrated Satellite Tracking of Pollution (ISTOP) program, we use spills observed in Canadian waters to demonstrate the investigative value of augmenting spill detections with temporally sequenced vessel and spill tracking information.
* Corresponding author
1. INTRODUCTION
Illegal discharge of bilge waters is a significant source of oil and other environmental pollutants in Canadian and International waters (MARPOL, 2003). Coupled with increased vessel traffic, monitoring for oily discharges becomes more challenging as multiple vessels may be associated with a spill event. Governments employ a variety of methods to monitor their waters including use of satellite imaging, vessel traffic monitoring and airborne surveillance.
Within Canada, the Integrated Satellite Tracking of Pollution (ISTOP) program identifies suspected spills and performs ship detection using RADARSAT imagery (Gautier, 2007). ISTOP works in tandem with the Marine Aerial Reconnaissance Team (MART) who collect and report on surface pollutants and ice in Canada’s waters during aerial surveillance operations under Transport Canada’s National Aerial Surveillance Program (NASP) (Spill, 2013). Both agencies collect and report information about potential pollutants observed and vessels located in the vicinity using imagery and self-reported vessel information, such as Automated Information System (AIS).
AIS is an automatic tracking system used on ships and by vessel traffic services for identifying and locating vessels for the purpose of collision avoidance and as a navigational aid. AIS works by electronically exchanging data with AIS base stations that may be located on other ships, land, aircraft or satellites (AIS, 2015). While only required for ships greater than 300 gross tonnes and all passenger ships, it is commonly used for maritime traffic management and tracking. Space-based AIS (S-AIS), where the AIS signals are received using satellites rather than ground or ship systems, is particularly useful for monitoring ship traffic in open water on their
approach to and from coastal areas and far from traditional terrestrial beacons.
Similarly, other vessel tracking systems such as Long-Range Identification and Tracking (LRIT) and Vessel Management System (VMS) also report vessel information and position.
Oily discharges are observed directly using surveillance aircraft or using satellite imagery from Synthetic Aperture Radar (SAR) systems, such as RADARSAT (Brekke, 2005). These spills are detected, recorded and the information is propagated to other authorities for further investigation, evidence gathering and prosecution. Depending on the volatility of the compounds and sea-state, the lifespan of a spill is typically between two and twelve-hours, which makes the timeliness of information critical for agencies responding to a pollutant release.
Due to the dynamics of vessel traffic and spill drift, it nevertheless is challenging to eliminate non-culpable from suspect vessels based on a single ‘snap-shot’ or an isolated detection of a spill. Our work has focussed on combining these multiple sources of data, such as vessel positions, spill detections and drift models, into a system that produces ship tracks, spill tracks and is able to associate detected spill events with vessels in the area using a probabilistic model that intersects vessel tracks and spill drift trajectories in both time and space. With this information, authorities can more quickly focus their investigations.
2. METHOD
To appropriately associate a vessel with a spill of indeterminate age, our model must consider the movement of the ships and the spill in both time and space for a period up to 12 hour prior to the time of spill detection. This requires a hind-cast track to be generated for the observed spill and fore- and hindcast tracks to be generated for all vessels entering an Area of Interest around a spill. These tracks can then be used to assess which ships are least and most likely to intersect with the drifting spill. These results can be used to generate text alerts and displayed using a geographical visual interface, such as a GIS system or Google Earth.
2.1 Ship Tracking
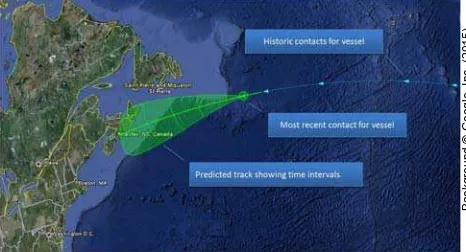
The ability to accurately predict the track of a ship or to extrapolate a ship track into the past or future is a key capability for any maritime surveillance system. Ship positions can be derived from AIS reports, LRIT reports and detections from RADARSAT images, where each ship position record is discrete with a positional uncertainty. However, different reporting requirements and inherent data latencies introduce gaps in the positional information available, thus ship tracks must be interpolated between the different sources of positional reports and the accuracy of track assessed based uncertainty associated with each point and time since the last report. Because the data record is also finite, it is also necessary to predict the ship position beyond the start or end of the available position data. Figure 1 illustrates the ship track generation for known and predicted locations.
Figure 1. Conceptual Display for Ship Position Prediction
Our ship tracker employs Bayesian probability analysis using the ship position, heading and speed with a great circle economic motion constraint to derive a track, track uncertainty and 10-hour track prediction beyond the available data record. This study explores ship position data sources suitable for open waters, thus a great circle prediction is appropriate. Additional track constraints for land avoidance and destination port were not considered as part of this study.
2.2 Spill Tracking
Oil spill modelling and tracking is a complex task that considers the interaction of various natural phenomena in order to predict the trajectory of an oil spill. The dominating forces are:
Weathering (evaporation, dispersion, emulsification, dissolution, biodegradation)
• Winds speed • Surface currents
• Turbulence (spreading, horizontal diffusion)
For this study, we used an existing spill modelling tool, General NOAA Operational Modeling Environment (GNOME) (NOAA, 2002). It uses a Lagrangian particle-tracking technique to segment the spill into discrete groupings and models how they are displaced according to the combined effect of the current field, wind field, and the spreading or dispersion mechanism.
A spill detection polygon is used as an input and GNOME models the 12-hour hindcast trajectory for the spill using regional environmental data for surface wind and currents available from publically available sources prepared by weather and oceanographic agencies. Uncertainty in the spill track is derived from variations in the GNOME trajectories caused by the uncertainties in the input data. From these, we derive a hindcast track and spill boundary polygons that represent the positional uncertainty associated with the spill location.
2.3 Ship-Spill Associations
Using the ship tracks and spill tracks described above, we calculate the probability that each candidate ship track intersects the spill track in space and time. By dividing up the Area of Interest into tiles, we can calculate the probability that the ship and spill are coincident within a given tile over the 12-hour hindcast period from time of detection. This probability is weighted based on the uncertainty associated with the ship and spill at that time interval within its modelled track. Because ships typically discharge while in motion, spills often have an elongated shape. As a result, ship tracks that match the spill directionality are favoured. Following the joint probability analysis, the candidate vessels are subsequently ranked according to its probability score.
In scoring the candidate vessels, infeasible vessels are automatically eliminated and more feasible vessels are highlighted. Results are stored in a text table and incorporated along with ship and spill data into a Keyhole Mark-up Language (KML) file to be viewed and interpreted further by analysts.
We are limited to demonstrate the capability of making spill-ship associations for vessels that have valid position information from either AIS, SAR detections and LRIT. Vessels not captured by one of these data sources are left for future development.
3. DATA
A total of 21 test cases were constructed using confirmed and unconfirmed anomalies observed by ISTOP and MART between 2009 and 2011. To preserve the anonymity of the vessels, the vessel names and date of the detected anomaly have been changed for the two test cases discussed in the paper. All data used and generated by the system was automatically ingested and stored in a relational database which uses geographical information to optimize spatial search queries.
For the ship tracks, ship positional information was assembled from S-AIS data, collected by ExactEarth Inc. and provided courtesy of the Canadian Space Agency. SAR ship detections were provided by ISTOP.
To generate the spill track, spill polygons were provided by ISTOP and MART as shapefiles. Inputs for GNOME included environmental data for sea winds and surface currents provided in various products that are publically available. The different data products, their spatial and temporal coverage and resolution are summarized in Table 1. Of particular interest are the National SAR Winds products derived by Environment Canada, as they provide wind data derived from the same RADARSAT scene in which an anomaly may be detected. In cases where, due to lack of coverage or data latency, observed data could not be used, derived mean data for wind or current are used instead.
4. RESULTS
Our test scenarios are based on real data with dates and vessel names changed. Where times are noted, they are in Universal Coordinated Time (UTC) and results are displayed in Google Earth. All test data is historical, which means there may be additional information regarding the culpable party and a full AIS data record can be used for verification purposes. However, for the purposes of the study, we simulate a near real-time analysis window by limiting the vessel position data to the time of detection. All scenarios run automatically from start to finish once provided with a spill polygon. By necessity, the graphics in this paper are ‘snap shot’ views of a dynamic and interactive visualization interface, which allows operators to explore the data and derived information in more detail to derive conclusions.
4.1 Test Case 1
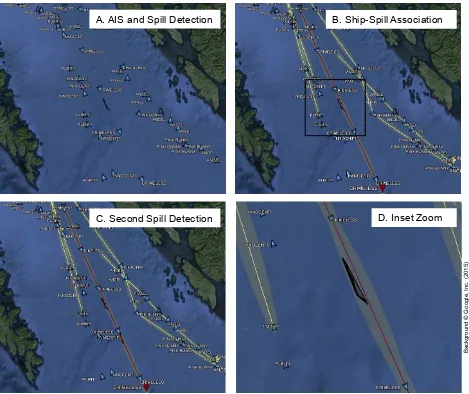
Test Case 1 is for an anomaly observed off the Pacific Coast of Canada. The anomaly is detected at 15:03 UTC. The system defines an Area of Interest (AOI) around the detection and queries the database for relevant ship position information and environmental data. Figure 2A captures the initial view of the detected spill polygon in black and S-AIS records as blue arrows for ships passing through the AOI within 12 hours prior to the spill. The direction of the blue arrow indicates heading as listed in the AIS data and each arrow is annotated with the ship name. This view illustrates the ‘snap-shot’ achieved by
simply combining a spill detection with 12 hours of AIS data. From this view, it is clear there is vessel traffic in the area with tracks that may align with the observed spill but it is less clear which track aligns best in time.
Figure 2B shows the ship-spill association result. For each vessel, a mean track is shown with a solid line. The uncertainty in the track is displayed as a semi-transparent region around the mean track and indicates the possible variation in the actual track between AIS records. For Test Case 1, the detected spill aligns in space and time with the track for the ship named “Crimeless” between S-AIS records at 12:32 UTC and 13:36 UTC. Other tracks which pass near the observed spill location in the 12 hours prior to detection do not sufficiently intersect the drift track calculated by GNOME to be feasible and are thus eliminated. The “Crimeless” track is highlighted in red to indicate its spatial and temporal history best aligns with the spill shape and drift. Based on this ship’s track history, the system calculates that the spill occurred approximately 2.2 hours prior to the detection at 15:03 UTC.
By zooming the view to the spill location, as shown in Figure 2D, spatial uncertainty in the ship track, shown in transparent yellow, and the spill drift track, shown in semi-transparent black, become more readily visible.
As this is a historical test case, we can consider additional information that is purposefully omitted from data used by the ship-spill association. In this case, we have a second detected spill which overlaps with the “Crimeless” AIS position at 13:36 UTC, shown in Figure 2C. This second spill allows us to independently corroborate the first detection and further verify the ship-spill association model. However, from reports associated with this detection, we have confirmed that the correct vessel was identified by the ship-spill association algorithm.
For Test Case 1, the spill readily aligns with an interval between two AIS records and there is no other traffic passing within the uncertainty of this ship’s track or the spill track. This makes the association strong and conclusive both for the ship-spill association but also for the operator. This test case shows the elements of the solution and demonstrates the ship-spill association within the context of a simple and uncomplicated scenario.
Product Latitude Longitude Spatial Resolution Type Temporal Resolution
NOAA Blended Sea Winds (Zhang, 2006)
National SAR Winds (Zabeline, 2011)
Image specific Image specific 1 km Wind Image specific
NOAA Ocean Surface Current Analyses – Real time (ESR, 2009)
-66°N to 66°S 180°W to 180°E 1/3° Current 5 days
HYCOM + NCODA Global 1/12° Analysis (HYCOM, 2012)
47°N to 78°S 180°W to 180°E Mercator grid with 1/12° equatorial
resolution
Current 1 day
4.2 Test Case 2
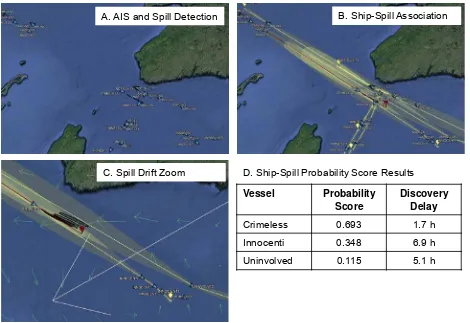
Test Case 2 is an example with a more complex vessel traffic scenario with a large S-AIS data gap. In this scenario, an anomaly is observed at 16:42 UTC on the Atlantic Coast of Canada. A query for vessel traffic indicates several vessels in the area but there is also an 8 to 12 hour data gap in S-AIS data record, which is not uncommon. This data gap results in a larger uncertainty associated with each vessel track. Additionally, there is significant movement in the spill track such that it falls within the path of three ships: “Crimeless,” “Innocenti” and “Uninvolved”.
Figure 3A captures the view with the detected spill and AIS positions for the ships that travel through the detection Area of Interest. Figure 3B displays the ship-spill association result with vessel tracks and track uncertainty. The ship “Crimeless” is highlighted in red as the vessel most-likely associated with the spill. If considering only a ‘snap-shot’ view with ship positions and spill location, the operator could visually eliminate several vessels but it remains difficult to resolve the ambiguity in the tracks and spill drift without further inspection or additional analysis.
Figure 3C shows a zoomed view of the spill, its hindcast locations in 3 hour intervals as semi-transparent black spill uncertainty polygons, and the mean track and track uncertainty for the three most likely vessels. This zoomed view also confirms that the drift trajectory from GNOME is consistent with the current direction (green arrows) and wind direction (white arrow). The increasing size of the spill polygon is a reflection of the increased uncertainty in its location and not the extent.
Although there is visual ambiguity, the probability analysis considers the temporal and spatial relationships and draws a strong conclusion in favour of “Crimeless.” Probability scores and Discovery Delay for the three vessels are shown in Figure 3D. Discovery Delay is the time interval between the spill observation time and the intersection with the vessel track.
For Test Case 2, the vessel responsible for the observed anomaly was undiscovered due to the complexities of the situation. However, operators observed that using the ship-spill association would have substantially reduced the number of potential vessels in a time-frame to influence their investigative efforts.
A. AIS and Spill Detection
B. Ship-Spill Association
C. Second Spill Detection
D. Inset Zoom
Figure 2. Ship-Spill Association Results for Test Case 1
Backgr
o
und © Googl
e, Inc. (
2
5. CONCLUSIONS
This work successfully demonstrates that the functionality and utility of combining ship track and track prediction information with oil spill drift models can be used to aid in the association of vessels with observed spills. This aids operators in their search for causation by eliminating highly unlike vessels and focussing ongoing investigative efforts on most probable scenarios in an automated fashion, which is beneficial as it makes use of multiple sources of information available and assists with directing efforts needed to gather the evidence that may lead to prosecution. While the ship-spill association consolidates the search space, the spatial-temporal visualization interface provides the operator the opportunity to explore information in the hours immediately preceding and following a detected spill.
The computational efficiency of the database structure, data ingestion feeds and association model support the need for near real-time operation. For our test cases, the greatest challenge is the data latency for environmental data, which could have delays up to 24 hours. To mitigate this, we incorporated monthly averages to facilitate meaningful spill tracks in the absence of recently observed data and recommend accessing a real-time data feed, repeating the spill track model with updated current or wind data or using forecast data. Gaps in ship positional information are mitigated using a robust tracking tools and through combining multiple self-reporting vessel information with SAR ship detections.
ACKNOWLEDGEMENTS
Funding for this work and S-AIS data has been provided by the Canadian Space Agency through the Earth Observation Application Development Program (contract 9F043-110241/003/MTB). We also gratefully acknowledge the support, expertise and insights provided by Environment Canada scientists and technologists at the Canadian Ice Service and Maritime Aerial Surveillance Team.
REFERENCES
AIS Transponders, 2015. International Maritime Organization http://www.imo.org/OurWork/Safety/Navigation/Pages/AIS.aspx (22 Jan. 2015).
Brekke, C., and A. H. Solberg, 2005. Oil spill detection by satellite remote sensing. Remote sensing of environment, 95(1), pp. 1-13.
Gauthier, M-F., L. Weir, Z. Ou, M. Arkett and R. De Abreu, 2007. Integrated Satellite Tracking of Pollution: A New Operational Program. IEEE, IGARSS Proceedings, pp. 967-970.
ESR. 2009. OSCAR third degree resolution ocean surface currents. Ver. 1. PO.DAAC, CA, USA. Dataset accessed (14 Feb. 2014).
HYCOM, 2012. Hybrid Coordinate Ocean Model. National Ocean Partnership Program. Dataset accessed (14 Feb. 2014).
Vessel
Probability
Score
Discovery
Delay
Crimeless
0.693
1.7 h
Innocenti
0.348
6.9 h
Uninvolved
0.115
5.1 h
A. AIS and Spill Detection
B. Ship-Spill Association
D. Ship-Spill Probability Score Results
C. Spill Drift Zoom
Figure 3 Ship-Spill Association Results for Test Case 2
Backgr
ound © Googl
e
, Inc. (
2
Kalnay, E., M. Kanamitsu, R. Kistler, W. Collins, D. Deaven, L. Gandin, and D. Joseph, 1996. The NCEP/NCAR 40-year reanalysis project, Bulletin of the American Meteorological Society, 77(3), pp. 437-470.
MARPOL, 2003. International Convention for the Prevention of Pollution from Ships Annex I – IV. International Maritime Organization.
http://www.imo.org/OurWork/Environment/PollutionPrevention/ Pages/Default.aspx (17Oct. 2011).
NOAA, 2002. General NOAA Oil Modeling Environment User’s Manual. National Oceanic and Atmospheric Administration http://response.restoration.noaa.gov/gnome (12 Mar. 2015).
Spill Prevention: National Aerial Surveillance Program, 2007. Transport Canada https://www.tc.gc.ca/eng/marinesafety/oep-ers-nasp-2195.htm (22 Jan. 2015).
Zabeline, V., L. Neil, W. Perrie, P.W. Vachon, C. Fogarty, S.K. Khurshid, and B. Zhang, 2011. RADARSAT application in ocean wind measurements. IEEE. IGARSS Proceedings, pp. 3622-3625.