Full Terms & Conditions of access and use can be found at
http://www.tandfonline.com/action/journalInformation?journalCode=vjeb20
Download by: [Universitas Maritim Raja Ali Haji] Date: 11 January 2016, At: 19:18
Journal of Education for Business
ISSN: 0883-2323 (Print) 1940-3356 (Online) Journal homepage: http://www.tandfonline.com/loi/vjeb20
Faculty Perceptions of the Adoption and Use of
Clickers in the Legal Studies in Business Classroom
Denise M. Farag, Susan Park & Gundars Kaupins
To cite this article: Denise M. Farag, Susan Park & Gundars Kaupins (2015) Faculty Perceptions of the Adoption and Use of Clickers in the Legal Studies in Business Classroom, Journal of Education for Business, 90:4, 208-216, DOI: 10.1080/08832323.2015.1014459
To link to this article: http://dx.doi.org/10.1080/08832323.2015.1014459
Published online: 16 Mar 2015.
Submit your article to this journal
Article views: 53
View related articles
Faculty Perceptions of the Adoption and Use of
Clickers in the Legal Studies in Business Classroom
Denise M. Farag
Linfield College, McMinnville, Oregon, USA
Susan Park and Gundars Kaupins
Boise State University, Boise, Idaho, USA
The use of clickers in the classroom can improve student engagement and motivation. However, few studies have been conducted on faculty opinions of the use of clickers. The authors measured clicker use in legal studies among business faculty and investigated perceptions and factors associated with the adoption of clickers in the discipline. Survey results indicate that most legal studies in business faculty have either never used or rarely use clickers, and that very few faculty members in the discipline use clickers regularly. Instructors perceive that clickers can improve teaching, but may be reluctant to adopt them because of time constraints.
Keywords: clickers, higher education, legal studies in business, student response systems, teaching with technology
Much research has focused on the use of clickers in higher education. There is a plethora of articles regarding how clickers can be used (Barber & Njus, 2007; Easton, 2009) or on student perceptions of clickers (Caldwell, 2007). Pre-vious researchers have analyzed student perceptions of clickers in science (Duncan, 2005), physics (Reay, Bao, Li, Warnakulasooriya, & Baugh, 2005), and K–12 (Penuel, Boscardin, Masyn, & Crawford, 2007) courses. However, less research has been done on faculty perceptions of clicker use. Lincoln (2008) and Lewis (2013) provided two of the few empirical surveys in a business-related field that focuses on faculty perceptions regarding the adoption and use of clickers. Park and Farag (2015) and Easton (2012) found a dearth of literature concerning instructor percep-tions of clickers and how clickers could be used in legal studies in business education. Using clickers in legal studies in business courses can be an effective teaching tool. They can help instructors assess student knowledge of important laws, as well as student opinions about legal topics and future policy (Park & Farag, 2015). Here we assessed legal studies of business faculty perceptions regarding clickers in
light of existing research on clickers. The results of this study, which provide deeper understanding of existing per-ceptions about the use of clickers within the discipline, may help instructors make better decisions about using this, and other, teaching technologies.
LITERATURE REVIEW
Students often have difficulty paying attention through an entire traditional classroom lecture. Research suggests that students can pay attention for an average of 10–20 min dur-ing a lecture before their attention declines (Sousa, 2011; Wilson & Korn, 2007). University instructors have employed several strategies to help students stay engaged in the classroom. One increasingly popular teaching tool involves classroom response systems, or clickers (Fies & Marshall, 2006). Clickers generally consist of three compo-nents: (a) a wireless handheld clicker device itself that often contains a keypad permitting students to respond to infor-mation requested by instructors, (b) the instructor’s receiver that connects to a classroom or laptop computer, and (c) clicker software. Clicker software is used to create and pose questions. It can be integrated with presentation soft-ware such as PowerPoint, and with learning management
Correspondence should be addressed to Denise M. Farag, Linfield Col-lege, Business Department #A478, 900 SE Baker Street, McMinnville, OR 97128, USA. E-mail: dfarag@linfield.edu
ISSN: 0883-2323 print / 1940-3356 online DOI: 10.1080/08832323.2015.1014459
systems such as Blackboard (Barber & Njus, 2007; Cald-well, 2007). Students send responses to the questions via their clickers, which provide faculty with immediate input to assess their level of understanding and opinions. Instruc-tors can summarize the data on bar charts or graphs within seconds (Lantz, 2010; Lincoln, 2009; Yourstone, Kraye, & Albaum, 2008). Other common uses of clickers include assessing prior learning, testing student engagement with assigned reading, providing feedback, breaking up lecture sessions, administering summative assessments, promoting peer learning, monitoring attendance, and fostering a sense of community (Easton, 2009).
An increasing volume of research articles discusses the various uses and benefits of clickers in the higher education classroom based on student perceptions (Good, 2013). Based on surveys of students, clicker use in the classroom offers several advantages. Clickers can make class more enjoyable (Carnaghan & Webb, 2007; Ghosh & Renna, 2009; Taneja, 2009), increase student engagement and motivation (Bojinova & Oigara, 2013; Eastman, Iyer, & Eastman, 2011; Ghosh & Renna, 2009; Taneja, 2009), and create a positive learning environment (Kay & LeSage, 2009; Mareno, Bremner, & Emerson, 2010). Clickers have been shown to improve college English listening and speak-ing skills (Yu, Chen, Kong, Sun, & Zheng, 2014) and stu-dent attitudes toward technology (Eastman et al., 2011). Students report that clickers help to provide them feedback and to understand theory underlying the topic they are studying (Camacho-Mi~nano & del Campo, 2014).
Research also has revealed several disadvantages related to the use of clickers. For instance, some studies indicate a lack of performance differences between students who use clickers in the classroom versus those who listen to traditional lectures in the classroom (Carnaghan, Edmonds, Lechner, & Olds, 2011; Patterson, Kilpatrick, & Woebkenberg, 2010; Tlhoaele, Hofman, Naidoo, & Winnips, 2014). One study concluded that the use of clickers does not result in higher grades (Llorens et al., 2014). Technology-based problems (e.g., clickers or software not working) and increased costs to students are also cited in the literature (Mareno et al., 2010).
Despite the possible disadvantages, “[c]licker technol-ogy presents an unrivalled opportunity to develop an engaged community of conceptually-focused, problem-solving legal learners but this can only be achieved through the engagement and commitment of managers, lecturers and ultimately the students themselves” (Easton, 2009).
While much has been written about clickers in higher education, few academic articles involve surveys of faculty perceptions of clickers in business education courses. Lincoln’s (2008) study on clickers revealed the results of a survey of marketing educators based on the Unified Theory of Acceptance and Use of Technology (UTAUT), which has been the basis of numerous studies focused on identify-ing factors that impact technology acceptance and use. According to Venkatesh, Morris, Davis, and Davis (2003),
UTAUT is an empirically validated model consisting of 26 variables. The model helps explain about 70% of the vari-ance in an educator’s acceptvari-ance and use of technology. The questions in Lincoln’s UTAUT-based study cover per-formance expectancy (e.g., “Clickers are useful for my teaching”), effort expectancy (e.g., “Learning how to oper-ate clicker systems is easy”), social influence (e.g., “Our students expect faculty to teach with clickers”), facilitating conditions (e.g., “I have the resources necessary to teach with clickers”), self-efficacy (e.g., “An on-campus person is readily available to assist me with clicker difficulties”), attitude toward technology (e.g., “Teaching with clickers is a good idea”), and anxiety (e.g., “I feel apprehensive about teaching with clickers”). The four moderating factors include gender, age, experience, and voluntariness of use (Venkatesh et al., 2003). The combination of the key deter-minants and the moderating factors have been found to sig-nificantly predict intention to use technology.
Lincoln (2008) found that “Teaching with clickers increases my classroom preparation time” was a statement that clicker users and nonusers agree on the most. However, users agreed with the statement significantly (p<.01) higher
than nonusers. “Teaching with clickers is a good idea” also had strong agreement from users and nonusers but users’ agreement was significantly (p<.05) higher than nonusers.
The statement with the least agreement was “I teach with clickers because my colleagues do.” Nonusers had signifi-cantly (p < .01) higher agreement than users. Lincoln also
collected information about respondent gender, years of teaching experience, and university size among campuses throughout the United States, but this information was not correlated with the 26 UTAUT questions.
Lewis, Fretwell, Ryan, and Parham (2013) also used the UTAUT model to survey business faculty members at one southeastern university through an online instrument. They found that the relationship between performance expec-tancy and effort expecexpec-tancy to use classroom technology was stronger for men. Men tend to be more task-oriented and focus on task accomplishment. The study focused on classroom technology in general rather than clickers and did not study the relationship of respondent demographic characteristics to the model’s questions other than gender.
Others have studied respondent demographic character-istics in relationship to classroom technology. For example Agbatogun (2001) found a positive relationship between perceptions of e-learning and faculty years of teaching experience. Similarly, Paver, Walker, and Hung (2014) found a positive relationship between perceptions of class-room technology and faculty years of teaching experience. According to Allen and Seaman (2012), women report more communication with students through the use of tech-nology but also experience more stress than men. Peluch-ette and Rust (2005) found that female faculty members were more concerned about time constraints associated with classroom technology. Xu and Meyer (2007) found
FACULTY PERCEPTIONS OF CLICKERS IN LEGAL STUDIES IN BUSINESS 209
that more productive faculty use technology to help them be more productive. Grasha and Yangarber-Hicks (2000) linked an instructor’s feelings of competence with the deci-sion to use technology in the classroom. Rosseau and Rog-ers (1998) found that older faculty membRog-ers tend to use fewer new technologies. Smaller classes are associated with more faculty satisfaction and support for the use of technology (Carr, 2000). Spotts, Bowman, and Mertz (1997) found that female faculty had higher ratings than male colleagues in their perceptions of classroom technol-ogy ease of use, increased student learning, and time needed to learn how to use a technology.
RESEARCH OBJECTIVES
Given the lack of research on faculty opinions of clickers, in this study we addressed the following research objectives:
(a) To obtain a baseline measure of the prevalence of clicker usage by legal studies in business faculty; (b) To examine the factors associated with adoption and
usage of clickers by legal studies in business educa-tion instructors using variables in the UTAUT model; and
(c) To uncover patterns of perceptions related to the use of clickers for teaching in legal studies in business courses relative to other factors, such as gender, aca-demic rank, and years of teaching experience.
METHODOLOGY
As Lincoln (2008) did previously, we concluded that the UTAUT would provide a comprehensive framework for predicting the conditions under which clicker technology adoption by legal studies in business faculty is likely to emerge. Thus, the survey instrument used to gather the data reported on in this study was based on UTAUT.
The UTAUT-based electronic survey developed for this study was administered through Qualtrics Survey (Provo, UT) software. The electronic survey, intended to collect data from clicker users and nonusers, was sent to the mem-bership of the Academy of Legal Studies in Business (ALSB), an organization comprised of legal studies faculty who teach undergraduate and graduate business law-related courses. The ALSB has approximately 912 members (Academy of Legal Studies in Business, 2014). Data were collected in January, 2014, from 106 ALSB legal studies faculty who responded to the survey request. Results from the survey were then tabulated and analyzed.
RESULTS
Demographics
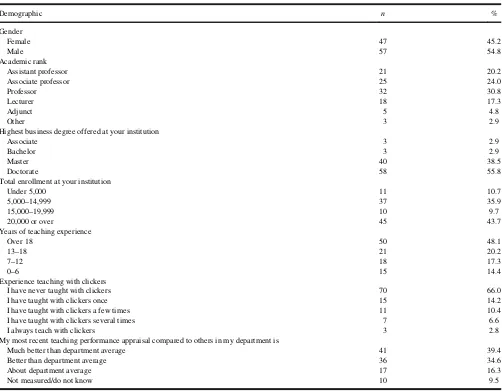
The sample, shown in Table 1, consisted mostly of men (54.8%) who were assistant, associate, and full professors (75.0%) with more than 13 years of teaching experience (68.3%), but most having no teaching experience with clickers (66.0%). Most respondents reported self-ratings of teaching better than department average (74.0%). A major-ity of survey participants taught at schools having doctorate programs (55.8%) with enrollments of 15,000 or more (53.4%).
As shown in Table 2, the highest degree offered at a respondent’s institution correlated significantly (p <.01)
with total enrollment at that institution. This result makes intuitive sense because larger schools would likely have more resources for higher degrees. The high-est degree offered at the respondent’s institution and gender were significantly (p < .01) correlated with the respondent’s performance appraisal perceptions. Female instructors tended to lower their perceptions of their per-formance appraisals.
Opinions About Clickers
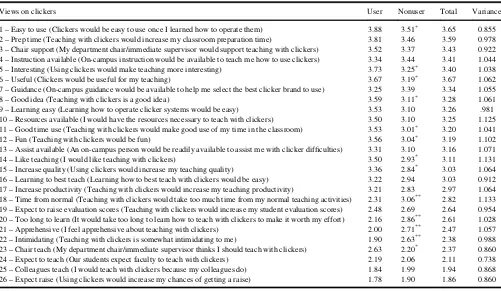
Table 3 shows the level of agreement clicker users and non-users had with the 26 UTAUT statements concerning the use of clickers. On a 5-point Likert-type scale ranging from 1 (strongly disagree) to 5 (strongly agree), the statement with the strongest agreement was “Clickers would be easy to use once I learned how to operate them” (3.65 rating). The second highest was “Teaching with clickers would increase my classroom preparation time” (3.59 rating). Statements with the most respondent disagreement were “Using clickers would increase my chances of getting a raise” (1.86 rating) and “I would teach with clickers because my colleagues do” (1.94 rating).
Nonusers appear to support negative opinions about clickers more strongly than users. For example, nonusers rated Statement 20 (“It would take too long to learn how to teach with clickers”), Statement 21 (“I feel apprehensive about teaching with clickers”), and Statement 18 (“Teaching with clickers will take too much time”) signifi-cantly higher (p<.01) than users. There were a few signifi-cant (p<.05) differences between users and nonusers when the statements were positive about clickers. Users tended to rate statements such as Statement 5 (“Using clickers would make teaching more interesting”) significantly (p < .05) higher than nonusers.
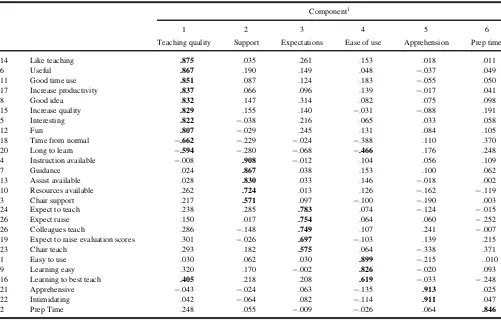
Factor Analysis
The 26 statements concerning clickers can be narrowed to a few dimensions based on a factor analysis. Factor analysis
results in Table 4 show six dimensions based on the princi-pal components method and varimax rotation. Variables with factor loadings of .4 or higher counted for the dimensions.
Teaching quality was the dimension associated with the most statements. With eleven statements loading on this
dimension, the average unweighted scores concerning agreement with the statements was 3.09. The highest loaded statements were “Teaching with clickers is a good idea” (.892) and “I would like teaching with clickers” (.875). The overall average score for statements loading at least§.4 on this factor was 3.19.
TABLE 1
Demographic Characteristics
Demographic n %
Gender
Female 47 45.2
Male 57 54.8
Academic rank
Assistant professor 21 20.2
Associate professor 25 24.0
Professor 32 30.8
Lecturer 18 17.3
Adjunct 5 4.8
Other 3 2.9
Highest business degree offered at your institution
Associate 3 2.9
Bachelor 3 2.9
Master 40 38.5
Doctorate 58 55.8
Total enrollment at your institution
Under 5,000 11 10.7
5,000–14,999 37 35.9
15,000–19,999 10 9.7
20,000 or over 45 43.7
Years of teaching experience
Over 18 50 48.1
13–18 21 20.2
7–12 18 17.3
0–6 15 14.4
Experience teaching with clickers
I have never taught with clickers 70 66.0
I have taught with clickers once 15 14.2
I have taught with clickers a few times 11 10.4
I have taught with clickers several times 7 6.6
I always teach with clickers 3 2.8
My most recent teaching performance appraisal compared to others in my department is
Much better than department average 41 39.4
Better than department average 36 34.6
About department average 17 16.3
Not measured/do not know 10 9.5
TABLE 2
Correlations Between Demographic Variables
1 2 3 4 5 6 7
Gender (1) ¡.032 .088 .084 ¡.085 .078 ¡.270**
Academic rank (2) .152 .083 ¡.042 ¡.112 ¡.080
Highest degree offered at your institution (3) .338** ¡.088 ¡.099 ¡.286** Total enrollment at your institution (4) .028 .009 ¡.187
Years of teaching experience (5) .027 .217*
Experience teaching with clickers (6) .050
Performance appraisal compared to others (7)
*p<.05. **p<.01.
FACULTY PERCEPTIONS OF CLICKERS IN LEGAL STUDIES IN BUSINESS 211
The second dimension relates to support respondents receive in using clickers. The highest loading statements were “On-campus instructors would be available to teach” (.908) and “Have on-campus support to select the best clicker to use” (.867). The average score of the statements loading onto this factor was 3.31.
The third dimension involves respondent expectations with clickers, such as getting a raise and improving student evaluation scores. The highest loaded statement was “Clickers would be easy to use once I learned how to oper-ate them” (.783). The average score of stoper-atements loading on this dimension was 2.18. This was the lowest score among all dimensions.
The fourth dimension was ease of use. The highest loaded statement (of three) was “Learning how to best teach with clickers would be easy” (.899). The average score of the three statements loading on this dimension was 3.31.
The fifth dimension was apprehension regarding clicker use. The highest loaded statement was “I feel apprehensive about teaching with clickers” (.913). The average score of the statements was 2.42.
The sixth dimension was preparation time to use click-ers. Dimension 6 featured “Teaching with clickers would increase my class preparation time” with a .846 loading. The statement had a 3.59 score which makes this
dimension’s average (in this case, a single measure) the highest among the six dimensions.
Regression Analysis
The 26 UTAUT statements were organized by factors for the linear regression analyses shown in Table 5. The 26 UTAUT statements consisted of the dependent variables and demographic variables concerning gender, academic rank, highest business degree offered at the respondent’s institution, total enrollment at the respondent’s institution, years of teaching experience, respondent experience teach-ing with clickers, and teachteach-ing performance appraisal rat-ings compared to others in the department.
Results showed that clicker experience for all but one variable within the teaching quality factor showed signifi-cant values. Those with greater clicker experience tended to support that teaching quality improved with clickers. Clicker experience also had a significant positive associa-tion with a percepassocia-tion regarding ease of use (Factor 4) and significant negative association with apprehension toward clickers (Factor 5).
Other independent variables had much fewer associa-tions with dependent variables. Having a higher degree was significantly associated with some of the teaching quality
TABLE 3
User and Nonuser Views on Clickers
Views on clickers User Nonuser Total Variance
1 – Easy to use (Clickers would be easy to use once I learned how to operate them) 3.88 3.51* 3.65 0.855 2 – Prep time (Teaching with clickers would increase my classroom preparation time) 3.81 3.46 3.59 0.978 3 – Chair support (My department chair/immediate supervisor would support teaching with clickers) 3.52 3.37 3.43 0.922 4 – Instruction available (On-campus instruction would be available to teach me how to use clickers) 3.34 3.44 3.41 1.044 5 – Interesting (Using clickers would make teaching more interesting) 3.73 3.25* 3.40 1.038 6 – Useful (Clickers would be useful for my teaching) 3.67 3.19* 3.67 1.062 7 – Guidance (On-campus guidance would be available to help me select the best clicker brand to use) 3.25 3.39 3.34 1.055 8 – Good idea (Teaching with clickers is a good idea) 3.59 3.11* 3.28 1.061 9 – Learning easy (Learning how to operate clicker systems would be easy) 3.53 3.10 3.26 .981 10 – Resources available (I would have the resources necessary to teach with clickers) 3.50 3.10 3.25 1.125 11 – Good time use (Teaching with clickers would make good use of my time in the classroom) 3.53 3.01* 3.20 1.041 12 – Fun (Teaching with clickers would be fun) 3.56 3.04* 3.19 1.102 13 – Assist available (An on-campus person would be readily available to assist me with clicker difficulties) 3.31 3.10 3.16 1.071 14 – Like teaching (I would like teaching with clickers) 3.50 2.93* 3.11 1.131 15 – Increase quality (Using clickers would increase my teaching quality) 3.36 2.84* 3.03 1.064 16 – Learning to best teach (Learning how to best teach with clickers would be easy) 3.22 2.94 3.03 0.912 17 – Increase productivity (Teaching with clickers would increase my teaching productivity) 3.21 2.83 2.97 1.064 18 – Time from normal (Teaching with clickers would take too much time from my normal teaching activities) 2.31 3.06** 2.82 1.133 19 – Expect to raise evaluation scores (Teaching with clickers would increase my student evaluation scores) 2.48 2.69 2.64 0.954 20 – Too long to learn (It would take too long to learn how to teach with clickers to make it worth my effort) 2.16 2.86** 2.61 1.028 21 – Apprehensive (I feel apprehensive about teaching with clickers) 2.00 2.71** 2.47 1.057 22 – Intimidating (Teaching with clickers is somewhat intimidating to me) 1.90 2.63** 2.38 0.988 23 – Chair teach (My department chair/immediate supervisor thinks I should teach with clickers) 2.63 2.20* 2.37 0.860 24 – Expect to teach (Our students expect faculty to teach with clickers) 2.19 2.06 2.11 0.738 25 – Colleagues teach (I would teach with clickers because my colleagues do) 1.84 1.99 1.94 0.868 26 – Expect raise (Using clickers would increase my chances of getting a raise) 1.78 1.90 1.86 0.860
Note: Responses were rated on a 5-point Likert-type scale ranging from 1 (strongly disagree) to 5 (strongly agree). *p<.05. **p<.01.
(Factor 1) variables. The perception that using clickers was a good idea and would increase quality had the strongest positive association. Perceptions of performance appraisal ratings were positively associated with some teaching qual-ity variables (Factor 1). Teaching experience had some sig-nificant positive associations with perceptions of ease of use (Factor 4). Independent variables with no significant results include gender, academic rank, and highest degree offered at the respondent’s institution.
DISCUSSION
Experience with clickers appears to be the most significant of the variables associated with perceptions of the many UTAUT statements about clickers. There was a particularly high association between clicker experience and percep-tions of teaching quality associated with clickers. This out-come is noteworthy—teachers who use clickers positively associate their use with teaching quality. The most differen-ces between users and nonusers related to the amount of time expected to learn to teach with clickers, as well as apprehension and intimidation regarding learning to use
them. This result may be due to nonusers’ lack of experi-ence with clickers. It may also be because they use other classroom technologies, or that other priorities, such as research and teaching, may be higher.
Teaching experience showed significant positive associa-tions with ease of use. The result makes some intuitive sense because veteran instructors might know how to use a wide variety of teaching tools—incorporating a new teaching tech-nique might be easier for those instructors. Further indication of experienced instructor support for ease of use is that they significantly disagreed with Statement 20—”It would take too long to learn how to teach with clickers to make it worth my effort.” Though this statement falls under Factor 1 (teach-ing quality), it also may be reflective of expectations that indi-cate they believe learning to use clickers will be easy.
The highest degree offered at the respondent’s institution was positively (and in some cases significantly) associated with Factor 1 (teaching quality) variables. It would be worth investigating whether schools with doctoral degrees encourage a wide variety of technology as opposed to schools without graduate degrees.
Though having high degree programs and a large school enrollment are highly correlated, high degree programs
TABLE 4 Factor Analysis
Component1
1 2 3 4 5 6
Teaching quality Support Expectations Ease of use Apprehension Prep time
14 Like teaching .875 .035 .261 .153 .018 .011
6 Useful .867 .190 .149 .048 ¡.037 .049
11 Good time use .851 .087 .124 .183 ¡.055 .050
17 Increase productivity .837 .066 .096 .139 ¡.017 .041
8 Good idea .832 .147 .314 .082 .075 .098
15 Increase quality .829 .155 .140 ¡.031 ¡.088 .191
5 Interesting .822 ¡.038 .216 .065 .033 .058
12 Fun .807 ¡.029 .245 .131 .084 .105
18 Time from normal ¡.662 ¡.229 ¡.024 ¡.388 .110 .370 20 Long to learn ¡.594 ¡.280 ¡.068 ¡.466 .176 .248 4 Instruction available ¡.008 .908 ¡.012 .104 .056 .109
7 Guidance .024 .867 .038 .153 .100 .062
13 Assist available .028 .830 .033 .146 ¡.018 .002
10 Resources available .262 .724 .013 .126 ¡.162 ¡.119
3 Chair support .217 .571 .097 ¡.100 ¡.190 .003
24 Expect to teach .238 .285 .783 .074 ¡.124 ¡.015
26 Expect raise .150 .017 .754 .064 .060 ¡.252
26 Colleagues teach .286 ¡.148 .749 .107 .241 ¡.007
19 Expect to raise evaluation scores .301 ¡.026 .697 ¡.103 .139 .215
23 Chair teach .293 .182 .575 .064 ¡.338 .371
1 Easy to use .030 .062 .030 .899 ¡.215 ..010
9 Learning easy .320 .170 ¡.002 .826 ¡.020 .093
16 Learning to best teach .405 .218 .208 .619 ¡.033 ¡.248
21 Apprehensive ¡.043 ¡.024 .063 ¡.135 .913 .025
22 Intimidating .042 ¡.064 .082 ¡.114 .911 .047
2 Prep Time .248 .055 ¡.009 ¡.026 .064 .846
Note:Extraction method: principal component analysis; Rotation method: Varimax with Kaiser normalization; rotation converged after six iterations. Bold items represent variables that loaded onto the factors listed using the 0.4 standard.
FACULTY PERCEPTIONS OF CLICKERS IN LEGAL STUDIES IN BUSINESS 213
TABLE 5 Regression Analyses
Independent variables
Dependent variable R2 F Sig. Gender Acad. rank High degree Total enroll. Teach exper. Clicker exper. Recent PA
Factor 1 (Teaching quality)
14 Like teaching .195 3.260 .004* ¡.181 ¡.033 .359* ¡.175 .180 .278** .202
6 Useful .215 3.723 .0018** .039 ¡.055 .356* ¡.121 .161 .299** .235*
11 Good time use .158 2.555 .019* .009 .009 .279 ¡.158 .107 .258** .188*
17 Increase productivity .148 2.363 .029* .132 ¡.073 .258 ¡.126 .239* .221* .050
8 Good idea .208 3.566 .002** ¡.301 ¡.059 .416** ¡.172 .140 .258** .153
15 Increase quality .196 3.307 .003** .163 ¡.012 .424** ¡.054 .128 .291** .224*
5 Interesting .178 2.884 .009** ¡.042 .075 .224 ¡.136 .232* .246** .134
12 Fun .162 2.625 .016* ¡.177 .014 .308 ¡.221* .181 .188 .177
18 Time from normal .221 3.846 .001** .151 ¡.035 ¡.165 ¡.044 ¡.220* ¡.439** ¡.017
20 Long to learn .305 5.904 .000** .096 ¡.040 ¡.254 .183 ¡.261** ¡.438** .007
Factor 2 (Support)
4 Instruction available .099 1.493 .179 ¡.340 ¡.168 .163 .031 .099 .114 ¡.076
7 Guidance .105 1.598 .145 ¡.308 ¡.194 .155 .071 .124 .043 ¡.099
13 Assist available .069 0.989 .444 ¡.214 ¡.056 .084 .024 .142 .174 ¡.089
10 Resources available .168 2.744 .012* ¡.117 ¡.077 .270 .086 .111 .357** ¡.009
3 Chair support .076 1.097 .372 ¡.022 ¡.001 ¡.046 .070 .131 .161 .028
Factor 3 (Expectations)
24 Expect to teach .069 1.011 .428 .052 ¡.057 .171 ¡.008 .025 .098 .107
26 Expect raise .090 1.350 .236 .070 ¡.058 ¡.100 .034 .101 ¡.093 .111
25 Colleagues teach .090 1.334 .243 ¡.257 .008 .154 ¡.118 .092 ¡.077 .079
19 Raise evaluation scores .075 1.095 .373 ¡.033 ¡.053 .092 ¡.022 .048 ¡.116 .192
23 Chair teach .127 1.962 .068 .078 .007 .157 ¡.016 .012 .269** .047
Factor 4 (Ease of use)
1 Easy to use .144 2.279 .034* ¡.038 .001 .009 ¡.150 .184* .198* ¡.072
9 Learning easy .096 1.435 .200 .148 .048 ¡.075 ¡.083 .142 .202* ¡.089
16 Learning to best teach .188 3.086 .006** ¡.270 ¡.068 ¡.075 ¡.020 .233** .223** ¡.125
Factor 5 (Apprehension)
21 Apprehensive .234 4.145 .001** ¡.368 ¡.042 .137 .051 .067 ¡.414** .080
22 Intimidating .284 5.338 .000** ¡.317 ¡.077 .081 .089 ¡.006 ¡.454** .157
Factor 6 (Prep time)
2 Prep time .056 0.792 .596 ¡.097 .021 .181 ¡.051 .023 .177 .069
Note:Independent variables include gender (gender of the respondent), acad. rank (academic rank), high. degree (highest degree offered at the respondent’s institution), total enrol. (total enrollment at the respondent’s institution), teach exper. (years of teaching experience), clicker exper. (respondent experience with clickers), recent PA (recent perceived performance appraisal ratings compared to the rest of the department).
*p<.05. **p<.01.
tended to be positively related to teaching quality state-ments and large school enrollment tended to be negatively related. A number of possibilities for this result can be con-sidered. Perhaps large classes in schools that have high enrollment reduce the motivation for faculty to experiment with clickers. Schools with high enrollment may also encourage established teaching techniques. More in-depth analyses of these schools would be appropriate.
Limitations and Implications for Future Research
As an initial study of the adoption and perceptions of clickers in legal studies in business education, there were some limitations that additional researchers should need to address. As clicker experience is significantly associ-ated with perceptions of teaching quality, an appropriate follow-up study would be to pretest and post-test faculty perceptions of the use of clickers. In other words, did fac-ulty change their perceptions of clickers once they used them?
Other variables can potentially influence the results, such as race, seeing (but not using) clickers used in prac-tice, different subjects taught, resources of the respondent’s institution, and adequacy and availability of training. The survey did not ask about alternatives to clickers, such as the use of polling software such as Polleverywhere.com and Top Hat, or simply counting the number of hands raised in class. A study that compared the various alternatives is a possible area of future research.
Although this study invited all active members of the ALSB to participate, a larger sample that includes all legal studies in business faculty in the United States would be useful to see if the same results hold. An interesting ques-tion that remains unanswered is whether legal studies in business faculty use clickers and other forms of classroom technology more, less, or the same as faculty in other busi-ness disciplines.
It was surprising that clicker perceptions based on the UTAUT model had little or no relationship with gender given prior research that shows female instructor support for the social aspects of technology in general. Perhaps clickers might substitute for social interaction. Future researchers could focus more depth on the gender variable by considering motivational differences by gender in using technologies such as clickers.
CONCLUSION
This study surveyed legal studies in business faculty about their perceptions regarding the use of clickers. Clicker experi-ence appears to be significantly associated with most of the UTAUT statements related to teaching quality associated with clickers. Clicker users tend to have less intimidation,
apprehension, and feelings that clickers take long to learn than nonusers. Gender, academic rank, total enrollment in the respondent’s institution, and recent perceptions of perfor-mance appraisal ratings tended not to be associated with the UTAUT variables.
REFERENCES
Academy of Legal Studies in Business. (2014).2013–14 annual report/ minutes book. Oxford, OH: Author.
Agbatogun, A. (2001). Faculty members’ views of e-learning in Southwest Nigerian universities.International Journal of Technology, Knowledge and Society,6(3), 2–19.
Allen, I. E., & Seaman, J. (2012). Digital faculty: Professors, teaching, and technology. Babson Survey Research Group Report. Retrieved from http://www.insidehighered.com/sites/default/server_files/DigitalFaculty. htm
Bandura, A. (1986).Social foundations of thought and action: A social cognitive theory.Englewood Cliffs, NJ: Prentice-Hall.
Barber, M., & Njus, D. (2007). Clicker evolution: Seeking intelligent design. CBE-Life Sciences Education,6, 1–8. doi:10.1187/cbe.06-12-0206 Bojinova, E., & Oigara, J. (2011). Teaching and learning with clickers: Are
clickers good for students?Interdisciplinary Journal of E-Learning and Learning Objects,7, 169–184.
Caldwell, J. E. (2007). Clickers in the large classroom: Current research and best-practice tips. CBE-Life Sciences Education, 6, 9–20. doi:10.1187/cbe.06-12-0205
Camacho-Mi~nano, M., & del Campo, C. (2014). Useful interactive teach-ing tool for learnteach-ing: clickers in higher education.Interactive Learning Environments, doi:10.1080/10494820.2014.917108
Carnaghan, C., Edmonds, T. P, Lechner, T. A., & Olds, P. R. (2011). Using student response systems in the accounting classroom: Strengths, strate-gies and limitations.Journal of Accounting Education, 29, 265–283. doi:10.2308/iace.2007.22.3.391
Carnaghan, C., & Webb, A. (2007). Investigating the effects of group response systems on student satisfaction, learning, and engagement in accounting education. Issues in Accounting Education, 22, 391–409. doi:10.2308/iace.2007.22.3.391
Carr, S. (2000). Many professors are optimistic on distance learning, sur-vey finds.The Chronicle of Higher Education,46(44), A35.
Duncan, D. (2005).Clickers in the classroom: How to enhance science teaching using classroom response systems. San Francisco, CA: Pear-son-Addison Wesley.
Eastman, J. K., Iyer, R., & Eastman, K. L. (2011). Business students’ per-ceptions, attitudes, and satisfaction with interactive technology: An exploratory study. Journal of Education for Business, 86, 36–43. doi:10.1080/08832321003774756
Easton, C. (2009). An examination of clicker technology use in legal edu-cation.Journal of Information, Law & Technology,3. Retrieved from http://go.warwick.ac.uk/jilt/2009_3/easton
Easton, C. (2012). Employing a classroom response system to teach law: A case study.European Journal of Law and Technology,3(1). Retrieved from http:/ejlt.org/article/view/129/193
Fies, C., & Marshall, J. (2006). Classroom response systems: A review of the literature.Journal of Science Education and Technology,15, 101– 109. doi:10.1007/s10956-006-0360-1
Ghosh, S., & Renna, F. (2009). Using electronic response systems in eco-nomics classes. Journal of Economic Education, 40, 354–365. doi:10.1080/00220480903297651
Good, K. C. (2013). Audience Response Systems in higher education courses: A critical review of the literature. International Journal of Instructional Technology and Distance Learning,10(5), 19–34. FACULTY PERCEPTIONS OF CLICKERS IN LEGAL STUDIES IN BUSINESS 215
Grasha, A. F., & Yangarber-Hicks, N. (2000). Integrating teaching styles with instructional technology.College Teaching,48, 2–10. doi:10.1080/ 87567550009596080
Guernsey, J. B. (1977). H. Richard Crane: Oersted medalist for 1976. American Journal of Physics,45, 507. doi:10.1119/1.10947
Judson, E. (2002). Learning from past and present: Electronic response systems in college lecture halls.Journal of Computers in Mathematics and Science Teaching,21, 167–181.
Kay, R. H., & LeSage, A. (2009). Examining the benefits and challenges of using audience response systems: A review of the literature.Computers & Education,53, 819–827. doi:10.1016/j.compedu.2009.05.001 Keogh, P., & Wang, Z. (2010). Clickers in instruction: One campus,
multi-ple perspectives.Library Hi Tech,28, 8–21.
Lantz, M. E. (2010). The use of “clickers” in the classroom: Teaching innovation or merely an amusing novelty?Computers in Human Behav-ior,26, 556–561. doi:10.1016/j.chb.2010.02.014
Lewis, C. C., Fretwell, C. E., Ryan, J., & Parham, J. B. (2013). Faculty use of established and emerging technologies in higher education: A unified theory of acceptance and use of technology perspective.International Journal of Higher Education,2(2), 22–34. doi:10.5430/ijhe.v2n2p22 Lincoln, D. J. (2008). Teaching with clickers in the large-size principles of
marketing class.Marketing Education Review,18, 39–45.
Lincoln, D. J. (2009). Student response systems adoption and use in marketing education: A status report.Marketing Education Review,19(3), 25–40. Llorens, S., Arribas, E., Arroyo-Jiminez, M. M., Artacho, E., Carmona, M.,
Domingo, B.,. . .Najera, A. (2014). Evaluation of the possible impact of clickers on the grade obtained by students in the radiology subject, at the faculty of medicine in Albacete. In L. G. Chova, A. L. Martinez, & I. C. Torres (Eds.),INTED2014 Proceedings: 8th International Technol-ogy, Education, and Development Conference(pp. 2707–2714). Valen-cia, Spain: IATED Academy.
Mareno, N., Bremner, M., & Emerson, C. (2010). The use of audience response systems in nursing education: Best practice guidelines. Interna-tional Journal of Nursing Education Scholarship, 7(1). doi:10.2202/ 1548-923X.2049
Park, S., & Farag, D. (2015). Transforming the legal studies classroom: Click-ers and engagement.Journal of Legal Studies Education,32, 47–90. Patterson, B., Kilpatrick, J., & Woebkenberg, E. (2010). Evidence for
teaching practice: The impact of clickers in a large classroom environ-ment. Nurse Education Today, 30, 603–607. doi:10.1016/j. nedt.2009.12.008
Paver, J., Walker, D., & Hung, W. (2014). Adjunct faculty characteristics that may predict intention to integrate technology into instruction. Com-munity College Journal of Research and Practice, 38, 859–872. doi:10.1080/10668926.2013.819790
Peluchette, J., & Rust, K. A. (2005). Technology use in the classroom: Preferences of management faculty members.Journal of Education for Business,80, 200–205. doi:10.3200/JOEB.80.4.200-205
Penuel, W. R., Boscardin, C. K., Masyn, K., & Crawford, V. M. (2007). Teaching with student response systems in elementary and secondary
education settings: A survey study.Educational Technology Research and Development,55, 315–346. doi:10.1007/s11423-006-9023-4 Reay, N. W., Bao, L., Li, P., Warnakulasooriya, R., & Baugh, G. (2005).
Toward the effective use of voting machines in physics lectures. Ameri-can Journal of Physics,73, 554–558. doi:10.1119/1.1862638
Rosseau, G., & Rogers, W. (1998). Computer usage patterns of university faculty members across the lifespan.Computers in Human Behavior,14, 417–428. doi:10.1016/S0747-5632(98)00014-4
Simpson, V., & Oliver, M. (2007). Electronic voting systems for lectures then and now: A comparison of research and practice.Australasian Journal of Educational Technology,23, 187.
Sousa, D. A. (2011).How the brain learns(4th ed.). Thousand Oaks, CA: Sage.
Spotts, T. H., Bowman, M. A., & Mertz, C. (1997). Gender and use of instructional technologies: A study of university faculty.Higher Educa-tion,34, 421–436. doi:10.1023/A:1003035425837
Tan, P. J. B. (2013). Applying the UTAUT to understand factors affecting the use of English e-learning websites in Taiwan.SAGE Open,3(4), 1– 12. doi:10.1177/2158244013503837
Taneja, A. (2009). The influence of personal response systems on students’ perceived learning outcomes and course satisfaction.Journal of Cir-cuits, Systems and Computers,25(2), 5–11.
Taylor, S., & Todd, P. A. (1995). Understanding information technology usage: A test of competing models.Information Systems Research,6, 144–176. doi:10.1287/isre.6.2.144
Tlhoaele, M., Hofman, A., Naidoo, A., & Winnips, K. (2014). Using click-ers to facilitate interactive engagement activities in a lecture room for improved performance by students. Innovations in Education and Teaching International, 51, 497–509. doi:10.1080/ 14703297.2013.796725
Venkatesh, V., & Davis, F. D. (2000). A theoretical extension of the tech-nology acceptance model: Four longitudinal field studies.Management Science,46, 186–204. doi:10.1287/mnsc.46.2.186.11926
Venkatesh, V., Morris, M. G., Davis, G. B., & Davis, F. D. (2003). User acceptance of information technology: Toward a unified view.MIS Quarterly,27, 425–478.
Wilson, K., & Korn, J. H. (2007). Attention during lectures: Beyond ten minutes. Teaching of Psychology, 34, 85–89. doi:10.1080/ 00986280701291291
Xu, Y., & Meyer, K. A. (2007). Factors explaining faculty technology use and productivity. The Internet and Higher Education, 10, 41–52. doi:10.1016/j.iheduc.2006.10.004
Yourstone, S. A., Kraye, H. S., & Albaum, G. (2008). Classroom question-ing with immediate electronic response: Do clickers improve learnquestion-ing? Decision Sciences Journal of Innovative Education, 6, 75–88. doi:10.1111/j.1540-4609.2007.00166.x
Yu, Z., Chen, W., Kong, Y., Sun, X. L., & Zheng, J. (2014). The impact of clickers instruction on cognitive loads and listening and speaking skills in college English class.PLoS ONE,9, e106626. doi:10.1371/journal. pone.0106626