Full Terms & Conditions of access and use can be found at
http://www.tandfonline.com/action/journalInformation?journalCode=cbie20
Download by: [Universitas Maritim Raja Ali Haji] Date: 17 January 2016, At: 23:17
Bulletin of Indonesian Economic Studies
ISSN: 0007-4918 (Print) 1472-7234 (Online) Journal homepage: http://www.tandfonline.com/loi/cbie20
Tomato Farmers and Modernising Value Chains in
Indonesia
Ricardo Hernández, Thomas Reardon, Ronnie Natawidjaja & Shobha Shetty
To cite this article: Ricardo Hernández, Thomas Reardon, Ronnie Natawidjaja & Shobha Shetty (2015) Tomato Farmers and Modernising Value Chains in Indonesia, Bulletin of Indonesian Economic Studies, 51:3, 425-444, DOI: 10.1080/00074918.2015.1104649
To link to this article: http://dx.doi.org/10.1080/00074918.2015.1104649
Published online: 29 Nov 2015.
Submit your article to this journal
Article views: 46
View related articles
Bulletin of Indonesian Economic Studies, Vol. 51, No. 3, 2015: 425–44
ISSN 0007-4918 print/ISSN 1472-7234 online/15/000425-20 © 2015 Indonesia Project ANU http://dx.doi.org/10.1080/00074918.2015.1104649
* This article builds on a report by the World Bank (2007). IFPRI = International Food Policy Research Institute.
TOMATO FARMERS AND MODERNISING
VALUE CHAINS IN INDONESIA
Ricardo Hernández* Thomas Reardon*
IFPRI Michigan State University; University of Adelaide
Ronnie Natawidjaja* Shobha Shetty*
Padjadjaran University World Bank
The tomato value chain in Indonesia has transformed in the last two decades. We assess this transformation here, focusing on small tomato farmers in West Java and the determinants of their market-channel choices (as well as the technology cor-relates of those choices). These farmers sell to traditional village traders, urban and modern wholesalers, and supermarkets, and they have all invested heavily in irri-gation and rely on external inputs. We ind differences among farmers selling to dif -ferent market channels. To wit, non-land assets—especially irrigation—are impor-tant to farmers participating in the supermarket, or modern, channel, but farm size affects modern-channel participation only in high-level commercial zones (zones dense in infrastructure and near highways). We also ind that modern-channel farmers earn more proit than farmers in other channels but do not necessarily use chemicals more intensively. Yet hardly any farmers sell graded tomatoes; the main ‘capture of rents’ goes to specialised and modernising wholesalers.
Keywords: tomatoes, modern markets, technology adoption JEL classiication: D61, O3, Q12, Q13
INTRODUCTION
In the last two decades, food markets have globalised and agrifood value chains in developing countries, including Indonesia, have transformed. The economic development literature has begun to explore the implications of these changes for farmers. Most attention has been on the emerging impacts on farmers of linkages to export markets, supermarkets, large processing irms and their contract-farming schemes, and the emerging category of so-called modernising wholesalers.Yet the literature on the determinants and impacts of horticulture farmers selling to supermarkets and large processing irms in Indonesia is still relatively small. The few studies (such as Sahara and Gyau 2014) tend to focus
426 Ricardo Hernandez, Thomas Reardon, Ronnie Natawidjaja, and Shobha Shetty
on the micro-determinants of the choice between the modern channel and other, traditional channels, such as local ield brokers.1
Although these modern and traditional channels are important choices for hor-ticulture farmers in Indonesia, this dichotomy neglects another important choice: modernising wholesalers (Hernandez, Berdegué, and Reardon 2015). These non-traditional actors are large and usually based in the urban wholesale market, and they often buy directly from farmers rather than rely on traditional village bro-kers. We include this third channel in this article’s econometric analysis of data from our detailed survey in 2006 of tomato farmers in West Java. We do this in the spirit of non-econometric pieces by Verhofstadt and Maertens (2013), for Rwanda, and Reardon et al. (2012), for China, India, and Bangladesh, which emphasise the importance of modernising wholesalers as an intermediate channel for farmers.
While micro-variables such as farm size and non-land assets help to deter-mine market-channel choice, we posit that the type of production zone—whether dense in infrastructure and commercial activity or not—inluences market-chan-nel and technology choices on the basis of transaction costs and network and cluster effects. This inluence is not measured in the literature on market-channel choice in Indonesia but is particularly strong in West Java, where the Cipularang Toll Road to Jakarta opened in 2005 (the year before our survey). The literature usually evaluates the income pay-offs of participating in each channel, but it does not test for technological intensiication-cum-modernisation as a correlate of mar-ket channel.
We test here for a correlation between market modernisation and technology intensiication because the latter is an important policy goal of the Ministry of Agriculture. We explore, in particular, the determinants of participation in certain market channels and the choice of certain technologies, as well as the interaction between market participation and the choice of technology. These market nels include traditional channels (such as local ield brokers); modernising chan-nels (which comprise modernising wholesalers); and modern chanchan-nels (such as supermarkets and specialised and dedicated wholesalers for supermarkets).2 The
1. On export markets, see, for example, work by Minten, Randrianarison, and Swinnen (2009) and Maertens and Swinnen (2009) on export irms and horticulture farms in Madagascar and Senegal. On supermarkets, see articles by Blandon, Henson, and Cranield (2009), Rao, Brümmer, and Qaim (2012), and Schipmann and Qaim (2011) on supermarkets and hor-ticulture farmers in Honduras, Kenya, and Thailand, respectively, and, for Indonesia, by Sahara and Gyau (2014) on chilli in West Java. On large processing irms and contract farm -ing, see work by Barrett et al. (2012) and, on Indonesia, by Puspitawati et al. (2013), on potatoes, and Simmons, Winters, and Patrick (2005) on seed corn, seed rice, and chickens. On modernising wholesalers, see Hernandez, Berdegué, and Reardon’s (2015) article on the determinants and impacts of small guava farmers in Mexico selling to these actors. 2. Specialised wholesalers sell one product or very few products, and sell to different actors from different market channels. A wholesaler who specialises in selling tomatoes to super-markets, other wholesalers, and traditional retailers would be a specialised wholesaler. Dedicated wholesalers, in contrast, may sell a wide variety of products, but sell to actors from a speciic market channel. They do not sell their graded products to other market channels, such as to traditional retailers. A wholesaler who sells different types of graded perishables to different supermarket chains would be a dedicated wholesaler. In some cases, a given wholesaler can be both a specialised wholesaler and a dedicated wholesaler.
Tomato Farmers and Modernising Value Chains in Indonesia 427
technologies include traditional technology, low-external-input-intensity technol-ogy, and ‘modernised’ external-input-intensive technology.
Tomatoes are an example of the recent, rapid emergence of non-traditional food products in Indonesia, having been introduced into Asia only several hun-dred years ago by Portuguese and Spanish traders. By 1970, only 15,000 tonnes of tomatoes were being produced in Indonesia—a tiny share of the country’s vegeta-ble production and consumption. By 2010, Indonesia’s population had douvegeta-bled but annual tomato production had increased 60-fold, to nearly 900,000 tonnes. This change was mirrored in production zones. By the 2000s, West Java, which had traditionally focused on producing rice and tea, became Indonesia’s leading tomato-producing province, growing half the country’s tomatoes.
Our interviews with key informants in Indonesia’s horticulture industry revealed that farming in West Java has, in recent years, generally eschewed tra-ditional techniques and adopted intensiication technologies that require more fertiliser, pesticides, and irrigation. Actors in various segments of tomato sup-ply chains told us that the predominant market channel 20 years ago was the traditional system of village traders buying tomatoes from farmers and selling them locally to rural assemblers, who then sold them to urban wholesale mar-kets. In recent years, however, in a kind of disintermediation, large wholesalers from rural and urban wholesale markets have increasingly been buying direct from farmers. Since the 1990s, large, modernising wholesalers from Jakarta and Bandung and other provincial capitals have increased their presence in produc-tion zones. In the 2000s, specialised and dedicated wholesalers bought, graded, sorted, and packed tomatoes and other produce for delivery to supermarkets, hotels, and restaurants.
CONTEXT AND DATA Context
In the past few decades, West Java has evolved from Indonesia’s major rice bowl to its major vegetable basket. The province’s infrastructure density and urban share have increased sharply, largely because of the growth of Bandung and other cities in West Java and the decrease in the time and cost to travel between rural West Java and large urban markets in Jakarta. Of course, outside the main cities of West Java there are differences between subzones—especially between valleys and mountainous areas, and between rural hinterland areas and the small urban areas of secondary and tertiary cities and towns (so-called rur-urban areas)—and these differences have manifested themselves in the differing commercial charac-teristics of each subzone. As rural land and labour prices rose, along with income-driven demand from local and island-wide urban markets, horticulture in West Java converted (relatively low-paying) rice ields and forested land into (high-paying) farmland for fruit and vegetables. Low-value vegetables such as cabbage were produced irst, followed by medium-value vegetables such as tomatoes and potatoes.
Our ield research revealed that agricultural markets in West Java have evolved through three stages. The province’s traditional market systems were dominated by small village traders, who sold to villages and nascent urban markets. This initial stage was replaced by an intermediate transformation stage, which saw the
428 Ricardo Hernandez, Thomas Reardon, Ronnie Natawidjaja, and Shobha Shetty
advent of medium- and large-scale traders. These traders were based in whole-sale markets (in Jakarta and Bandung) and bought from farmers in the districts around Bandung (and Bogor). The next stage, that of an emerging modern market channel, added specialised and dedicated wholesalers, which sold to the incipient supermarket and hotel and restaurant sectors. Food-product supplier Bimandiri, for example, which had been a traditional wholesaler in the Bandung market in the 1990s, began to set up warehouses and collection points off-market and con-tract with modern-market buyers of tomatoes and other produce.
Data
In February–July 2006, we conducted a district-level survey of farming house-holds in West Java, using a structured questionnaire on farm and household characteristics; farm production and input use; credit, technical assistance, and participation in associations; and tomato marketing (including channels and transaction terms). This survey had, overall, a one-year recall period and, for assets, a ive-year recall period, the latter to create lagged asset variables exog-enous to the respondents’ market and production choices at the time of the questionnaire.
At the time of our survey, West Java had 25 kabupaten (districts).3 We identiied
a subset of the 12 districts that each produced at least 1,000 tonnes of tomatoes a year, according to 2000–2004 data from Badan Pusat Statistik, Indonesia’s central statistics agency. By identifying districts that produced high amounts of tomatoes, we hoped to ind farmers in diverse market channels and who used diverse tech-nologies and had diverse farm sizes and non-land assets. We also hoped to ind a diversity of merchant types. The districts differed in production volumes, so we used the sampling method of probability proportional to size (weighted). At this sampling stage, we selected Bandung and Garut as the districts in which to con-duct our household survey. We chose four kecamatan (sub districts) from each. In 2006, Bandung had 30 subdistricts that produced more than 1,000 tonnes of toma-toes annually, while Garut had 28. We chose, at random, the Ciwidey, Lembang, Pangalengan, and Pasirjambu subdistricts of Bandung, and the Cigedug, Cikajang, Cisurupan, and Pasirwangi subdistricts of Garut.
For each selected subdistrict, we compiled a list of tomato farmers by drawing on several sources, including the land-tax registration list, agricultural oficials, farm leaders, and local traders. We then divided this list into two strata: farmers who supplied the modern channel—that is, supermarkets—directly (or indirectly, via specialised wholesalers), and farmers who supplied other channels (the inter-mediate, or ‘modernising wholesaler’ channel, and the traditional channel, com-prising village traders). We selected 600 farmers across all subdistricts, assigning 300 farmers to Bandung and 300 to Garut. We then assigned 150 farmers to each of the two strata within these districts. We weighted for the over-representation of any subdistrict or market channel, thus controlling for sampling design and mak-ing the overall sample more representative of the population. After data cleanmak-ing, we retained 596 usable household observations.
3. The district of West Bandung was created in 2007.
Tomato Farmers and Modernising Value Chains in Indonesia 429
DESCRIPTIVE ANALYSIS OF TOMATO FARMERS
Tables 1–5 present selected descriptive statistics for our sample of farming households. Each table has two sets of stratiications: the commercial zone of the household’s subdistrict and the main marketing channel used by the household. To stratify our sample by commercial zone, we used oficial statistics at the sub-district level, and data from our own subsub-district survey from 2006, to create a score for each subdistrict on the basis of two indicators: the share of households whose primary activity is non-agricultural (which is thus a proxy for the rur-urban or urban intensity of the subdistrict) and the share of land under horticultural crops (as opposed to rice), which are nearly fully commercial while rice is semi-com-mercial or semi-subsistence. We therefore classiied two subdistricts in Bandung (Lembang and Pangalengan) and two in Garut (Cisurupan and Cikajang) as being in high-level commercial zones. We classiied the remaining subdistricts as being in low-level commercial zones.
To stratify our sample by the main marketing channel used by households, we deined each channel as follows: the traditional channel includes farmers that sell mainly to village traders; the intermediate channel includes households that sell directly to large wholesalers; and the modern channel includes households that sell to supermarkets directly (or indirectly, via specialised and dedicated wholesalers). Table 1 contains general household characteristics. All strata have similar amounts of tomato-growing experience (around a decade), having started to pro-duce tomatoes well before the recent changes in the market; specialised wholesal-ers for supermarkets began their operations in Bandung only four to ive years before we conducted our survey, and in Garut only two to three years before. All strata also have similar household sizes and similar ages and education levels of household heads. Most households have concrete houses and with a regular sup-ply of electricity and water. The overall proile is one of economically secure rural households, regardless of the commercial intensity of their subdistrict or their market-channel choice. Few households are members of cooperatives. The main difference is that those in the modern channel—that is, those that sell to super-markets—are more specialised in tomato production. This is as expected, given the exigencies of the modern channel. Farmers in the intermediate channel— those selling to modernising wholesalers—are highly specialised in tomato pro-duction only in low-level commercial zones, while around 70% of farmers in the traditional channel declared tomato production as their main source of income.
Table 2 shows landholding and land-use characteristics by commercial zone and market-channel choice. Tomato farms are small, averaging 0.7–0.8 hectares each, which, in West Java, is slightly larger than the size of an average rice farm (0.6 hec-tares) (Brázdik 2006). Modern-channel farms are roughly 20%–30% larger than the size of an average farm in the two other strata, in both commercial zones. Farms in low-level commercial zones are slightly larger (15%) than those in high-level commercial zones, largely because the former are in denser areas with higher land prices. The share of rented land in total operated land is nearly 30% in high-level commercial zones versus 15% in low-level commercial zones. Most rented land is owned by rice farmers; we observed that many small rice farmers, when they worked in town, rented out their land to horticulture farmers. Nearly all the strata in both zone categories grew only horticultural products but very little to no rice. Tomatoes composed, on average, roughly half the horticultural area of the farms.
TABLE 1 Household Characteristics of Tomato Farmers, by Commercial Zone and Market Channel, 2004–5
Low-level commercial High-level commercial
Traditional Intermediate Modern Overall Traditional Intermediate Modern Overall
Households 175 57 47 279 152 122 43 317
Age of household head (years) 42.1 48.1 42.7 43.4 43.2 41.7 41.7 42.4
Education of household head
(years) 6.8a 6.5a 8.6c 7.1 6.7a 7.2ab 7.2ab 7.0
Tomato-farming experience of
household head (years) 11.3b 8.9ab 11.1b 10.8 10.5b 9.4ab 8.6a 9.8
Household size (members) 3.7a 4.0ab 4.2b 3.8 4.3b 4.1b 4.3b 4.2
% of households with:
Concrete house 82.9 61.4 85.1 78.9 92.1 86.1 93.0 89.9
Electricity 98.3 100.0 100.0 98.9 100.0 100.0 100.0 100.0
Own water source 96.6 100.0 100.0 97.8 96.7 97.5 100.0 97.5
Part of household co-op (%) 9.1c 1.8b 0.0a 6.1 12.5c 13.9c 0.0a 11.4 Tomato farming as main
income (%) 69.7b 91.2c 85.1c 76.7 71.1b 50.0a 93.0c 65.9
TABLE 2 Landholding and Land-Use Characteristics of Tomato Farmers, by Commercial Zone and Market Channel, 2004–5
Low-level commercial High-level commercial
Traditional Intermediate Modern Overall Traditional Intermediate Modern Overall
Operated land by status (ha) 0.7ab 0.7ab 1.0b 0.7 0.6a 0.7ab 0.9b 0.7
Owned 0.6ab 0.6ab 0.8b 0.6 0.5ab 0.4a 0.7b 0.5
Rented 0.1a 0.1a 0.2ab 0.1 0.2ab 0.3b 0.2ab 0.2
Sharecropped-in 0.0 0.0 0.0 0.0 0.0 0.0 0.0 0.0
Operated land by crop (ha) 0.7 0.7 1.0 0.8 0.6 0.7 0.8 0.7
Cultivated 0.7 0.7 1.0 0.8 0.6 0.7 0.8 0.7
Tomatoes 0.3 0.3 0.5 0.3 0.6 0.7 0.8 0.7
Other vegetables or fruit 0.3 0.3 0.5 0.4 0.3 0.4 0.4 0.3
Rice 0.1 0.0 0.0 0.1 0.3 0.4 0.4 0.3
Uncultivated 0.0 0.0 0.0 0.0 0.0 0.0 0.0 0.0
Note: The superscript a, b, and c show differences between groups, using a Tukey–Kramer test (p < 0.1).
432 Ricardo Hernandez, Thomas Reardon, Ronnie Natawidjaja, and Shobha Shetty
Table 3 shows tomato irrigation and seasonality, comparing circumstances in 1999–2000 with those in 2004–5. In 1999–2000, only 53.3% of farms in high-level commercial zones irrigated their tomatoes; in 2004–5, 88.0% did. Small commer-cial farms invested heavily to shift from single-season cropping to multicropping, presumably to match the continuous demand from the market for fresh tomatoes. In 2004–5, 65.5% of the whole sample of tomato farmers multicropped: 65.5% of traditional, 61.6% of modernising-channel farmers, and 77.7% of modern-channel farmers. In ive years, farmers in the intermediate and modern channels dou-bled their land under tomatoes; farmers in the traditional channel, in contrast, expanded their land by only 20%, on average, regardless of commercial zone.
Table 4 shows tomato production costs and proits per hectare, on average, during 2004–5. Contrary to expectations, the total costs of modern-channel farm-ers are slightly lower than traditional-channel farmfarm-ers. Modern-channel farmfarm-ers spend slightly less on external inputs, such as seed, fertiliser, and pesticides, than intermediate- and traditional-channel farmers. This may be because modern-channel farmers are somewhat more informed and more allocatively eficient than those in other channels, and manage their input use more carefully. But the external-input intensity varies little across the strata.
In high-level commercial zones, the proit or revenue–cost ratio of modern-channel farmers is 12% higher than those of farmers in the two other modern-channels (which have similar ratios) when ignoring the imputed costs of family labour. In low-level commercial zones, the advantage is 35%. The proit superiority of modern-channel farmers could be due to their slightly lower input outlays (for similar yields to those of farmers in the other channels) and to their receiving price premiums of 2% in high-level commercial zones and 18% in low-level com-mercial zones.
Prices received by farmers in high-level commercial zones are similar across market channels, while farmers in low-level commercial zones and the modern market channel receive a signiicantly higher price than farmers in other channels. This result mirrors those found among guava producers in Mexico (Hernandez, Berdegué, and Reardon 2015), where modernising wholesalers have to pay a premium in low-level commercial zones to guarantee quantity and quality. This practice is often unnecessary in high-level commercial zones, because all market channels have very competitive prices and because farmers in the modern chan-nel beneit from lower risk (via implicit contracts) and a higher number of sales.
Table 5 gives details on tomato marketing. Households in all channels sell fresh tomatoes every few weeks—a common pattern in Indonesia and other develop-ing countries, especially in tropical and subtropical zones. In contrast, tomatoes that go to processors are typically harvested in a single batch. Yields are similar across all channels, but modern-channel farmers have greater areas under tomato production and multicrop more often than other farmers. They therefore sell more tomatoes than other farmers, in both zone categories: one-half and one-third more than traditional-channel farmers in high- and low-level commercial zones, respec-tively. Farmers in the intermediate channel sell more tomatoes than those in the traditional channel but fewer than those in the modern channel.
Grading is nearly absent for farm-level sales, across all market channels. The intermediaries, regardless of channel, buy all the tomatoes, of all grades, from the farmers. Our interviews with intermediaries revealed that modernising
TABLE 3 Irrigation and Cropping by Tomato Farmers, by Commercial Zone and Market Channel, 1999–2000 and 2004–5
Low-level commercial High-level commercial
Traditional Intermediate Modern Overall Traditional Intermediate Modern Overall
% of land irrigated
Crop-land (2005) 65.3ab 61.0a 68.8ab 65.0 83.3c 76.4b 76.5b 79.7
Tomatoes (2005) 88.0 87.6 85.9 87.6 85.2 89.7 93.1 88.0
Tomatoes (2000) 56.2 46.3 66.0 55.8 55.9 49.2 55.8 53.3
Tomato seasons (2004–5) (% of farmers)
1 41.4 35.1 19.1 36.3 27.6 41.8 25.6 32.8
2 27.6 24.6 44.7 29.9 40.1 36.9 34.9 38.2
3 31.0 40.4 36.2 33.8 32.2 21.3 39.5 29.0
Tomato seasons (1999–2000) (% of farmers)
0 26.9 14.0 8.5 21.1 23.0 32.0 14.0 25.2
1 36.0 12.3 87.2 39.8 15.8 22.1 7.0 17.0
2 14.3 33.3 2.1 16.1 30.3 22.1 41.9 28.7
3 22.9 40.4 2.1 22.9 30.9 23.8 37.2 29.0
Tomatoes (ha) (2004–5) 0.6a 0.7ab 0.9b 0.6 0.7ab 0.7ab 0.7ab 0.7 Tomatoes (ha) (1999–2000) 0.6b 0.5ab 0.7ba 0.6 0.5ab 0.3a 0.4ab 0.5
Note: The superscript a, b, and c show differences between groups, using a Tukey–Kramer test (p < 0.1).
TABLE 4 Costs and Proits of Tomato Farmers, by Commercial Zone and Market Channel, 2004–5
Low-level commercial High-level commercial
Traditional Intermediate Modern Overall Traditional Intermediate Modern Overall
Production costs (Rp million)
Agro-inputs 13.0b 12.9ab 12.6a 12.9 13.6b 13.6b 12.7a 13.5
(% of total cost) (41.7) (41.3) (48.8) (42.6) (48.1) (47.2) (49.6) (48.0)
Seed 0.9 0.8 1.0 0.9 0.9 0.9 0.8 0.9
Fertilisers 6.1 6.0 5.4 6.0 6.3 6.2 5.5 6.2
Pesticides 6.1 6.1 6.2 6.1 6.4 6.4 6.4 6.4
Labour 14.0b 13.7b 8.7a 13.1 10.0ab 10.6ab 8.1a 10.0
(% of total cost) (44.9) (43.9) (33.7) (43.2) (35.3) (36.8) (31.6) (35.6)
Family 2.8 3.0 1.5 2.6 1.6 1.8 1.5 1.7
Hired 11.3 10.7 7.2 10.5 8.4 8.8 6.6 8.3
Land rent 1.9 2.5 2.2 2.1 2.4 2.2 2.4 2.3
(% of total cost) (6.1) (8.0) (8.5) (6.9) (8.5) (7.6) (9.4) (8.2)
Plastic, stakes, fuel 2.2 2.1 2.3 2.2 2.3 2.4 2.4 2.3
(% of total cost) (7.1) (6.7) (8.9) (7.3) (8.1) (8.3) (9.4) (8.2)
Total cost 31.2c 31.2c 25.8a 30.3 28.3b 28.8b 25.6a 28.1
Proit (Rp million / ha, unless otherwise stated)
Revenue 39.9a 39.3a 45.8b 40.7 42.1ab 42.1ab 44.3b 42.4
Yield (tonnes/ha) 51.8 52.7 50.6 51.8 52.7 52.1 54.3 52.7
Price (Rp/kg) 793.0ab 758.0a 936.0c 810.0 823.0b 830.0b 838.0b 828.0
Total cost 31.2c 31.2c 25.8a 30.3 28.3b 28.8b 25.6a 28.1
Proit, including family labour 8.7a 8.1a 20.1c 10.5 13.8b 13.2b 18.7bc 14.2
Revenue/cost 1.3 1.3 1.8 1.4 1.5 1.5 1.7 1.5
Proit, excluding family labour 11.5a 11.1a 21.5c 13.1 15.4b 15.0b 20.2c 15.9
Revenue/cost 1.4 1.4 1.9 1.5 1.6 1.6 1.8 1.6
TABLE 5 Marketing by Tomato Farmers by Commercial Zone and Market Channel, 2004–5
Low-level commercial High-level commercial
Traditional Intermediate Modern Overall Traditional Intermediate Modern Overall
Times sold during season 7.9a 7.6a 8.3b 7.9 8.4b 7.7a 10.5bc 8.4
Tonnes sold during season 14.4a 18.4b 22.8c 16.6 15.3ab 18.1ab 23.2c 17.4
Graded 0.0a 0.0a 1.4b 0.2 0.0a 0.0a 0.3ab 0.0
Ungraded 14.4a 18.4b 21.4ab 16.4 15.3ab 18.1b 22.9c 17.4
Trader payment system (%) a b b a b a b b a
In advance 0.0 0.0 0.0 0.0 0.0 0.0 0.0 0.0
On harvest 0.6 7.0 0.0 1.8 0.0 0.0 0.0 0.0
Shortly after harvest 9.1 21.1 0.0 10.0 2.6 14.8 0.0 6.9
On consignment 90.3 71.9 95.7 87.5 97.4 85.2 90.7 91.8
Other 0.0 0.0 4.3 0.7 0.0 0.0 9.3 1.3
Note: The superscript a, b, and c show differences between groups, by using a Tukey–Kramer test (p < 0.1).
436 Ricardo Hernandez, Thomas Reardon, Ronnie Natawidjaja, and Shobha Shetty
wholesalers and the specialised and dedicated wholesalers for supermarkets grade and sell into different markets, while traditional wholesalers sell ungraded tomatoes. This means that the intermediaries, rather than the farmers, capture the proits from achieving quality in tomato production. Table 5 also shows that no farmer, in any channel, received an advance from a trader, contradicting the conventional wisdom that traders ‘tie’ advances to credit or output market trans-actions. Farmers tend to have regular relationships with traders and sell mainly on consignment, even in the modern channel.
ECONOMETRIC MODEL
We model market-channel choice as a variation on the output supply decision, and we model input demands to relect technology choice. We do this using two sets of equations. The irst set models these choices as a function of the economic determinants—risk, relative prices of outputs and inputs, and a vector of quasi-ixed capital assets, as well as various context-speciic shifters. These output-supply and input-demand equations derive theoretically from a proit function, without requiring the assumption of proit maximisation We do not restate the initial theoretical derivation of Sadoulet and De Janvry (1995) and further contri-butions from Holloway, Barrett, and Ehui 2005) here, but their system of output supply and factor demand functions in decision prices, p*, is
q=q p
(
*,zq)
(1)The output supply functions are speciied here to distinguish the different mar-ket channels. The basic model is broad enough to link marmar-ket-channel decisions to transaction costs (Barrett et al. 2012), a subset of input costs; it is also broad enough to link channel and technology decisions to thresholds of land and non-land assets (Carter and Barrett 2006).
The second set of equations models production as a technical function of land, labour, and capital, without economic variables; we add the production function in order to derive marginal physical products (MPPs). We then value the MPPs at output prices to derive marginal value products (MVPs), which we then compare with factor prices to measure allocative eficiency (Lau and Yotopoulos 1971).
To estimate the above equations, in general, we (a) estimate the function of market-channel choice and (b) estimate the technology economic choices (input-demand functions) and the technical relations (the production functions), after having controlled for the conditional probability of market-channel participation. In the irst of these steps, we estimated a multinomial logit; we used Bourguignon, Fournier, and Gurgand’s (2007) extension of Dubin and McFadden’s (1984) approach to correct for selection bias. The regression models the participation of a farming household in a given market channel, with three channels as the choices (traditional, intermediate, and modern).
The implementation model for market-channel and technology choices is as follows:
Y1=Xβ1+u
1
Yj*=zγj+ηj (2)
Tomato Farmers and Modernising Value Chains in Indonesia 437
where j = 1, 2, 3. The subscript j represents the categorical variable of the market channel among the three alternatives (modern = 1, intermediate= 2, and traditional = 3), based on utilities,Yj*. The vector z represents the explanatory variables for all market-channel alternatives, a set of farmer characteristics that together relect the incentive and capacity variables inluencing the producer’s indirect utility. The vector X represents the explanatory variables in the production function.
Consistent coeficients of the market-channel determinants
( )
Yj can be obtainedby maximum likelihood estimation methods. The problem is how to estimate the vector of coeficients of the production function β1, considering that the disturbance term (u1), might not be independent of all
( )
ηj .Dubin and McFadden’s model uses a linearity assumption. Bourguignon, Fournier, and Gurgand suggest a variation, making u1 linear on a set of normal distributions and allowing u1 to be normal as well. The production function equa-tion in (1) is then condiequa-tional on choosing the modern channel (j = 1):
Y1=X
The determinants are as follows:
• Socio-demographic variables: household head’s education (years); household head’s tomato-growing experience (years); household head’s age (years); and household size (members)
• Micro-asset variables: ive-year lagged farm size interacted with location (Bandung or Garut); distance to a paved highway (kilometres); lagged percentage of farmland under irrigation; and a lagged dummy variable for membership in a farmers’ association or cooperative
• Meso-asset variables: lagged number of packing houses in the subdistrict (units) and a dummy variable for the subdistrict’s commercial zone (low or high level)
We used lagged assets to avoid causality problems in the market-channel or input choice. Moreover, we separated the land effect in the two districts because of the different farming systems and scarcity of land between the two, with Garut less dense than Bandung.
In the second stage, the input-demand functions have the following determi-nant variables:
• Prices: tomato price (rupiah per kilogram); price of fertiliser (rupiah per kilogram); labour wage (rupiah per day); and price of pesticides (rupiah per kilogram)
• Socio-demographic variables: household head’s education (years); household head’s age (years); and household size (members)
• Micro-asset variables: owned land (hectares); owned land × Bandung dummy variable; distance to a paved highway (kilometres); and the percentage of farmland under irrigation
• Meso-asset variables: dummy for high-level commercial zone
• Controls for selection bias: inverse Mills ratio 1 and inverse Mills ratio 2 • Dummy variable for dry season
438 Ricardo Hernandez, Thomas Reardon, Ronnie Natawidjaja, and Shobha Shetty
REGRESSION RESULTS
Determinants of Market-Channel Choice
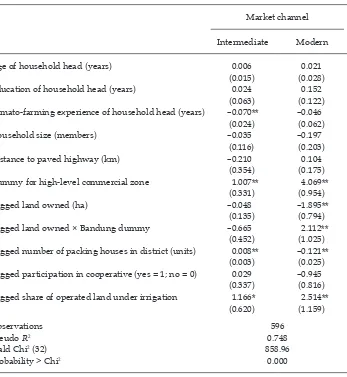
To avoid causation problems, we used lagged assets in our regression instead of endogenous, current-period asset variables. We tested all lagged-asset vari-ables for endogeneity, after Rivers and Vuong (1988), and found no evidence of it. The salient results of the determinants of market-channel choice (table 6) are as follows.
Lagged farm size has ambiguous effects on market-channel participation. It had a positive effect on modern-channel participation in Bandung, where land is scarce, but a negative effect in Garut. It had no effect on farm size in the interme-diate channel in either category of commercial zone. In an attempt to determine why smaller farmers in the more rural district of Garut are in the modern chan-nel, we draw on the results of our rapid, rural, pre-survey appraisal. In Bandung,
TABLE 6 Determinants of Market-Channel Choice
Market channel Intermediate Modern
Age of household head (years) 0.006 0.021
(0.015) (0.028)
Education of household head (years) 0.024 0.152
(0.063) (0.122) Tomato-farming experience of household head (years) –0.070** –0.046
(0.024) (0.062)
Household size (members) –0.035 –0.197
(0.116) (0.203)
Distance to paved highway (km) –0.210 0.104
(0.354) (0.175)
Dummy for high-level commercial zone 1.007** 4.069**
(0.331) (0.954)
Lagged land owned (ha) –0.048 –1.895**
(0.135) (0.794)
Lagged land owned × Bandung dummy –0.665 2.112**
(0.452) (1.025) Lagged number of packing houses in district (units) 0.008** –0.121**
(0.003) (0.025) Lagged participation in cooperative (yes = 1; no = 0) 0.029 –0.945
(0.337) (0.816) Lagged share of operated land under irrigation 1.166* 2.514**
(0.620) (1.159)
Observations 596
Pseudo R2 0.748
Wald Chi2 (32) 858.96
Probability > Chi2 0.000
* p < 0.1; ** p < 0.05; *** p < 0.01.
Tomato Farmers and Modernising Value Chains in Indonesia 439
near the city, larger farmers with more capital tend to make frequent shipments to specialised wholesalers and proit from nearby commercial opportunities. In Garut, a more rural subdistrict, with bigger parcels of land, the larger farmers tend to sell large volumes to inter-island traders who come to that area for large volumes, leaving the modern channel—a smaller and more specialised channel than in Bandung—to smaller farmers, who nevertheless are richer (in terms of non-land assets) than a typical small farmer in Garut.
Access to irrigation is another important determinant of modern-channel par-ticipation. The lagged irrigation share has an important positive effect on partici-pation in the modern and intermediate channels. Such consistency of production is an important attribute that dedicated wholesalers look for in farmers. This asset effect is similar to that found, for example, among tomato farmers in Guatemala (Hernandez, Reardon, and Berdegué 2007). Moreover, large wholesalers in urban markets require a year-round supply of produce for their varied clients, such as supermarkets, restaurants, and hotels.
Meso-level characteristics play an important role in modern- and intermediate-channel participation. Being in a high-level commercial zone favours participa-tion in the modern and intermediate channels. Moreover, the (lagged) number of packing houses in the subdistrict has a positive effect on participation in the intermediate channel by lowering transaction costs; traders in this channel tend to own those packing houses, as our pre-survey appraisal revealed. These are key results, because buyers in the food industry tend to source their products from sellers in high-level commercial zones, where transaction costs are lower and where there is more chance of inding an abundance of good-quality products to meet the market requirements. For this point in relation to contract farming, see Barrett et al.’s (2012) article.
Input-Demand Functions
Our input-demand analysis (table 7) reveals that the use of labour by farmers is more responsive to factor input prices in the modern channel than in the two other market channels. The labour demand of modern-channel farmers responds posi-tively to the price of pesticides in the labour equation, indicating that pesticides substitute for weeding labour in this channel.4 Farmers in the intermediate
chan-nel, in contrast, are not sensitive to the price of pesticides. The own-price co eficient (the wage) is negative, as expected. Owning land in Bandung has a strong posi-tive effect on labour use among modern-channel farmers, which implies that the quality demands of supermarkets require high levels of crop care and that farmers often have to irrigate their tomato plants manually during the dry season.
Our analysis also reveals that there is a strong complementarity of fertiliser use and irrigation, and that transaction costs (proxied by the distance to a paved highway) have a negative effect on fertiliser use. The demand for fertiliser and pesticides from farmers in the intermediate channel increases with rises in output
4. In this article, the term ‘pesticides’ includes herbicides. We measure pesticide use in cash expenditure on pesticides, given that pesticides are very heterogeneous and we need to aggregate by value. We measure fertiliser use in the same way for the same reason. We measure labour use in days.
TABLE 7 Input-Demand Regressions
Labour Pesticides Fertiliser
Traditional Intermediate Modern Traditional Intermediate Modern Traditional Intermediate Modern
Output price
(Rp/kg)
0.44 –1.91 –15.89** –4.28** 33.65** –69.50** –1.34 49.17** –32.48** (0.27) (4.46) (5.65) (1.15) (16.01) (11.67) (0.95) (12.25) (11.79) Labour wage
(Rp/day)
–0.01 0.02 –0.20** –0.19** –0.311** –0.70** –0.02 –0.02 –0.13** (0.01) (0.02) (0.07) (0.05) (0.07) (0.15) (0.04) (0.05) (0.15) Price of pesticides
(Rp/kg)
–0.001** 0.004 0.003** 0.90** –1.01 2.10** 0.18 –3.49** 0.18 (0.001) (0.005) (0.001) (0.14) (1.76) (0.18) (0.12) (1.35) (0.18) Price of fertiliser
(Rp/kg)
0.00 0.01 0.17** –21.77** –105.99** 696.42** –2.90 –136.60** 334.91** (0.001) (0.01) (0.06) (5.15) (44.17) (118.25) (4.27) (33.79) (119.48) Age of HH head
(years)
1.36 3.32 12.09 –7.51 –6.60 –5.56 –0.97 –6.61 6.55
(1.64) (2.59) (3.87) (6.96) (9.29) (8.00) (5.77) (7.11) (8.08)
Education of HH
head (years)
5.60 7.59 6.381 6.09 –7.80 17.87 4.00 –3.48 39.75
(7.97) (11.95) (23.62) (33.92) (42.91) (48.82) (28.12) (32.83) (49.33) HH size (members) 2.02 36.62** 78.09 –76.99 19.06 40.14 –30.55 –25.42 139.63**
(12.20) (17.68) (28.56) (51.93) (63.51) (59.02) (43.05) (48.59) (59.64)
Owned land (ha) 14.54 111.82* 71.66 –165.84** –288.00 –130.96 31.93 166.31 342.93*
(17.30) (66.01) (85.78) (73.65) (237.07) (177.26) (61.06) (181.35) (179.11)
Owned land × Bandung dummy
88.41** –12.16 230.08** –17.42 385.21 –1,406.05** 315.60** 51.50 350.55 (37.76) (114.32) (170.30) (160.79) (410.60) (558.58) (133.31) (314.10) (564.42) Distance to paved
highway (km)
43.72 63.24 63.47 110.87 –298.81* 14.69 151.86 220.94 –114.41** (31.29) (50.62) (14.53) (133.21) (181.81) (30.03) (110.44) (139.08) (30.35) % of tomato land
irrigated
–587.40** –960.50** –1,669.30 280.60 –15.70 308.80 165.70 732.30** 361.00 (64.90) (127.50) (168.90) (276.30) (458.10) (349.10) (229.10) (350.40) (352.80) Inverse Mills ratio 1 2.61* –1.04 24.98 –24.28** –20.70** –25.46 19.23** –1.03 50.82* (1.53) (2.88) (14.61) (6.53) (10.34) (30.19) (5.42) (7.91) (30.50)
Inverse Mills ratio 2 73.67** 67.41** 108.05 –142.23** –318.51** 11.26 192.70** 202.41** –195.46** (15.11) (25.72) (20.93) (64.33) (92.39) (43.25) (53.33) (70.68) (43.71) Dummy for dry
season
8.11 60.77 155.08** –3,142.10** –2,796.27** –2,017.15** –248.59** 6.31 –227.92 (32.09) (55.51) (79.59) (136.65) (199.36) (164.47) (113.29) (152.51) (166.19) Dummy for high-level
commercial zone
130.42** 173.79 204.75 920.91** –3,015.98 58.41 –673.43** –6,632.90** –685.60 (55.29) (519.23) (230.30) (235.42) (1864.85) (475.91) (195.18) (1,426.59) (480.89)
R2 0.32 0.37 0.76 0.69 0.70 0.88 0.14 0.35 0.55
Prob > F 0.00 0.00 0.00 0.00 0.00 0.00 0.00 0.00 0.00
Observations 327 179 84 327 179 84 327 179 84
Note: HH = household.
* p < 0.1; ** p < 0.05; *** p < 0.01.
442 Ricardo Hernandez, Thomas Reardon, Ronnie Natawidjaja, and Shobha Shetty
prices and decreases with rises in input prices. This suggests that farmers in this channel are sensitive to variations in input and output prices, implying a commer-cial orientation. Farmers in the traditional channel do not exhibit this sensitivity.
Estimates of Allocative Eficiencies: Comparison among Groups
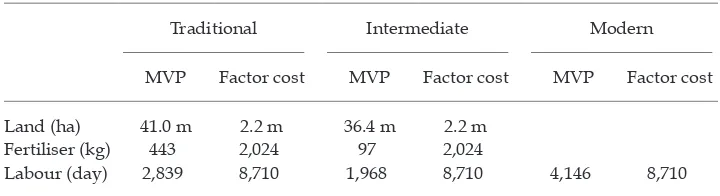
The allocative eficiencies of farmers in different market channels can be derived by estimating farm production functions, after controlling for endogenous strati-ication in each market channel. We can analyse these eficiencies by comparing the MVPs of factors such as land, fertiliser, and labour with the prices of these factors. Table 8 shows the statistically signiicant results for factors with results in the estimation of the production function.
The MVP of land is well above the factor cost of rent for farmers in the tradi-tional and intermediate channels, indicating a severe land constraint. The MVP of labour, in contrast, is well below the factor cost of wages in all channels, but the overuse of labour (from the viewpoint of allocative eficiency) is most severe among farmers in the intermediate channel. This suggests that there are not enough off-farm labour opportunities to allow these farmers to reduce their use of farm labour to eficient levels. The MVP of fertiliser, like that of labour, is well below the factor cost of an additional kilogram of fertiliser. As with labour, the overuse of fertiliser is most severe among farmers in the intermediate channel.
Overall, our analysis of MVPs shows that tomato farmers in all channels would beneit from expanding their production. Although there is evidence of the over-use of purchased variable inputs, especially by farmers in the traditional and intermediate channels, we ind that farmers in the modern channel tend to be more allocatively eficient.
CONCLUSIONS
Tomato farms in the modern channel in Indonesia may be 25% bigger than the country’s average tomato farm, but they are still small. In this channel, farm size matters only in high-level commercial zones; in the intermediate and traditional channels, farm size does not have a signiicant effect. This implies that a relative ‘exclusion effect’ exists in the modern channel. The different effects of different commercial zones on farm size in market-channel choice have not been tested in the regional literature. We also ind that commercial zones matter to farmers
TABLE 8 Marginal Value Products of Factors versus Factor Prices, by Market Channel (Rp)
Traditional Intermediate Modern
MVP Factor cost MVP Factor cost MVP Factor cost
Land (ha) 41.0 m 2.2 m 36.4 m 2.2 m
Fertiliser (kg) 443 2,024 97 2,024
Labour (day) 2,839 8,710 1,968 8,710 4,146 8,710
Note: MVP = marginal value product.
Tomato Farmers and Modernising Value Chains in Indonesia 443
participating in modern and intermediate markets (that is, those selling to super-markets and modernising wholesalers, respectively), with dense, rur-urbanised zones near highways being a key determinant. This inding is consistent with Barrett et al.’s (2012) prediction for contract farming. Infrastructure matters to market-channel modernisation.
Non-land assets—such as irrigation, in particular—are important in determin-ing the choice of the modern and intermediate channels. In our 2006 survey, while most tomato farmers adopted irrigation during the ive-year recall period for assets, the farmers in the modern channel did so irst and tended to multicrop the most. This concords with indings in the literature, such as Hernandez, Reardon, and Berdegué’s (2007) assertion that this ‘continuity’ of supply (and the quality that water control confers) is associated with the modern channel. Yet we also ind that the intermediate channel requires consistency of supply, as large urban wholesalers in this channel have among their clientele those that require a year-round tomato supply consistent in volume and quality.
Contrary to conventional wisdom, modern-channel farmers do not use pesti-cides more intensively than other farmers. In contrast, farmers in the intermedi-ate and traditional channels use more labour and fertiliser than is allocatively eficient and yet do not have higher yields than farmers in the modern channel. In fact, farmers in the modern channel earned more proit than those in the interme-diate and traditional channels (owing to a combination of slightly lower costs and modest price premiums). Our descriptive results show, however, that hardly any farmers in any channel sold graded tomatoes; in this early stage of market mod-ernisation in Indonesia, the main ‘capture of rents’ goes to specialised wholesalers for supermarkets and to modernising wholesalers. These wholesalers sell toma-toes of different qualities of and at different prices, per our pre-survey appraisal.
In Indonesia, the intermediate market channel has become a second-tier mod-ern channel. Farmers in this channel, who sell to modmod-ernising wholesalers, share several traits with farmers in the modern channel, who sell directly or indirectly to supermarkets: both groups use high levels of irrigation; increase their areas of land under tomatoes over time; and are sensitive to input prices, implying a com-mercial orientation. Yet farmers in the intermediate channel also share many traits with those in the traditional channel, such as incurring high production costs and being allocatively ineficient.
REFERENCES
Barrett, Christopher B., Maren E. Bachke, Marc F. Bellemare, Hope C. Michelson, Sudha Narayanan, and Thomas F. Walker. 2012. ‘Smallholder Participation in Contract Farm-ing: Comparative Evidence from Five Countries’. World Development 40 (4): 715–30. Blandon, Jose, Spencer Henson, and John Cranield. 2009. ‘Small-Scale Farmer Participa
-tion in New Agri-Food Supply Chains: Case of the Supermarket Supply Chain for Fruit and Vegetables in Honduras’. Journal of International Development 21 (7): 971–84. Bourguignon, François, Martin Fournier, and Marc Gurgand. 2007. ‘Selection Bias
Correc-tions Based on the Multinomial Logit Model: Monte Carlo Comparisons’. Journal of Economic Surveys 21 (1): 174–205.
Brázdik, František. 2006. ‘Non-parametric Analysis of Technical Eficiency: Factors Affect -ing Eficiency of West Java Rice Farms’. CERGE-EI Work-ing Paper 286, Center for Eco -nomic Research and Graduate Education, Eco-nomic Institute, Prague.
444 Ricardo Hernandez, Thomas Reardon, Ronnie Natawidjaja, and Shobha Shetty
Carter, Michael R., and Christopher B. Barrett. 2006. ‘The Economics of Poverty Traps and Persistent Poverty: An Asset-Based Approach’. Journal of Development Studies 42 (2): 178–99.
Dubin, Jeffrey A., and Daniel L. McFadden. 1984. ‘An Econometric Analysis of Residential Electric Appliance Holdings and Consumption’. Econometrica 52 (2): 345–62.
Hernández, Ricardo, Thomas Reardon, and Julio Berdegué. 2007. ‘Supermarkets, Whole -salers, and Tomato Growers in Guatemala’. Agricultural Economics 36 (3): 281–90. Hernández, Ricardo, Julio Berdegué, and Thomas Reardon. 2015. ‘Modernizing Wholesal
-ers and Guava Farm-ers in Mexico’. Agricultural Economics. Published electronically 12 October. http://dx.doi.org/10.1111/agec.12197.
Holloway, Garth, Christopher B. Barrett, and Simeon Ehui. 2005. ‘Bayesian Estimation of the Double Hurdle Model in the Presence of Fixed Costs’. Journal of International Agri -cultural Trade and Development 1 (1): 17–28.
Lau, Lawrence J., and Pan A. Yotopoulos. 1971. ‘A Test for Relative Eficiency and Applica -tion to Indian Agriculture’. American Economic Review 61 (1): 94–109.
Maertens, Miet, and Johan F. M. Swinnen. 2009. ‘Trade, Standards, and Poverty: Evidence from Senegal’. World Development 37 (1): 161–78.
Minten, Bart, Lalaina Randrianarison, and Johan F. M. Swinnen. 2009. ‘Global Retail Chains and Poor Farmers: Evidence from Madagascar’. World Development 37 (11): 1728–41. Puspitawati, Eka, Amos Gyau, Wendy Umberger, and Randy Stringer. 2013. ‘Determinants
of Trust in the Indonesian Potato Industry: A Comparison among Groups of Potato Farmers’. High Value Agriculture Commodities in Indonesia working paper, Interna -tional Food Policy Research Institute, Washington, DC.
Rao, Elizaphan J. O., Bernhard Brümmer, and Matin Qaim. 2012. ‘Farmer Participation in Supermarket Channels, Production Technology, and Eficiency: The Case of Vegetables in Kenya’. American Journal of Agricultural Economics 94 (4): 891–912.
Reardon, Thomas, Kevin Chen, Bart Minten, and Lourdes Adriano. 2012. The Quiet
Revo-lution in Staple Food Value Chains in Asia: Enter the Dragon, the Elephant, and the Tiger. Manila: Asian Development Bank and International Food Policy Research Institute. Rivers, Douglas, and Quang H. Vuong. 1988. ‘Limited Information Estimators and Exog
-eneity Tests for Simultaneous Probit Models’. Journal of Econometrics 39 (3): 347–66. Sadoulet, Elisabeth, and Alain de Janvry. 1995. Quantitative Development Policy Analysis.
Baltimore: Johns Hopkins University Press.
Sahara, Sahara, and Amos Gyau. 2014. ‘Contractual Arrangements and Commitment in the Indonesian Supermarket Channel’. British Food Journal 116 (5): 765–79.
Schipmann, Christin, and Matin Qaim. 2011. ‘Modern Food Retailers and Traditional Mar-kets in Developing Countries: Comparing Quality, Prices, and Competition Strategies in Thailand’. Applied Economic Perspectives and Policy 33 (3): 345–62.
Simmons, Phil, Paul Winters, and Ian Patrick. 2005. ‘An Analysis of Contract Farming in East Java, Bali, and Lombok, Indonesia’. Agricultural Economics 33, supplement s3: 513–25.
Verhofstadt, Ellen, and Miet Maertens. 2013. ‘Processes of Modernization in Horticulture Food Value Chains in Rwanda’. Outlook on Agriculture 42 (4): 273–83.
World Bank. 2007. Horticultural Producers and Supermarket Development in Indonesia. World Bank Report 38543-ID. Washington, DC: World Bank.