Students Perception on Written Material (Modules) In PJJ PGSD
Jaslin Ikhsan1,2, Herman2,3, Adie Erar Yusuf2 1
Chemistry Education Department, Yogyakarta State University, Karangmalang, Yogyakarta 2
SEAMOLEC, Jakarta, Indonesia 3
Universitas Terbuka, Jl. Cabe Raya, Pondok Cabe, Pamulang
Abstract
This paper discusses evaluation on written materials (modules) used in universities which serves hybrid mode in delivery courses. 210 students from 10 of 23 universities were selected as sample in this study. Four modules which were evaluated by students are 1). Introduction to Distance Education; 2). Self Learning; 3). Basic ICT; and 4). Learning Skill. The result showed that all modules were responsed positively by the students. Students from Java/Bali and outside Java/Bali, aggreed that the modules are easy to be read or understood. Only for Basic ICT, the students from Java/Bali and outside Java/Bali had difference. Young students and old students also had difference ability in studying Basic ICT.
Introduction
One policy of Indonesian government is that every teacher in elementary
school must have bachelor degree (Sarjana S1). In fact most of the teachers have
not had sarjana degree yet. Teachers have to find a way in upgrading their degree
to be sarjana. Problem for these teachers is they still work as teachers but they are
also students. These two jobs have to be done simultaneously.
Since 2006, Indonesia has already had prepared some Universities to educate
teacher to be sarjana in-service Training. These universities offer undergraduate
program (S1) for elementary school teachers. Teaching-learning process in these
universities is hybrid learning. Basically students learn from modules and interact
with tutor from internet. Most of the time, students spend their time to learn each
course from modules by themselves. For a certain length of time in each semester
students come to university and stay there for some weeks to follow tutorial program.
This period of time is vacation day for students. While the students are in their
vacation, the teachers visit the university to do face-to-face tutorial. The rest of the
time students-teachers study by themselves (selve-learning).
To realize its policy, government offers scholarship for 100 student-teachers for
each university. Students who follow this program are selected by local government.
Teachers who passed the selection will receive scholarship for 5-6 semesters,
When students do selve-learning, they can learn in a study-group or discussion
group in internet with other students. But they need to read the modules/written
materials first before discussing the content in a study-group. The question is ―how
good is the module?‖
Theoretical Framework
Distance education opportunities have become increasingly common in higher
education (Rooney et al., 2006). In 2005, about 62% of the 2- and 4-year higher
education institutions offered distance education courses (Rooney et al., 2006), up
from 56% in 2001 (Waits & Greene, 2003).
In response to the growing demand for a clear definition of quality in distance
education, different organizations have provided guidelines and standards (American
Distance Education Consortium, 2003a, 2003b; American Federation of Teachers,
2000; Chickering & Gamson, 1987, as cited in Chickering & Ehrmann, 1996; Phipps
& Merisotis, 2000; J. C. Moore, 2004; The Quality Assurance Agency for Higher
Education, 1999; Western Cooperative for Educational Telecommunications Project,
2003). A review of the published standards reveals a high degree of congruence
among them (Twigg, 2001b). A successful education is associated with a number of
factors. The quality of the learning experience, and the expectations that learners
bring to the table are among the most important ones (Rooney et al., 2006).
Quality in distance education has been analyzed extensively using a top-down
approach: one that considers the infrastructure, the design of the course, the support
services available to students, and other hygiene factors conducive to help students
complete their degrees (Ortiz-Rodriguez, Telg, Irani, Roberts, & Rhoades, 2005).
Other studies have concentrated on analyzing the learning as a result of online
dialogue (Haavind, 2004). Clark (2001) and Kozma (1994) propose a focus on
effective and efficient ways to provide quality in distance education, which have little
to do with the delivery mechanism, and more to do with teaching strategies designed
to encourage analysis and understanding.
Simonson (2005) points out that if distance education is to enter the
mainstream, quality must be in the mainstream as well. Delivering quality e-learning
represents a considerable monetary investment for the institution that offers it, and
A common mistake when measuring quality in distance education is to equate
success with increased enrolments. Quantity is not quality (Ström, 2004; U.S.
National Commission on Libraries and Information Science, 2001). Concentrating on
quantity will inevitably lead to commoditization of the education provided. If
commoditization occurs, competition will focus on price, not on quality, which will
undoubtedly have devastating consequences for those institutions that don’t operate
at the lowest cost in the market (Weigel, 2000).
Hemlata (2005) asserts that the four main issues encountered by
administrators when implementing online education at their institution are
sustainability, quality, organization, and learner support system. Administrators seem
to agree to a systematic approach to online learning, one that must begin with a
careful analysis and further strengthening of the mission statement of the
organization.
According to Evans & Lockee (2008), instructional design (ID) offers a
systematic process for ensuring the development of effective learning environments.
The creation of learning solutions through ID is typically based on a model that
serves as a framework for the design and development process. In the world of
distance education, the application of such processes are as important, if not more
so. While distance education reflects a specific context for which instructional
programming is produced, it maintains inherent features that require a customized
model to guide development for this delivery approach. As stated by Head, Lockee,
and Oliver (2002), distance education presents a myriad of different (and sometimes
new or difficult) parameters regarding how the instructional program has to be
delivered. Simply considering the delivery technologies that may be employed for
distance courses gives insight to the types of challenges that need to be planned for
designing such instruction. What if a particular system of providing distance
education has limited (or nonexistent) face-to-face interactions? Do time delays exist
among members of the learning community? Is the targeted class synchronous,
asynchronous, or a blend of both? Professors teaching in distance education
environments are aware that there are other complexities as well: what technologies
are available, how easy are they to use, what are the uses; what is possible,
probable, unlikely, or impossible to do? These considerations should factor into how
instruction will be organized, developed, presented, delivered, and ultimately
In fact, students mostly will learn from written materials. All materials for
courses should be in the modules. Readability of modules should be good to help
students learn the materials easily. It is expected that students will have good
preparation before they involve in residential activity (face-to-face tutorials).
The Purpose of Study
This study is aimed to investigate modules (written materials) quality base on
students perception. Four modules which are 1) Introduction to Distance Education;
2) Self Learning; 3) Basic ICT; and 4) Learning Skill were evaluated by students.
Methodology
Students as respondents were selected from 10 of 23 universities which run
hybrid learning in Indonesia. The respondents were chosen in face-to-face tutorial
process. 42 statements in questionnaire were developed to measure students’
perception on four modules. Respondents were asked to answer the statements
with 1= not-satisfied-at-all, 2=not-satisfied, 3-satisfied, and 4=very-satisfied.
Beside evaluation on written materials, students’ perception from universities in
Java/Bali and outside Java/Bali were also compared. Comparison between sexes
and between ages on students’ perception were also studied.
Data were analyzed by using analysis factor and manova. Analysis factor
(confirmatory) was to factorized statements for each module. Meanwhile manova
was used to see the differences on students’ perceptions on the quality of modules
between universities in Java/Bali and outside Java/Bali; between male and female
students; and also between groups of ages.
Research Design
Modules Locations Sex Ages
Java/Bali Outside Java/Bali
Male Female Young Adult Old
Intro. to ODL
11
X
X
12X
13X
14X
15X
16X
17Self Learning
21
X
X
22X
23X
24X
25X
26X
27Basic ICT
31
X
X
32X
33X
34X
35X
36X
37Learning Skill
41
Researh Questions
1. Is there any difference on students’ perception in the quality of the four modules
between universities in Java/Bali and outside Java/Bali?
2. Is there any difference on students’ perception in the quality of the four modules
between male and female students?
3. Is there any difference on students’ perception in the quality of the four modules
between students’ age-groups?
Hypothesis 2 1 1 2 1 0
:
4
,
3
,
2
,
1
,
:
i i i iH
i
H
4 3 1 4 3 0:
4
,
3
,
2
,
1
,
:
i i i iH
i
H
0 1 7 6 5 0:
4
,
3
,
2
,
1
,
:
H
not
H
i
H
i
i
i
Result and Discussion
Respondents were collected from 5 Universities in Java/Bali and 5 universities
from outside Java/Bali. The number of students was 210 consisted of 96 male and
114 female. 6 respondents did not fill their age, 42 respondents were 20-30 years old
(young), 78 respondents were 31-40 years old (adult) and 84 respondents were
more than 40 years old (old).
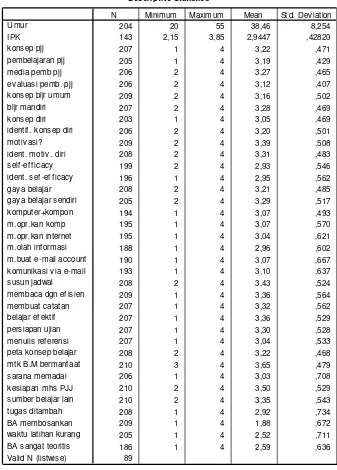
N in table 1 showed that not all respondents filled the information in the
questionnaire, only 89 respondents filled the information completely. Mean value of
Students’ GPA was 2,945 with standard deviation 0,428.
For the statements no.8 – 42 (started from ―konsep PJJ‖ in table 1) in this
Statement ―BA membosankan‖ or ―module is boring‖ in statement no. 40 had mean
value of 1,88. This is a negative statement which has reverse meaning. Therefore all
Tabel 1. Descriptive Statistics
Descriptive Statistics
204 20 55 38,46 8,254
143 2,15 3,85 2,9447 ,42820
207 1 4 3,22 ,471
205 1 4 3,19 ,429
206 2 4 3,27 ,465
206 2 4 3,12 ,407
209 2 4 3,16 ,502
207 2 4 3,28 ,469
203 1 4 3,05 ,469
206 2 4 3,20 ,501
209 2 4 3,39 ,508
208 2 4 3,31 ,483
199 2 4 2,93 ,546
196 1 4 2,95 ,562
208 2 4 3,21 ,485
205 2 4 3,29 ,517
194 1 4 3,07 ,493
195 1 4 3,07 ,570
195 1 4 3,04 ,621
188 1 4 2,96 ,602
190 1 4 3,07 ,667
193 1 4 3,10 ,637
208 2 4 3,43 ,524
209 1 4 3,36 ,564
207 1 4 3,32 ,562
207 1 4 3,36 ,529
207 1 4 3,30 ,528
207 1 4 3,04 ,533
208 2 4 3,22 ,468
210 3 4 3,65 ,479
206 1 4 3,03 ,708
210 2 4 3,50 ,529
210 2 4 3,35 ,543
208 1 4 2,92 ,734
209 1 4 1,88 ,672
205 1 4 2,52 ,711
186 1 4 2,59 ,636
89 Umur
IPK konsep pjj pembelajaran pjj media pemb pjj ev aluasi pemb. pjj konsep bljr umum bljr mandiri konsep diri identif . konsep diri motiv asi? ident. motiv . diri self -ef f icacy ident. sef -ef f icacy gay a belajar gay a belajar sendiri komputer+kompon m.opr. kan komp m.opr. kan internet m.olah inf ormasi m.buat e-mail account komunikasi v ia e-mail susun jadwal membaca dgn ef isien membuat catat an belajar ef ektif persiapan ujian menulis ref erensi peta konsep belajar mtk B.M bermanf aat sarana memadai kesiapan mhs PJJ sumber belajar lain tugas ditambah BA membosankan waktu latihan kurang BA sangat teoritis Valid N (listwise)
N Minimum Maximum Mean St d. Dev iation
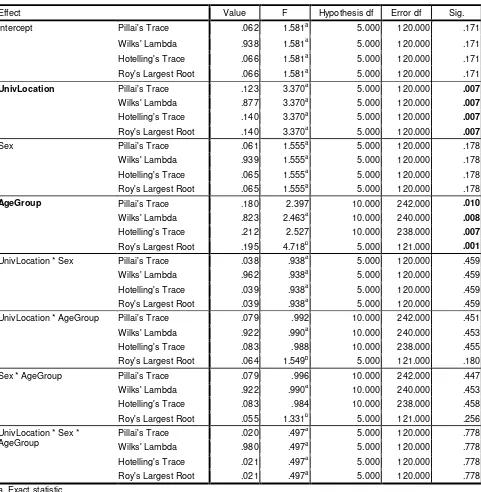
Table 2 shows the result of multivariate test. The four modules, based on students’
Table 2. Multivariate Test
Multivariate Testsc
Effect Value F Hypothesis df Error df Sig.
Intercept Pillai's Trace .062 1.581a 5.000 120.000 .171
Wilks' Lambda .938 1.581a 5.000 120.000 .171
Hotelling's Trace .066 1.581a 5.000 120.000 .171
Roy's Largest Root .066 1.581a 5.000 120.000 .171
UnivLocation Pillai's Trace .123 3.370a 5.000 120.000 .007
Wilks' Lambda .877 3.370a 5.000 120.000 .007
Hotelling's Trace .140 3.370a 5.000 120.000 .007
Roy's Largest Root .140 3.370a 5.000 120.000 .007
Sex Pillai's Trace .061 1.555a 5.000 120.000 .178
Wilks' Lambda .939 1.555a 5.000 120.000 .178
Hotelling's Trace .065 1.555a 5.000 120.000 .178 Roy's Largest Root .065 1.555a 5.000 120.000 .178
AgeGroup Pillai's Trace .180 2.397 10.000 242.000 .010
Wilks' Lambda .823 2.463a 10.000 240.000 .008
Hotelling's Trace .212 2.527 10.000 238.000 .007
Roy's Largest Root .195 4.718b 5.000 121.000 .001
UnivLocation * Sex Pillai's Trace .038 .938a 5.000 120.000 .459
Wilks' Lambda .962 .938a 5.000 120.000 .459
Hotelling's Trace .039 .938a 5.000 120.000 .459
Roy's Largest Root .039 .938a 5.000 120.000 .459 UnivLocation * AgeGroup Pillai's Trace .079 .992 10.000 242.000 .451
Wilks' Lambda .922 .990a 10.000 240.000 .453
Hotelling's Trace .083 .988 10.000 238.000 .455
Roy's Largest Root .064 1.549b 5.000 121.000 .180
Sex * AgeGroup Pillai's Trace .079 .996 10.000 242.000 .447
Wilks' Lambda .922 .990a 10.000 240.000 .453
Hotelling's Trace .083 .984 10.000 238.000 .458
Roy's Largest Root .055 1.331b 5.000 121.000 .256 UnivLocation * Sex *
AgeGroup
Pillai's Trace .020 .497a 5.000 120.000 .778
Wilks' Lambda .980 .497a 5.000 120.000 .778
Hotelling's Trace .021 .497a 5.000 120.000 .778
Roy's Largest Root .021 .497a 5.000 120.000 .778 a. Exact statistic
b. The statistic is an upper bound on F that yields a lower bound on the significance level.
From table 2, it can be seen that there were some differences on four modules
in students’ perception between university locations and between age group. There
was no differences between sex. Statistics also showed that there was no interaction
[image:11.595.78.579.204.727.2]effect. Further analysis in table 3 show in what factors (modules) they were differed.
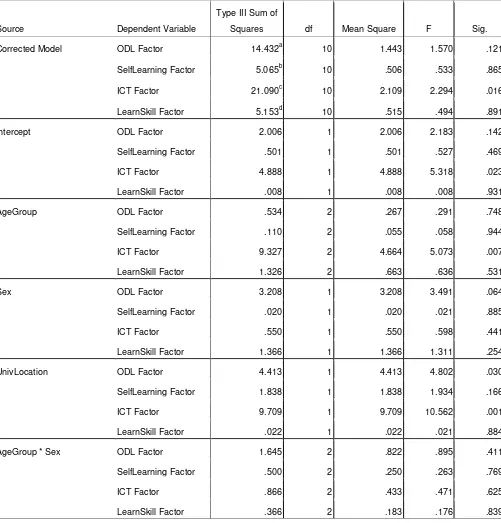
Table 3
Tests of Between-Subjects Effects
Source Dependent Variable
Type III Sum of
Squares df Mean Square F Sig.
Corrected Model ODL Factor 14.432a 10 1.443 1.570 .121
SelfLearning Factor 5.065b 10 .506 .533 .865
ICT Factor 21.090c 10 2.109 2.294 .016
LearnSkill Factor 5.153d 10 .515 .494 .891
Intercept ODL Factor 2.006 1 2.006 2.183 .142
SelfLearning Factor .501 1 .501 .527 .469
ICT Factor 4.888 1 4.888 5.318 .023
LearnSkill Factor .008 1 .008 .008 .931
AgeGroup ODL Factor .534 2 .267 .291 .748
SelfLearning Factor .110 2 .055 .058 .944
ICT Factor 9.327 2 4.664 5.073 .007
LearnSkill Factor 1.326 2 .663 .636 .531
Sex ODL Factor 3.208 1 3.208 3.491 .064
SelfLearning Factor .020 1 .020 .021 .885
ICT Factor .550 1 .550 .598 .441
LearnSkill Factor 1.366 1 1.366 1.311 .254
UnivLocation ODL Factor 4.413 1 4.413 4.802 .030
SelfLearning Factor 1.838 1 1.838 1.934 .166
ICT Factor 9.709 1 9.709 10.562 .001
LearnSkill Factor .022 1 .022 .021 .884
AgeGroup * Sex ODL Factor 1.645 2 .822 .895 .411
SelfLearning Factor .500 2 .250 .263 .769
ICT Factor .866 2 .433 .471 .625
AgeGroup * UnivLocation ODL Factor 2.053 2 1.027 1.117 .330
SelfLearning Factor .639 2 .320 .336 .715
ICT Factor 2.188 2 1.094 1.190 .307
LearnSkill Factor .423 2 .212 .203 .817
Sex * UnivLocation ODL Factor 1.014 1 1.014 1.103 .295
SelfLearning Factor .085 1 .085 .089 .766
ICT Factor 1.181 1 1.181 1.285 .259
LearnSkill Factor 1.505 1 1.505 1.443 .232
AgeGroup * Sex *
UnivLocation
ODL Factor 1.237 1 1.237 1.347 .248
SelfLearning Factor .040 1 .040 .042 .837
ICT Factor .020 1 .020 .022 .882
LearnSkill Factor .021 1 .021 .020 .888
Error ODL Factor 128.658 140 .919
SelfLearning Factor 133.051 140 .950
ICT Factor 128.693 140 .919
LearnSkill Factor 145.926 140 1.042
Total ODL Factor 143.189 151
SelfLearning Factor 138.189 151
ICT Factor 149.784 151
LearnSkill Factor 151.079 151
Corrected Total ODL Factor 143.091 150
SelfLearning Factor 138.116 150
ICT Factor 149.784 150
LearnSkill Factor 151.079 150
a. R Squared = ,101 (Adjusted R Squared = ,037)
b. R Squared = ,037 (Adjusted R Squared = -,032)
c. R Squared = ,141 (Adjusted R Squared = ,079)
d. R Squared = ,034 (Adjusted R Squared = -,035)
ICT factor become the only factor which had differences in university location
and age groups (significant at < 0,01). From Table 4, it can be seen that
perception on ICT Factor from students in Java/Bali is higher than students’ from
outside Java/Bali. Java/Bali has more facilities in electricity and in IT infrastructure.
Students who live in these two islands have more access to those facilities than
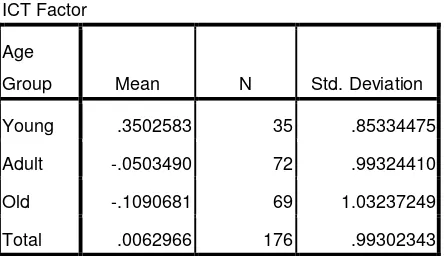
Young students’ perception on ICT was also higher than older students. In
fact, ICT is always developed from time to time. When people do not follow this new
technology, he or she will be left behind. This information showed that young people
is more diligent in following the development of ICT, including young teachers. In
other courses, there is no difference between age groups or between university
[image:13.595.179.401.428.556.2]locations..
Table 4. Mean Value of ICT-Factor Based on Location
ICT Factor * University Location
ICT Factor
University Location Mean N Std. Deviation
Java/Bali .2990612 52 .85043861
Outside Java/Bali -.1205518 129 1.03300602
Total .0000000 181 1.00000000
Table 5. Mean Value of ICT-Factor Based on Age Group
ICT Factor * Age Group
ICT Factor
Age
Group Mean N Std. Deviation
Young .3502583 35 .85334475
Adult -.0503490 72 .99324410
Old -.1090681 69 1.03237249
Conclusion
Written materials (modules) as one of sources for the students to achieve a
certain level of competencies in reaching sarjana degree (S1) should have at least
good quality. Although developing written material involved many expertises in
content and design, students as users are still needed to evaluate its quality based
on their perception. As users, students always read modules when they are studying.
Process in reading modules will give experiences in how hard or easy the module is.
Students’ experienced in studying from modules will influence students’ perception in evaluating modules.
In general, all students gave positive perception for written material (modules).
This is a good sign from the users’ perspective. Although the modules quality is good
but there are some differences between students perception. Students’ perception
showed the difference in Basic ICT. Students from Java/Bali had better perception
than students from outside Java/Bali.
Distance education is usually dominated by adult students. Young people most
likely will choose face-to-face university. However, young people who are in distance
education in this study showed that they learn ICT more easily than old students.
References
Chickering, A. W., & Ehrmann, S. C. (1996, October, 3-6). Implementing the seven principles:technology as lever. American Association for Higher Education bulletin. Retrieved October 16, 2006, from
http://www.tltgroup.org/programs/seven.html
Clark, R. E. (Ed.). (2001). Learning from media. Greenwich, CT: Information Age.
Evans, A.D & Lockee, B.B. (2008). At A Distance: An Instructional Design Framework for Distance Education. Distance Learning. 5(3).
Head, J.T., Lockee, B.B. & Oliver, K.M. (2002). Method, media, and mode: Clarifying the discussion of distance education effectiveness. Quarterly Review of Distance Education, 3(3). 261-268.
Hemlata, C. (2005). Administrative and implementation issues at YCMOU, an Indian open and distance education university (Doctoral dissertation, University of Alberta, Canada, 2005). Dissertation Abstracts International, 66(10), April 2006. (UMI No. NR08213).
Moore, J. C. (2004). Synthesis of C effective practices. Needham, MA: Sloan-C
Ortiz-Rodriguez, M., Telg, R. W., Irani, T., Roberts, T. G., & Rhoades, E. (2005).
College students’ perceptions of quality in distance education. Quarterly
Review of Distance Education, 6(2), 97-105.
Phipps, R., & Merisotis, J. (2000). Quality on the line—benchmarks for success in internet-based distance education. Washington, DC: The Institute for Higher Education Policy.
Rooney, P., Hussar, W., Planty, M., Choy, S., Hampden-Thompson, G., Provasnik, S., et al. (2006). The condition of education 2006 (NCES 2006-071). Washington, DC: National Center for Education Statistics. Retrieved October 16, 2006, from http://nces.ed.gov/pubs2006/2006071.pdf
Simonson, M. (2005). Entering the mainstream. Distance education and higher education. The Quarterly Review of Distance Education, 6(1), vii-viii.
Ström, N. (2004). Ask the library. Scandinavian Public Library, 3, 8-11.
Twigg, C. A. (2001b). Quality assurance for whom? Troy, NY: Center for Academic Transformation, Rensselaer Polytechnic Institute.
Waits, T., & Greene, B. (2003). Distance education at degree-granting postsecondary institutions: 2000-2001 (NCES 2003-017). Washington, DC: National Center for Education Statistics. Retrieved October 16, 2006, from
http://nces.ed.gov/pubs2003/2003017.pdf