Summary Global climatic change may cause changes in re-gional precipitation that have important implications for forest growth in the southern United States. In 1993, a stand-level ex-periment was initiated on Walker Branch Watershed, Tennes-see, to study the sensitivity of forest saplings and large trees to changes in soil water content. Soil water content was manipu-lated by gravity-driven transfer of precipitation throughfall from a dry treatment plot (–33%) to a wet treatment plot (+33%). A control plot was included. Each plot was 6400 m2. Measurements of stem diameter and observations of mortality were made on large trees and saplings of Acer rubrum L., Cornus floridaL.,Liriodendron tulipiferaL.,Nyssa sylvatica Marsh,Quercus albaL. andQuercus prinusL. every 2 weeks during six growing seasons. Saplings of C. florida and A.rubrumgrew faster and mortality was less on the wet plot compared with the dry and control plots, through 6 years of soil water manipulation. Conversely, diameter growth of large trees was unaffected by the treatments. However, tree diameter growth averaged across treatments was affected by year-to-year changes in soil water status. Growth in wet year-to-years was as much as 2–3 times greater than in dry years. Relationships be-tween tree growth, phenology and soil water potential were consistent among species and quantitative expressions were developed for application in models. These field growth data indicate that differences in seasonal patterns of rainfall within and between years have greater impacts on growth than per-centage changes in rainfall applied to all rainfall events. Keywords: Acer rubrum, Cornus florida, climate change, drought, Liriodendron tulipifera, Nyssa sylvatica, phenology, Quercus alba, Quercus prinus, soil water.
Introduction
Continuing increases in greenhouse gas concentrations are ex-pected to induce a 1 to 3.5 °C increase in mean global land sur-face temperature by the year 2100 (Kattenberg et al. 1996). This warming is expected to modify the hydrologic cycle, leading to increased winter precipitation at high latitudes, more hot days and fewer cold days, and changes in the num-bers of droughts or floods depending on location (Rind et al.
1990, Kattenburg et al. 1996). Changes in climate have also raised concerns about potential impacts of temperature and precipitation on terrestrial ecosystem productivity, biogeo-chemical cycling, and the availability of water resources (Melillo et al. 1990, 1996, Kirschbaum and Fischlin 1996). Forest responses to decreased soil water availability or in-creased drought frequency or intensity, or both, are key issues associated with climatic change (Wigley et al. 1984, Gregory et al. 1997), and Neilson et al. (1989) concluded that forests throughout the USA could be severely impacted by climate warming. This might be especially so in the southeastern states, where potential evapotranspiration is predicted to in-crease and exceed future summer precipitation (Smith and Tirpak 1990, Melillo et al. 1995 and http://goldhill.cgd.ucar. edu/vemap/). Both the direction and magnitude of future pre-cipitation changes are uncertain, however, and scenarios for regional climatic change are only preliminary (Schneider 1989, Mohnen and Wang 1992, Rind et al. 1992, Cooter et al. 1993). Nonetheless, climatic change during the next several decades may exceed the ability of forests to adapt through changes in species composition (Pastor and Post 1988, Davis 1989, Overpeck et al. 1991). This possibility is supported by model predictions indicating that future climatic change will lead to extensive forest dieback and species migration (Solo-mon 1986, Leverenz and Lev 1987, Pastor and Post 1988). However, these predictions have been questioned (Fischlin et al. 1995, Loehle and LeBlanc 1996). The evaluation of model predictions with long-term and large-scale manipulative stud-ies is needed to reduce uncertainty about impacts of climatic change (Mooney 1991, Woodward 1992).
To study impacts of precipitation changes on forest produc-tivity and ecosystem processes, Hanson et al. (1995, 1998) im-plemented the Walker Branch Throughfall Displacement Ex-periment (TDE) to modify soil water availability in an upland oak forest over several years. This paper describes daily growth, annual growth and mortality of saplings and large trees during 6 years (1994–1999) of throughfall manipulation. Growth and mortality integrate physiological responses to wa-ter stress, and represent key end points for the investigation of forest response. We hypothesized that small-stature vegeta-tion (saplings) are more sensitive to altered soil water content
© 2001 Heron Publishing—Victoria, Canada
A six-year study of sapling and large-tree growth and mortality
responses to natural and induced variability in precipitation and
throughfall
PAUL J. HANSON, DONALD E. TODD, JR. and JEFFREY S. AMTHOR
Environmental Sciences Division, Oak Ridge National Laboratory, Oak Ridge, Tennessee 37831-6422, USA
than canopy trees, because they have limited rooting depth and smaller carbohydrate reserves. Intra-annual growth data for non-stress versus drought periods were also combined with soil water potential data to yield quantitative relationships be-tween soil water potential and tree basal area growth rate. Such relationships may provide modelers with better methods for predicting growth responses to soil water deficits in eastern hardwood forests.
Materials and methods
Experimental system
The experimental system and its performance have been de-scribed in detail by Hanson et al. (1995, 1998). Manipulations of throughfall amounts reaching the forest floor were made by passively transferring a fraction of the throughfall from one experimental plot to another. There were three (80 × 80 m) ex-perimental plots: one wet, one dry and one control. Each plot was divided into 100, 8 × 8 m subplots that served as locations for repetitive, nondestructive measurements of soil and plant characteristics. An 8-m buffer zone around the edge of all plots (16 m between plots) was treated but not used for the ob-servations of tree and sapling growth. On the dry plot, throughfall precipitation was intercepted in about 1900 be-low-canopy troughs (0.3 × 5 m) made of greenhouse-grade polyethylene that were suspended at an angle above the forest floor (~33% of the ground area was covered). The intercepted throughfall was transferred by gravity flow across the control plot and distributed onto the wet treatment plot through paired drip holes spaced about 1 m apart. The troughs were arranged in 21 rows of about 80 to 90 troughs each. Subplots of troughs containing holes were included on the wet and control plots until 1996. The subplots were removed after impacts of trough infrastructure on understory microclimate were found to be small (Hanson et al. 1995).
The experimental area was located at the upper divide of the watershed, so that lateral flow of water into the plots from up-slope did not occur. The site had a southern aspect. Reduc-tions in soil water content anticipated from the experimental removal of 33% of the throughfall were designed to be compa-rable to that of the growing season having the lowest recorded rainfall during the dry 1980s (Cook et al. 1988), which re-sulted in sapling mortality and reduced growth of some vege-tation (Jones et al. 1993).
Site description
The experiment was located on the Walker Branch Watershed (35°58′N and 84°17′W), part of the U.S. Department of
En-ergy’s (DOE’s) National Environmental Research Park near Oak Ridge, Tennessee (Johnson and Van Hook 1989). Long-term (50-year) mean annual precipitation is 1352 mm and mean annual temperature is 14.2 °C. The acidic forest soils (pH 3.5 to 4.6) are primarily typic Paleudults. Plant extractable water (water held between 0 and –2.5 MPa) for the upper 1 m of soil is approximately 183 mm. A large fraction of
this water (44%) is held in the upper 0.35 m of the soil profile, which contains 60% of all fine roots in the 0–0.90-m soil pro-file (Joslin and Wolfe 1998). Depth to bedrock at this location is approximately 30 m, so deep rooting may be a source of some water. The site was chosen because of its uniform slope, consistent soils and a reasonably uniform distribution of vege-tation. Early aerial photographs show that the TDE study area was forested in the late 1930s, but several large dominant trees show open growth characteristics, an indication of some har-vesting before that time.
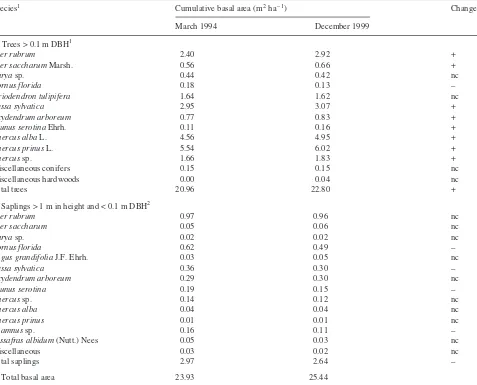
Before the experiment, all trees greater than 0.1 m in diame-ter at 1.3 m height (diamediame-ter at breast height, DBH) were iden-tified to species (729 individual trees), and heights and crown widths were measured directly or derived from allometric re-lationships from a subset of the measured data.Quercusspp. andAcerspp. were the major canopy dominants,Liriodendron tulipiferaL. was a canopy dominant on the lower slope posi-tions, andNyssa sylvaticaMarsh. andOxydendrum arboreum (L.) D.C. were the predominant species occupying mid-can-opy locations. In March 1994, stand basal area averaged 21 m2 ha–1, with nearly identical basal area on each plot. By Decem-ber 1999, mean basal area across all plots had increased to 22.8 m2ha–1(Table 1). The number of saplings (trees < 0.1 m DBH) across the TDE area averaged 3073 ha–1in 1994 and 2112 ha–1in 1999. Saplings contributed an additional 3 and 2.6 m2ha–1to total stand basal area in 1994 and 1999, respec-tively (Table 1).Acer rubrum L. andCornus florida L. to-gether made up 59% of all saplings and 53% of the sapling basal area.
Soil water content, water potential and weather
Soil water content (%, v/v) was measured with a time domain reflectometer (TDR) (Soil Moisture Equipment Corp., Santa Barbara, CA) following the procedure of Topp and Davis (1985) as documented for soils with high coarse fraction con-tent (Drungil et al. 1987). Three hundred and ten sampling lo-cations were installed at an 8 × 8 m spacing across the site, giving more than 100 soil water monitoring locations per plot. At each location, two pairs of TDR wave-guides were in-stalled in a vertical orientation (0–0.35- and 0–0.7-m soil depths). The surface (0–0.35-m soil depth) TDR measure-ments coincide with the zone of maximum root density in these soils. The TDR measurements were obtained every 2 weeks during the growing season and approximately monthly during the dormant season.
The TDR soil water content measurements were adjusted for the coarse fraction of these soils (mean coarse fraction of 14%) and converted to soil water potentials based on labora-tory-derived soil water retention curves for the A, A/E and E/B horizons (Hanson et al. 1998, http://www.esd.ornl.gov/pro-grams/WBW/TDEPERFA.HTM).
soil water potentials for the 0–0.35-m soil depth for the water stress integral. Water stress integrals were estimated using a combination of measured soil water potential data and mod-eled interpolations for periods without data. Modmod-eled interpo-lations were executed with a revised version of the TEHM/PROSPER model (Huff et al. 1977, Luxmoore 1983) coded using “Ithink” modeling software (High Performance Systems, Hanover, NH).
Weather data (Table 2) including air temperature, relative humidity and soil temperatures (at 0.1- and 0.35-m soil depths) were logged hourly on each treatment plot. Rainfall, solar irradiance (pyranometer sensor, LI-2005A, Li-Cor Inc., Lincoln, NE) and photosynthetic photon flux density (Li-Cor quantum sensor, LI-1915A) were also measured continuously and logged as hourly means.
Measurements of tree growth and mortality
Diameter growth and mortality of all trees greater than 0.1 m
DBH was recorded annually.Quercus alba, Q.prinus, Acer rubrum, Liriodendron tulipifera, and Nyssa sylvatica trees greater than 0.2 m DBH were fitted with dendrometer bands (n= 170) for biweekly measurements of stem circumference during each growing season. These species made up almost 80% of the basal area of the experimental area (Table 1). Al-though most species were uniformly distributed across the plots, the distribution ofQ.albaandQ.prinuswas not uni-form.Quercus albadominated in the wet plot, andQ.prinus dominated in the dry plot. Because of this nonuniformity, the twoQuercusspecies were combined for analyses of treatment effects. The twoQuercusspecies were kept separate for re-gression analysis of intra-annual growth differences as a func-tion of soil water potential.
A single dendrometer measurement consists of duplicate digital caliper measurements (0.01 mm resolution) of the dis-tance between two reference holes in stainless steel dendro-meter bands (25.4 mm wide × 0.2 mm thick) installed around Table 1. Cumulative basal area of (A) individual tree species > 0.1 m DBH and (B) saplings across the Throughfall Displacement Experiment in March 1994 and December 1999. The direction of change is also indicated. Abbreviation: nc = no change.
Species1 Cumulative basal area (m2ha–1) Change
March 1994 December 1999
A. Trees > 0.1 m DBH1
Acer rubrum 2.40 2.92 +
Acer saccharumMarsh. 0.56 0.66 +
Caryasp. 0.44 0.42 nc
Cornus florida 0.18 0.13 –
Liriodendron tulipifera 1.64 1.62 nc
Nyssa sylvatica 2.95 3.07 +
Oxydendrum arboreum 0.77 0.83 +
Prunus serotinaEhrh. 0.11 0.16 +
Quercus albaL. 4.56 4.95 +
Quercus prinusL. 5.54 6.02 +
Quercussp. 1.66 1.83 +
Miscellaneous conifers 0.15 0.15 nc
Miscellaneous hardwoods 0.00 0.04 nc
Total trees 20.96 22.80 +
B. Saplings > 1 m in height and < 0.1 m DBH2
Acer rubrum 0.97 0.96 nc
Acer saccharum 0.05 0.06 nc
Caryasp. 0.02 0.02 nc
Cornus florida 0.62 0.49 –
Fagus grandifoliaJ.F. Ehrh. 0.03 0.05 nc
Nyssa sylvatica 0.36 0.30 –
Oxydendrum arboreum 0.29 0.30 nc
Prunus serotina 0.19 0.15 –
Quercussp. 0.14 0.12 nc
Quercus alba 0.04 0.04 nc
Quercus prinus 0.01 0.01 nc
Rhamnussp. 0.16 0.11 –
Sassafras albidum(Nutt.) Nees 0.05 0.03 nc
Miscellaneous 0.03 0.02 nc
Total saplings 2.97 2.64 –
C. Total basal area 23.93 25.44
1 A total of 18 individual tree species were present in the > 0.1 m DBH size range, but some groups were combined for presentation. 2
the circumference of each tree (McLaughlin and Downing 1996). Measured changes in the circumference of each tree were used to calculate change in stem basal area over time (mm2 day–1 or mm2 year–1). Dendrometer bands were in-stalled on theQ.alba,Q.prinus, andA.rubrumtrees prior to the 1993 growing season and bands for L. tulipifera and N.sylvaticawere added in February of 1994. All dendrometer bands were installed during the dormant season, ahead of the initial growth measurements, to eliminate potential first year bias in the dendrometer band measurements (Keeland and Sharitz 1993).
Winter stem shrinkage (Winget and Kozlowski 1964, 1965) or stem shrinkage coincident with bud break was observed to varying degrees for all species measured. Therefore, cumula-tive growth or biweekly growth rate integrals, or both, were calculated only after recovery from shrinkage. Because the in-cremental basal area changes over 2 weeks were large com-pared with reported diurnal shrink–swell patterns for our tree
species (Haasis 1934, Kozlowski 1971, Kramer and Kozlowski 1979, Kozlowski 1982), diurnal patterns of stem shrinkage were assumed to be unimportant to this study.
Measurements of sapling growth and mortality
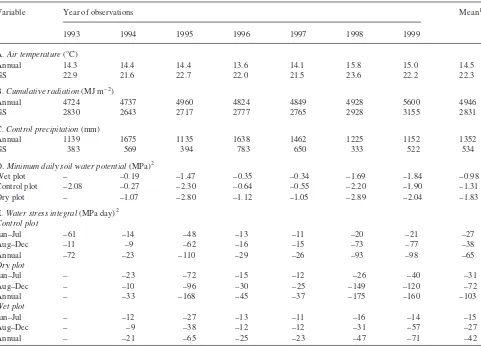
In February and March 1994, 10 transects for observations of sapling growth and mortality were established across the three plots from lower- to upper-slope positions. Although other species were considered for these measurements, onlyA. rub-rumandC. floridawere distributed across the TDE in suffi-cient numbers for inclusion. Saplings ranged from 10 to 60 mm DBH with the majority from 10 to 40 mm DBH. Height measurements were not included because the crowns were broad, without predominant main shoots, and because height growth was minimal in the low light understory environment of our closed canopy stand. Starting at the time of spring bud break each year, biweekly measurements of stem diameter at a permanently marked location on each sapling’s main stem Table 2. Weather and soil water variables for each year of the study including: (A) mean air temperature for the year and growing season; (B) cu-mulative radiation for the full year and the growing season; (C) total annual precipitation; (D) minimum soil water potential by treatment; and (E) water stress integrals by treatment. The growing season (GS) is defined as the May through September period.
Variable Year of observations Mean1
1993 1994 1995 1996 1997 1998 1999
A.Air temperature(°C)
Annual 14.3 14.4 14.4 13.6 14.1 15.8 15.0 14.5
GS 22.9 21.6 22.7 22.0 21.5 23.6 22.2 22.3
B.Cumulative radiation(MJ m–2)
Annual 4724 4737 4960 4824 4849 4928 5600 4946
GS 2830 2643 2717 2777 2765 2928 3155 2831
C.Control precipitation(mm)
Annual 1139 1675 1135 1638 1462 1225 1152 1352
GS 383 569 394 783 650 333 522 534
D.Minimum daily soil water potential(MPa)2
Wet plot – –0.19 –1.47 –0.35 –0.34 –1.69 –1.84 –0.98
Control plot –2.08 –0.27 –2.30 –0.64 –0.55 –2.20 –1.90 –1.31
Dry plot – –1.07 –2.80 –1.12 –1.05 –2.89 –2.04 –1.83
E.Water stress integral(MPa day)2 Control plot
Jan–Jul –61 –14 –48 –13 –11 –20 –21 –27
Aug–Dec –11 –9 –62 –16 –15 –73 –77 –38
Annual –72 –23 –110 –29 –26 –93 –98 –65
Dry plot
Jan–Jul – –23 –72 –15 –12 –26 –40 –31
Aug–Dec – –10 –96 –30 –25 –149 –120 –72
Annual – –33 –168 –45 –37 –175 –160 –103
Wet plot
Jan–Jul – –12 –27 –13 –11 –16 –14 –15
Aug–Dec – –9 –38 –12 –12 –31 –57 –27
Annual – –21 –65 –25 –23 –47 –71 –42
1
The mean for annual precipitation is the 50-year mean based on data gathered since 1949. All other means are for the years shown.
2 Values for the integrated water stress integral and minimum daily soil water potential are estimates from a model of the water budget for these
(typically between 1 and 1.5 m above ground) were conducted until sapling growth had ceased for that year. Each stem cali-per measurement was the mean of three replicate diameter measurements made with a digital caliper (0.01 mm resolu-tion) from three different angles around the marked point of measurement. The mean of replicate measurements from dif-ferent angles was required to minimize the impact of noncircular stem cross sections. Sapling stem diameters were converted to basal area to express mean daily sapling growth rates per plant in mm2day–1, or integrated annual sapling growth in mm2year–1.
Statistical analyses
The unreplicated nature of the TDE is not ideal, but the result-ing pseudoreplication is recognized as a reasonable approach when such costly experimental field designs are undertaken (Eberhardt and Thomas 1991). Nevertheless, dealing with the issue of pseudoreplication in our sampling design is critical (Hurlbert 1984). Eberhardt and Thomas (1991) recommended that unreplicated experiments be supported by adequate sam-pling of site environmental parameters (including climatic conditions), comparable control areas and pretreatment sam-pling. Hanson et al. (1998) showed that the individual 8×8 m
resolution soil water measurements across the TDE plots were not correlated with each other and could, therefore, be treated as independent measurements. Because this was true, we treated individual, spatially separated plants as being inde-pendent with respect to soil water conditions. Recognizing that extensive horizontal rooting of large trees would impact this assumption, trees in buffer zones were not used in our analyses. With these considerations in mind, analyses of covariance were used to test for wet, control, and dry plot ef-fects on growth of large trees and saplings. Each covariate analysis of variance was executed as a two-way design with main effect and interaction tests for plot and vertical slope po-sition. However, slope was left out of the analysis for species that did not occupy the full range of slope positions (e.g., L.tulipiferaoccurred only on the lower third of the plot). Re-peated measures analysis of variance was also conducted to determine if the treatment effects were consistent with time.
To account for bias in growth as a result of pretreatment plant size, initial basal area of individual saplings was used as a covariate in analysis of variance tests of treatment effects. Similarly, for the large trees, pretreatment annual growth rates (AcerandQuercus) or their initial basal area (Liriodendron andNyssa) were used as covariates. All covariates were highly significant and, therefore, appropriate for their intended pur-pose. Chi-square analyses were used to test for treatment ef-fects on sapling mortality rates. Nonlinear regression was used to evaluate relationships between growth rate, phenology and soil water potential using a modified form of the crop develop-ment equation of Yin et al. (1995). All statistical analyses were conducted with SPSS 6.1 for the Macintosh (SPSS, Inc., Chi-cago, IL).
Results
1993–1999 Climate
Weather and soil water data showed substantial interannual variation from 1993 through 1999 (Table 2). Lower than aver-age annual precipitation was measured in 1993 (–16%), 1995 (–16%), 1998 (–9%), and 1999 (–15%), and above average precipitation was observed in 1994 (+24%), 1996 (+21%) and 1997 (+8%). Growing season precipitation was near normal in 1994 and 1999, but it was 26 to 38% less than normal during the drought years of 1993, 1995 and 1998. Growing season precipitation was 47 and 22% higher than normal in 1996 and 1997, respectively (Table 2). Mean annual air temperature and annual incident solar radiation were not as variable as annual precipitation (Table 2), but mean annual air temperatures in 1998 and 1999 were higher than in previous years.
Cumulative annual incident solar radiation at the site was similar across years. Cumulative growing season radiation in-puts ranged from 2643 to 3155 MJ m–2from 1993 through 1999, but showed no trends with annual or growing season precipitation, even though dry years (1993, 1995, 1998, 1999) tended to have greater growing season radiation inputs than wet years.
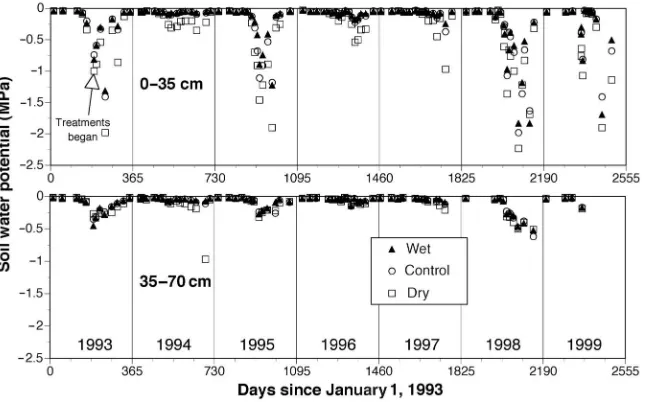
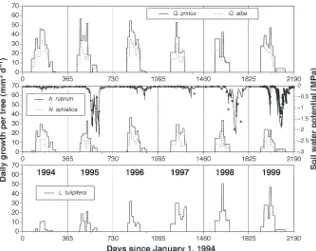
Minimum daily soil water potentials showed that significant drought occurred in 1993, 1995, 1998, and 1999 (sustained values below –0.7 MPa in Figure 1). However, the annual wa-ter stress integrals (Table 2) demonstrated that the 1993 drought (–72 MPa day) was not sustained as long as the droughts in 1995, 1998, and 1999 (–110, –93 and –98 MPa day, respectively). In the wet growing seasons of 1994, 1996, and 1997, control soil water potentials never fell below –0.7 MPa, but the dry plot soil water potentials reached sub-stantially lower values (Figure 1, Table 2). Although control precipitation inputs during the dry 1995 growing season were comparable with dry plot precipitation inputs in 1994 (394 versus 379 mm), the minimum control soil water poten-tial differed from the minimum dry plot soil water potenpoten-tial (–2.3 versus –1.1 MPa, respectively) because of the timing of rainfall events.
Calculated water stress integrals for the January through July periods versus the August through December periods fur-ther demonstrated year-to-year differences in the characteris-tics of the droughts (Table 2). The droughts of 1995, 1998 and 1999 were most severe in the second half of the growing sea-son (i.e., exhibited the most negative soil water potentials), whereas the drought of 1993 was most severe during the ear-lier half of the growing season.
variable annual and growing season precipitation (Table 2) has allowed us to test not only the impact of a constant ± 33% alteration of throughfall resulting from all incoming rainfall events, but also to determine the influence of sustained droughts as well.
Basal area growth of saplings
Over the 6-year period, mean annual basal area increment of A.rubrumsaplings was significantly higher in the wet plot compared with the control and dry plots (Table 3). Mean an-nual basal area increment ofC.floridasaplings was signifi-cantly higher in the wet plot and signifisignifi-cantly lower in the dry plot compared with the control plot. The highest annual growth forA.rubrumwas observed in 1996 and 1997, but the highest growth rates forC.floridawere measured in 1994,
which was the year of lowest growth forA.rubrum. The low-est growth rates forC.floridawere measured in 1997, which was one of the wet growing seasons.
Stem growth of A. rubrum and C. florida saplings was largely limited to the first half of the growing seasons in 1994, 1995 and 1996 (Figure 2). Thus, most stem diameter growth of the saplings occurred before the development of late-season water deficits (e.g., 1995).
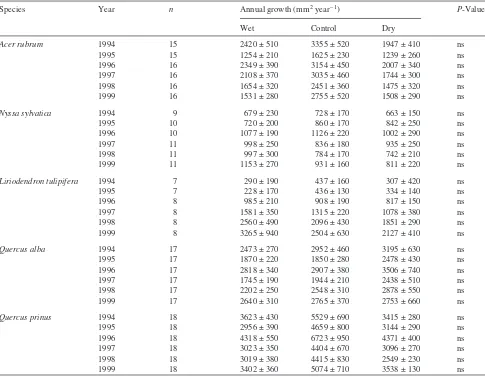
Basal area growth of large trees
In contrast to the growth responses of saplings, growth of large trees was unaffected by treatment (Table 4). Analyses of treat-ment responses for small trees (< 0.1 m DBH) versus large trees (> 0.1 m DBH) was conducted to determine if tree size had an impact on tree sensitivity, but no significant differences
Table 3. Mean annual sapling growth by species and treatment (± SE) for the 1994 through 1999 growing seasons. The mean number of trees per treatment block (n) is also shown for each year of the study. TheP-values provided are for covariate analyses of variance of treatment main effects within a year. Abbreviation: ns = non-significant.
Species Year n Annual growth (mm2year–1) P-Value
Wet Control Dry
Acer rubrum 1994 42 19 ± 3 11 ± 2 9 ± 2 ns
1995 61 26 ± 4 13 ± 2 17 ± 2 0.01
1996 60 50 ± 6 28 ± 5 31 ± 6 0.01
1997 55 52 ± 9 28 ± 4 26 ± 4 0.03
1998 55 34 ± 5 24 ± 5 15 ± 3 ns
1999 48 22 ± 7 10 ± 4 7 ± 5 ns
Mean 33 18 18 0.00
Cornus florida 1994 45 58 ± 12 51 ± 7 25 ± 5 ns
1995 60 50 ± 10 38 ± 6 21 ± 4 0.00
1996 57 48 ± 10 31 ± 4 40 ± 6 0.01
1997 51 12 ± 4 12 ± 4 15 ± 4 ns
1998 45 25 ± 9 18 ± 5 16 ± 4 ns
1999 29 28 ± 13 19 ± 7 9 ± 9 ns
Mean 33 25 18 0.01
Figure 2. Daily growth rates averaged over 14–20 day periods forA.rubrum andC.floridasaplings on the wet, con-trol and dry plots throughout 1994, 1995 and 1996. Mean, daily, control plot soil water potentials between 0 and 0.35-m are shown to indicate peri-ods of water stress in each year (open symbols are the means of 100 observa-tions and the solid line is a model pre-diction for unmeasured periods).
Table 4. Annual mean tree (stems > 0.1 m DBH) basal area growth by species and TDE treatment (± SE) for the 1994 through 1999 growing sea-sons. The mean number of trees per treatment block (n) is also shown for each year of the study. TheP-values provided are for covariate analysis of variance based on pretreatment annual basal area growth. Abbreviation: ns = non-significant.
Species Year n Annual growth (mm2year–1) P-Value
Wet Control Dry
Acer rubrum 1994 15 2420 ± 510 3355 ± 520 1947 ± 410 ns
1995 15 1254 ± 210 1625 ± 230 1239 ± 260 ns
1996 16 2349 ± 390 3154 ± 450 2007 ± 340 ns
1997 16 2108 ± 370 3035 ± 460 1744 ± 300 ns
1998 16 1654 ± 320 2451 ± 360 1475 ± 320 ns
1999 16 1531 ± 280 2755 ± 520 1508 ± 290 ns
Nyssa sylvatica 1994 9 679 ± 230 728 ± 170 663 ± 150 ns
1995 10 720 ± 200 860 ± 170 842 ± 250 ns
1996 10 1077 ± 190 1126 ± 220 1002 ± 290 ns
1997 11 998 ± 250 836 ± 180 935 ± 250 ns
1998 11 997 ± 300 784 ± 170 742 ± 210 ns
1999 11 1153 ± 270 931 ± 160 811 ± 220 ns
Liriodendron tulipifera 1994 7 290 ± 190 437 ± 160 307 ± 420 ns
1995 7 228 ± 170 436 ± 130 334 ± 140 ns
1996 8 985 ± 210 908 ± 190 817 ± 150 ns
1997 8 1581 ± 350 1315 ± 220 1078 ± 380 ns
1998 8 2560 ± 490 2096 ± 430 1851 ± 290 ns
1999 8 3265 ± 940 2504 ± 630 2127 ± 410 ns
Quercus alba 1994 17 2473 ± 270 2952 ± 460 3195 ± 630 ns
1995 17 1870 ± 220 1850 ± 280 2478 ± 430 ns
1996 17 2818 ± 340 2907 ± 380 3506 ± 740 ns
1997 17 1745 ± 190 1944 ± 210 2438 ± 510 ns
1998 17 2202 ± 250 2548 ± 310 2878 ± 550 ns
1999 17 2640 ± 310 2765 ± 370 2753 ± 660 ns
Quercus prinus 1994 18 3623 ± 430 5529 ± 690 3415 ± 280 ns
1995 18 2956 ± 390 4659 ± 800 3144 ± 290 ns
1996 18 4318 ± 550 6723 ± 950 4371 ± 400 ns
1997 18 3023 ± 350 4404 ± 670 3096 ± 270 ns
1998 18 3019 ± 380 4415 ± 830 2549 ± 230 ns
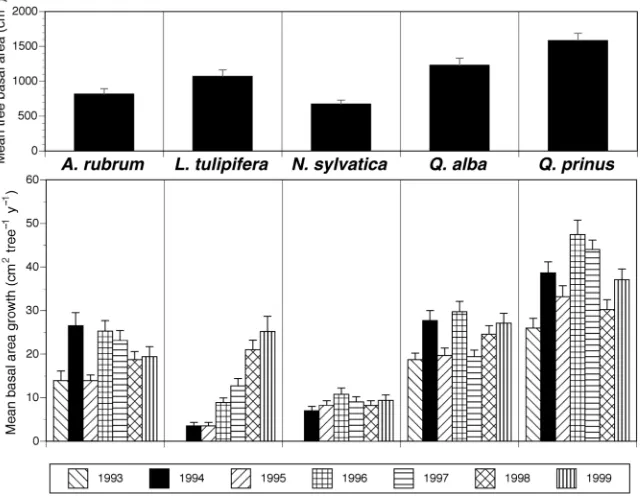
were found (data not shown). Although insensitive to the im-posed treatments, tree growth showed significant interannual variation (Figures 3 and 4).Acer rubrum,Q.alba, andQ. prin-usall exhibited their highest growth rates during the 1994 and 1996 wet seasons and low growth rates during droughts in 1995 and 1998. Low and high growth rates in 1997 and 1999, respectively, were unrelated to measured soil water status.
Growth rates of individual species varied widely in propor-tion to that species’ mean basal area (Figures 3 and 4). Quercus prinushad the highest annual growth rate among spe-cies, butQ.albaandA.rubrumwere nearly as productive. An-nual growth ofN.sylvaticawas less than half that ofQuercus andAcer.For all species, exceptLiriodendron, maximum nual growth occurred during 1994 or 1996 and minimum an-nual growth occurred during 1993 or 1995 (Figure 3). In the drought years of 1993 and 1995, annual basal area growth was reduced with respect to growth in the wet growing seasons of 1994 and 1996, but severe late-season droughts in 1998 and 1999 had little impact on current basal area growth. Lirioden-dron tulipifera showed increasing growth rates from 1994 through 1999.
Mean daily growth rates of all species showed a similar pat-tern for each year of the study (Figure 4). Maximum growth rates occurred before the end of June in each year (i.e., before Day 180), and all basal area growth was completed before late September (i.e., Day 270) in both wet and dry years.
Growth rate and soil water potential
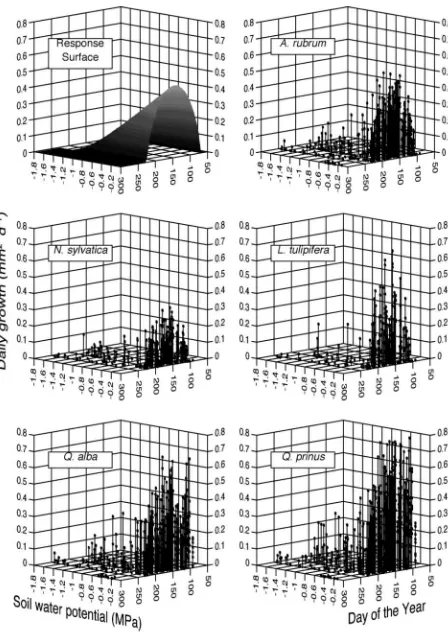
Because of the absence of drought conditions during the 1994, 1996 and 1997 growing seasons (Figure 1), growth rates dur-ing those years could be interpreted as the seasonal pattern of growth to be expected in the absence of water stress. With this growth pattern as a reference, the influence of growth
reduc-tions during periods with water stress (i.e., late-season growth in 1995, 1998, and 1999) was quantified. Figure 5 shows the relationship between mean basal area growth, phenology (i.e., day of the year), and soil water potential for the five large tree species. Equation 1 describes a response surface indicated by these data:
BA DOY DOY
WP
growth=exp( )( − ) ( − ) (
c S a E b
min−SWP WPmin) ,
(1)
where BAgrowthis mean daily basal area increment of an indi-vidual tree, DOY is day of the year, SWP is observed soil wa-ter potential in the surface horizon (0–0.35 m depth),a,bandc are model constants that control the shape and magnitude of the growth rate under no water stress,Sis the day on which measurable stem growth begins,Eis the day when growth ceases and WPminis the soil water potential needed to preclude growth. Table 5 summarizes the regression estimates of these constants for each species and the mean of all five species av-eraged across all years of the study. Although there was sub-stantial variation in the magnitude of growth rates for each species, the overall pattern of the response surface was consis-tent across species.
Sapling and tree mortality
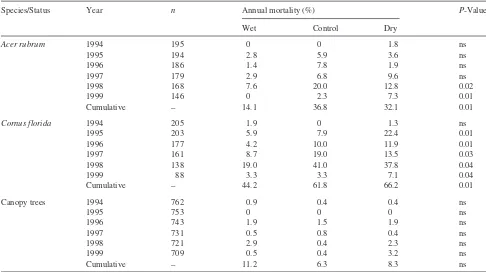
By the end of the 1999 growing season, mortality ofC.florida saplings was more than double that ofA.rubrumsaplings, but both species showed a similar long-term trend (Table 6). Greatest annual mortality of bothA.rubrumandC.floridawas observed in 1998. Significant treatment effects on annual mor-tality ofA.rubrumwere found only in 1998 and 1999, but
C.floridamortality showed significant treatment effects in all years except 1994. At the end of 1999, cumulative mortality on the wet treatment plot was significantly lower than cumula-tive mortality on the control and dry plots for both species. In the first 3 years of the study, the pattern of mortality differed with respect to treatments. Following the drought of 1995, mortality ofC.floridawas significantly enhanced by the dry treatment, whereas there was little mortality inA.rubrumin any of the plots (Table 6).
Over the period 1993 through 1999, 63 out of 762 trees with stems greater than 0.1 m DBH died for a mean annual mortal-ity rate of approximately 1.2% per year. Sixteen trees died from known causes unrelated to the imposed treatments (i.e., wind throw or lightning). For the remaining trees, annual mor-tality rates showed little change by TDE treatment or year (Ta-ble 6), reaching cumulative mortality of 11.2, 6.3 and 8.3% in the wet, control and dry plots, respectively, at the end of 1999. Differences in mortality rate among treatments were not sig-nificant.
Discussion Saplings
Observed basal area growth rates during 6 years of throughfall manipulation support our hypothesis that small-stature vege-tation is more sensitive to reductions in precipivege-tation and soil water content than large trees. Although A. rubrum and C.florida saplings had comparable aboveground stem and branch structure and foliar physiology (Gebre et al. 1998, Tschaplinski et al. 1998),C.floridahad a higher mortality rate thanA.rubrumin most years (Table 6). Differences in rooting depth are one possible cause for this difference. Cornus
floridahas a shallow root system (Hinckley et al. 1979, 1981, Bahari et al. 1985) and, therefore, may be sensitive to drought leading to high mortality rates. Alternatively, becauseCornus anthracnose symptoms (Hiers and Evans 1997) were ubiqui-tous across the plots (data not shown), it is possible that Cornusmortality resulted from the fungal pathogenDiscula destructiva(Redlin.), with possible interactions with drought. Reduced mortality ofC.floridaandA.rubrumsaplings on the wet plot indicate that a wetter future climate would sustain es-tablishment and survival of trees in the understory, but a drier future climate might reduce understory success of susceptible species.
Large trees
The treatments did not affect basal area growth of large trees through six growing seasons, but growth of large trees was two to three times greater in wet years than in dry years (Ta-ble 4). Although it is commonly assumed that large trees have many deep roots that provide protection against periodic droughts (Kozlowski 1982, Abrams 1990), reductions in growth of large trees during drought periods in 1993, 1995, 1998 and 1999 were apparently driven by reduced soil water potentials in the upper 0.35 m of the soil horizon (Figure 1). Growth reductions associated with shallow soil drying indi-cate that the number or conductivity, or both, of deep roots may be insufficient to support growth.
Quercustrees (~9 to 10 m) may have contributed to the low growth rates (L.tulipiferais commonly considered the fastest growing tree in the southeastern USA).
Previous publications have documented that TDE treat-ments affect forest physiological processes (Gebre et al. 1998, Tschaplinski et al. 1998, Wullschleger et al. 1998); however, we found no strong relationship between variation in growing
season precipitation and annual basal area growth of large trees. This discrepancy can be explained on the basis of the rel-ative timing of basal area growth and the drought periods. In years without soil water deficits (i.e., 1994, 1996, and 1997) basal area growth of saplings and trees was complete by late July (Figure 4) even though canopy foliage remained physio-logically active throughout the late summer (Wilson et al. 2000a). Thus, basal area growth (a spring phenomenon) was nearly complete before the onset of late-summer droughts. Similar patterns were reported by Buell et al. (1961) for east-ern hardwoods, and by Bréda and Granier (1996) who con-cluded that early wood development inQ.petraeaL. exLiebl. was independent of soil water deficits. Phipps (1961) con-cluded that soil water content was never low enough in Ohio deciduous forests to limit the development of early sapwood. Conversely, severe spring droughts (if they occurred) might represent a significant water stress event with direct impact on current-year basal area growth. In support of this conclusion, Robbins (1921) reported that the amount of March–June pre-cipitation was positively correlated withQuercus growth in Missouri. Explanations for mid-season growth reductions of eastern hardwood trees are uncertain, but reduced day lengths, internal growth regulator changes, and limited nutrient supply rates may all play a role. Reductions in late-season carbohy-drate supplies are not the cause of the late-season slow down of diameter growth on the TDE site, because net carbon gain remained high late in the growing seasons of the wet years 1994, 1996, and 1997 (Wilson et al. 2000band authors' unpub-lished data).
Other studies of hardwood tree growth responses to drought
Early studies dealing with tree growth responses to soil water deficits relied on interannual differences in rainfall patterns. Hursh and Haasis (1931) reported defoliation and mortality of large trees in the southern Appalachians during the 1925 drought when May–August precipitation was 32% below the long-term mean, and soil water contents (~0.3-m depth) de-clined to 8 to 11% (v/v). They also reported that foliar brown-ing (i.e., wiltbrown-ing) was severe forCornus florida,Oxydendrum arboreumandQuercus prinus, whereas species ofFraxinus, Robinia,andCaryashowed less injury. Small (1961) reported
Table 5. Species-specific regression coefficients for the relationship between daily basal area tree growth, day of the year, and soil water potential in the 0–0.35 m portion of the soil profile for five tree species and their mean. Equation 1 (see text) has six constants: three control the shape and magnitude of the growth rate under no water stress (a,b,c), and the other three are the day of growth initiation (S), day on which growth stops (E), and the soil water potential at which growth ceases (WPmin).
Species Regression coefficients R2
a b c S(day) E(day) WPmin(MPa)
Acer rubrum 1.31 ± 0.46 2.44 ± 1.36 –17.9 ± 8.8 98 ± 5 257 ± 30 –1.5 ± 0.2 0.46
Liriodenderon tulipifera 1.09 ± 0.51 1.21 ± 0.56 –11.0 ± 4.5 98 ± 8 226 ± 10 –1.2 ± 0.2 0.29
Nyssa sylvatica 0.72 ± 0.15 0.88 ± 0.19 –8.7 ± 1.4 101 ± 1 225 ± 3 –2.0 ± 0.5 0.28
Quercus alba 0.70 ± 0.4 0.72 ± 0.2 –7.0 ± 2.7 70 ± 21 226 ± 3 –1.5 ± 0.2 0.33
Quercus prinus 0.16 ± 0.1 0.22 ± 0.1 –3.0 ± 0.6 86 ± 0.3 217 ± 0.3 –1.6 ± 0.1 0.15
All species 1.55 ± 0.6 1.35 ± 0.4 –14.2 ± 4.7 65 ± 16 233 ± 7 –1.6 ± 0.1 0.21
foliar wilting and subsequent mortality for several hardwoods growing on shallow soils of the New Jersey Piedmont in 1957, when summer rainfall (May–August) was only 52% of the long-term mean. Buell et al. (1961) contrasted tree growth of several tree species growing on shallow soils in a normal (1956) versus a dry year (1957) with 48% less rainfall, and measured dramatic midsummer stem shrinkage during drought. However, the shrinkage was reversible and total growth was similar in the wet versus dry years because growth occurred before the late-season droughts. Comparison of these results with our study must be made with caution because: (1) Hursch and Hassis (1931) worked on forest plots that were “conspicuously affected by drought;” and (2) the soils in these other studies were characterized as shallow, whereas the TDE site has very deep soils.
Orwig and Abrams (1997) analyzed annual radial growth responses from tree rings ofQuercus alba,Q.velutinaLam., Liriodendron tulipifera, Carya glabra ((Mill.) Sweet) and Nyssa sylvaticain Virginia over the 1900–1993 period to de-termine how each species responded to severe droughts re-corded in 1930, 1942, 1954 and 1966. Those years had growing season precipitation between 54 and 82% of the 60-year mean (557 mm), which is similar to the manipulated rates of precipitation in the TDE study. With the exception of Q.alba, Orwig and Abrams (1997) found no significant differ-ence in the growth of these species for any of the targeted drought years, but they concluded that growth in years follow-ing severe drought episodes was reduced relative to the
long-term trend. Based on tree ring analysis, Jenkins and Pallardy (1995) found a significant correlation between an-nual basal area increment ofQuercus coccineaMuenchh.and Q.velutinain the Missouri Ozarks and measures of drought severity. This finding contrasts with our results; however, their observations were made in a region of substantially lower precipitation, and it is reasonable to anticipate stronger rela-tionships between growth and soil water deficits in areas where rainfall is more limiting. During an unusually severe drought in central Missouri in 1976 (34% of normal rainfall), when mean soil water potential in the upper 0.45 m of soil de-clined to –2.6 MPa, Hinckley et al. (1979) reported 19% re-ductions in stem circumference growth of dominant white oaks. Hanson and Weltzin (2000) pointed out that forests near the prairie–forest border (i.e., Missouri) may be at a higher risk of drought impacts than forests further east where rainfall is more abundant.
Tree ring studies of hardwoods that correlate annual growth increment with climate also support the idea that spring drought conditions produce larger growth effects than late-season droughts of similar magnitude (Fritts 1960, Buell et al. 1961, Phipps 1961, Fritts 1962, Penninckx et al. 1999). Borchert (1998) described a similar phenomenon for tropical rain forests. Our observations of growth of large trees indicate that differences in seasonal timing of rainfall will have a greater impact on basal area growth than percentage changes in rainfall applied to all events throughout a year.
Pedersen (1998) hypothesized that severe drought years Table 6. Annual mortality (%) by year and treatment and cumulative mortality through 1999 by treatment for understoryA.rubrumandC.florida saplings and canopy trees (all species). The number of measured individuals living in all treatments at the beginning of each year (n) is also pro-vided. TheP-value for a Chi square test on the mortality data is provided.P-Values < 0.05 were considered significant treatment responses.
Species/Status Year n Annual mortality (%) P-Value
Wet Control Dry
Acer rubrum 1994 195 0 0 1.8 ns
1995 194 2.8 5.9 3.6 ns
1996 186 1.4 7.8 1.9 ns
1997 179 2.9 6.8 9.6 ns
1998 168 7.6 20.0 12.8 0.02
1999 146 0 2.3 7.3 0.01
Cumulative – 14.1 36.8 32.1 0.01
Cornus florida 1994 205 1.9 0 1.3 ns
1995 203 5.9 7.9 22.4 0.01
1996 177 4.2 10.0 11.9 0.01
1997 161 8.7 19.0 13.5 0.03
1998 138 19.0 41.0 37.8 0.04
1999 88 3.3 3.3 7.1 0.04
Cumulative – 44.2 61.8 66.2 0.01
Canopy trees 1994 762 0.9 0.4 0.4 ns
1995 753 0 0 0 ns
1996 743 1.9 1.5 1.9 ns
1997 731 0.5 0.8 0.4 ns
1998 721 2.9 0.4 2.3 ns
1999 709 0.5 0.4 3.2 ns
may represent “inciting stresses” that lead to eventual mortal-ity of large trees; however, analysis of mortalmortal-ity of mid-west-ern overstory oaks in Arkansas, Illinois, Indiana and southmid-west-ern Ohio did not show increased mortality of overstory oaks in the first year following an inciting stress (Pedersen 1999). Mortal-ity of large trees on the TDE was rather conservative at about 1% per year, with little evidence of accelerated mortality fol-lowing the severe droughts of 1995 and 1998. It is possible that inciting stresses may take some years to be expressed in large trees.
Response functions
Although annual basal area growth of large trees was insensi-tive to late season drought, early season daily growth rates were related to soil water potential (Figure 5).Quercusspecies initiated basal area growth several weeks earlier than the other species, andAcersustained growth longer than the four other study species. The soil water potential required to inhibit growth completely ranged from –1.2 MPa forLiriodendronto –2.0 MPa forNyssa. The WPminforAcerandQuercuswas in-termediate at –1.5 MPa, which is the traditionally accepted value for the wilting point of vegetation (Brady 1974). The lin-ear decline in growth with decreasing soil water potential (Fig-ure 5) was consistent with the annual basal area growth response to mean growing season soil water potential inPinus strobus L. (Vose and Swank 1994, McNulty and Swank 1995).
The response surfaces (Figure 5) and their coefficients (Ta-ble 5) may be applied to growth models, but only with caution. The soil water potential values used in the regressions in Ta-ble 5 were for the upper 0.35 m of the soil. If other studies use soil water measurements at other depths to represent different rooting zones, the relationships will most likely be different. Relationships might also change with soil nutrient availability and stand age. Notwithstanding these cautions, model esti-mates of the soil water potential leading to total basal area growth inhibition (WPminfrom Table 5) indicate that, of the species investigated,L.tulipiferais the most sensitive to soil water stress with a WPmin of –1.2 MPa. Limited data for N.sylvaticaindicate that it might be the least sensitive to soil drying. The WPminvalues forA.rubrumand the twoQuercus species were all centered on the traditionally accepted perma-nent wilting point of –1.5 MPa. The relative sensitivity of L.tulipiferagrowth to soil water potential is consistent with interspecies observations of foliar conductance sensitivity to soil water potential (Hinckley et al. 1979, Hinckley et al. 1981, Bahari et al. 1985). It also agrees with interspecific rankings of drought sensitivity based on saturated foliar osmotic potential (Tschaplinski et al. 1998).
Acknowledgments
We thank the following students and coworkers for participating in the long-term collection of data for this paper: James E. Arnett III, Stephanie Bohlman, Mogan Castner, Kristien Harter, Sabina Madsen, Tracy Misek, Mark Scannell, James B. Stringfellow, Todd Tabberer, and Karen Voiles. We also thank Robert Augé, Nelson Edwards, Hal Fritts, Jake Weltzin, Darrell West and Stan Wullschleger for their
re-views of early versions of this paper. This research was sponsored by the Program for Ecosystem Research, Environmental Sciences Divi-sion, Office of Biological and Environmental Research, U.S. Depart-ment of Energy under contract DE-AC05-00OR22725 with University of Tennessee-Battelle, LLC. Research was conducted on the Oak Ridge National Environmental Research Park. Publication No. 5026, Environmental Sciences Division, Oak Ridge National Laboratory.
References
Abrams, M.D. 1990. Adaptations and responses to drought in Quercusspecies of North America. Tree Physiol. 7:227–238. Bahari, Z.A., S.G. Pallardy and W.C. Parker. 1985. Photosynthesis,
water relations, and drought adaptation in six woody species of oak–hickory forests in central Missouri. For. Sci. 31:557–569. Borchert, R. 1998. Responses of tropical trees to rainfall seasonality
and its long-term changes. Clim. Change 39:381–393.
Brady, N.C. 1974. The nature and properties of soils. MacMillan Pub-lishing Company, New York, 639 p.
Bréda, N. and A. Granier. 1996. Intra-and interannual variations of transpiration, leaf area index and radial growth of a sessile oak stand (Quercus petraea). Ann. Sci. For. 53:521–536.
Buell, M.F., H.F. Buell, J.A. Small and C.D. Monk. 1961. Drought ef-fect on radial growth of trees in the William L. Hutcheson Memo-rial Forest. Bull. Torrey Bot. Club 88:176–180.
Burns, D.P. and L.P. Gibson. 1968. The leaf-mining weevil of yel-low-poplar. Can. Entomol. 100:421–429.
Cook, E.R., M.A. Kablack and G.C. Jacoby. 1988. The 1986 drought in the southeastern United States: How rare an event was it? J. Geophys. Res. 93:14,257–14,260.
Cooter, E.J., B.K. Eder, S.K. LeDuc and L. Truppi. 1993. General cir-culation model output for forest climate change research and appli-cations. USDA Forest Service, Southeastern Forest Experiment Station, Asheville, NC, Gen. Tech. Rep. SE-85, 38 p.
Davis, M.B. 1989. Lags in vegetation response to greenhouse warm-ing. Clim. Change 15:75–82.
Drungil, C.E.C., T.J. Gish and K. Abt. 1987. Soil moisture determina-tion in gravelly soils with time domain reflectometry. Trans. ASAE 32:177–180.
Eberhardt, L.L. and J.M. Thomas. 1991. Designing environmental field studies. Ecol. Monogr. 61:53–73.
Fischlin, A., H. Bugmann and D. Gyalistras. 1995. Sensitivity of a forest ecosystem model to climate parametrization schemes. Envi-ron. Pollut. 87:267–282.
Fritts, H.C. 1960. Multiple regression analysis of radial growth in in-dividual trees. For. Sci. 6:334–349.
Fritts, H.C. 1962. The relation of growth ring widths in american beech and white oak to variations in climate. Tree-Ring Bull. 25:2–10.
Gebre, G.M., T.J. Tschaplinski and T.L. Shirshac. 1998. Water rela-tions of several hardwood species in response to throughfall ma-nipulation in an upland oak forest during a wet year. Tree Physiol. 18:299–305.
Gregory, J.M., J.F.B. Mitchell and A.J. Brady. 1997. Summer drought in northern midlatitudes in a time-dependent CO2climate
experiment. J. Climate 10:662–686.
Haasis, R.W. 1934. Diametrical changes in tree trunks. Carnegie In-stitution of Washington Publ. No. 450, 103 p.
A. Jenkins, R.C. Ferrier and C. Kirby. Ecosystem Research Report No. 20, Commission of the European Communities, pp 307–313. Hanson, P.J., D.E. Todd, M.A. Huston, J.D. Joslin, J. Croker and R.M. Augé. 1998. Description and field performance of the Walker Branch Throughfall Displacement Experiment: 1993–1996. Oak Ridge National Laboratory, Oak Ridge, TN, ORNL/TM-13586, 49 p.
Hanson, P.J. and J. F. Weltzin. 2000. Drought disturbance from cli-mate change: response of United States forests. Sci. Total Environ. 262:205–220.
Hiers, J.K. and J.P. Evans. 1997. Effects of anthracnose on dogwood mortality and forest composition of the Cumberland Plateau (USA). Conserv. Biol. 6:1430–1435.
Hinckley, T.M., P.M. Dougherty, J.P. Lassoie, J.E. Roberts and R.O. Teskey. 1979. A severe drought: Impact on tree growth, phenol-ogy, net photosynthetic rate and water relations. Am. Mid. Nat. 102:307–316.
Hinckley, T.M., R.O. Teskey, F. Duhme and H. Richter. 1981. Tem-perate hardwood forests.InWater Deficits and Plant Growth, Vol. VI. Academic Press, New York, pp 153–208.
Huff, D.D., R.J. Luxmoore, J.B. Mankin and C.L. Begovich. 1977. TEHM: a terrestrial ecosystem hydrology model. Oak Ridge Na-tional Laboratory, InternaNa-tional Biological Program Technical Publication, EDFB/IBP-76/8, ORNL/NSF/EATC-27, 152 p. Hurlbert, S.H. 1984. Pseudoreplication and the design of ecological
field experiments. Ecol. Monogr. 54:187–211.
Hursh, C.R. and F.W. Haasis. 1931. Effects of 1925 summer drought on southern appalachian hardwoods. Ecology 12:380–386. Jenkins, M.A. and S.G. Pallardy. 1995. The influence of drought on
red oak group species growth and mortality in the Missouri Ozarks. Can. J. For. Res. 25:1119–1127.
Johnson, D.W. and R.I. VanHook. 1989. Analysis of biogeochemical cycling processes in Walker Branch Watershed. Springer-Verlag, New York, 401 p.
Jones, E.A., D.D. Reed, G.D. Mroz, H.O. Liechty and P.J. Cattelino. 1993. Climate stress as a precursor to forest decline: paper birch in northern Michigan, 1985–1990. Can. J. For. Res. 23:229–233. Joslin, J. D. and M. H. Wolfe. 1998. Impacts of long-term water input
manipulations on fine root production and mortality in mature hardwood forests. Plant Soil 204:165–174.
Kattenberg, A., F. Giorgi, H. Grassl, G.A. Meehl, J.F.B. Mitchell, R.J. Stouffer, T. Tokioka, A.J. Weaver and T.M.L. Wigley. 1996. Climate models—Projections of future climate.InClimate Change 1995, The Science of Climate Change. Eds. J.T. Houghton et al. Cambridge Univ. Press, New York, pp 283–357.
Keeland, B.D. and R.R. Sharitz. 1993. Accuracy of tree growth mea-surements using dendrometer bands. Can. J. For. Res. 23: 2454–2457.
Kirschbaum, M.U.F. and A. Fischlin. 1996. Climate change impacts on forests.InClimate Change 1995 Impacts, Adaptations and Miti-gation of Climate Change: Scientific–Technical Analysis. Eds. R.T. Watson, M.C. Zinyowera and R.H. Moss. Cambridge Univ. Press, New York, pp 95–129.
Kramer, P.J. and T.T. Kozlowski. 1979. Physiology of woody plants. Academic Press, New York, 811 p.
Kozlowski, T.T. 1971. Measurement of cambial growth.InGrowth and Development of Trees. Academic Press, New York, pp 168–195.
Kozlowski, T.T. 1982. Water supply and tree growth. Part 1 Water deficits. For. Abstr. 43:57–95.
Leverenz, J.W. and D.J. Lev. 1987. Effects of carbon dioxide induced climate changes on the natural ranges of six major commercial tree species in the western United States.InThe Greenhouse Effect,
Climate Change and U.S. Forests. Eds. W.E. Shands and J.S. Hoffman. The Conservation Foundation, Washington, D.C., pp 123–155.
Loehle, C. and D. LeBlanc. 1996. Model-based assessments of cli-mate change effects on forests: a critical review. Ecol. Model. 90:1–31.
Luxmoore, R.J. 1983. Water budget of an eastern deciduous forest stand. Soil Sci. Soc. Am. J. 47:785–791.
McLaughlin, S.B. and D.J. Downing. 1996. Interactive effects of con-trol ozone and climate measured on growth of mature loblolly pine trees. Can. J. For. Res. 26:670–681.
McNulty, S.G. and W.T. Swank. 1995. Woodδ13
C as a measure of annual basal area growth and soil water stress in aPinus strobus forest. Ecology 76:1581–1586.
Melillo, J.M., T.V. Callaghan, F.I. Woodward, E. Salati and S.K. Sinha. 1990. Effects on ecosystems.InClimate Change. Eds. J.T. Houghton, G. J. Jenkins and J. J. Ephraums. The IPCC Scientific Assessment, Cambridge Univ. Press, New York, pp 282–310. Melillo, J.M., J. Borchers, J. Chaney, et al. 1995.
Vegetation/ecosys-tem modeling and analysis project (VEMAP): Comparing biogeography and biogeochemistry models in a continental-scale study of terrestrial ecosystem responses to climate change and CO2
doubling. Global Biogeochem. Cycles 9:407–437.
Melillo, J.M., I.C. Prentice, G.D. Farquhar, E.-D. Schulze and O.E. Sala. 1996. Terrestrial biotic responses to environmental change and feedbacks to climate.InClimate Change 1995, The Science of Climate Change. Eds. J.T. Houghton et al. Cambridge Univ. Press, New York, pp 445–481.
Mohnen, V.A. and W.-C. Wang. 1992. An overview of global warm-ing. Environ. Tech. Chem. 11:1051–1059.
Mooney, H. 1991. Biological response to climate change: an agenda for research. Ecol. Appl. 1:112–117.
Myers, B.J. 1988. Water stress integral—a link between short-term stress and long-term growth. Tree Physiol. 4:315–323.
Neilson, R.P., G.A. King, R.L. DeVelice, J. Lenihan, D. Marks, J. Dolph, B. Campbell and G. Glick. 1989. Sensitivity of ecological landscapes to global climatic change. U.S. Environmental Protec-tion Agency, Environ. Res. Lab., EPA-600-3-89-073, NTIS-PB-90-120-072-AS, Washington, DC, 103 p.
Orwig, D.A. and M.D. Abrams. 1997. Variation in radial growth re-sponses to drought among species, site, and canopy strata. Trees 11:474–484.
Overpeck, J.T., P.J. Bartlein, T. Webb III. 1991. Potential magnitude of future vegetation change in eastern North America: comparisons with the past. Science 254:692–695.
Pastor, J. and W.M. Post. 1988. Response of northern forests to CO2-induced climate change. Nature 334:55–58.
Pedersen, B.S. 1998. The role of stress in the mortality of midwestern oaks as indicated by growth prior to death. Ecology 79:79–93. Pedersen, B.S. 1999. The mortality of midwestern overstory oaks as a
bioindicator of environmental stress. Ecol. Appl. 9:1017–1027. Penninckx, V., P. Meerts, J. Herbauts and W. Gruber. 1999. Ring
width and element concentrations in beech (Fagus sylvaticaL.) from a periurban forest in central Belgium. For. Ecol. Manage. 113:23–33.
Phipps, R.L. 1961. Analysis of five years dendrometer data obtained within three deciduous forest communities of Neotoma. Ohio Agric. Exp. Sta., Res. Circular No. 105, 34 p.
Rind, D., C. Rosenzweig, and R. Goldberg. 1992. Modelling the hydrologic cycle in assessments of climate change. Nature 358:119–122.
Robbins, W.J. 1921. Precipitation and the growth of oaks at Colum-bia, Missouri. University of Missouri, College of Agriculture, Agric. Expt. Sta. Res. Bull. 44, 21 p.
Schneider, S.H. 1989. The greenhouse effect: science and policy. Sci-ence 243:771–781.
Small, J.A. 1961. Drought response in William L. Hutcheson Memo-rial Forest, 1957. Bull. Torrey Bot. Club 88:180–183.
Smith, J. B. and D.A. Tirpak. 1990. The potential effects of global cli-mate change on the United States. Hemisphere Publishing Corp., New York, 689 p.
Solomon, A.M. 1986. Transient response of forests to CO2-induced
climate change: simulation modeling experiments in eastern North America. Oecologia 68:567–579.
Topp, G.C. and J.L. Davis. 1985. Measurement of soil water content using time domain reflectometry (TDR): a field evaluation. Soil Sci. Soc. Am. J. 49:19–24.
Tschaplinski, T.J., G.M. Gebre, and T.L. Shirshac. 1998. Osmotic po-tential of several hardwood species as affected by manipulation of throughfall precipitation in an upland oak forest during a dry year. Tree Physiol. 18:291–298.
Vose, J.M. and W.T. Swank. 1994. Effects of long-term drought on the hydrology and growth of a white pine plantation in the southern Appalachians. For. Ecol. Manage. 64:25–39.
Wigley, T.M.L., K.R. Briffa and P.D. Jones. 1984. Predicting plant productivity and water resources. Nature 312:102–103.
Wilson, K.B., D.D. Baldocchi and P.J. Hanson. 2000a. Spatial and temporal variability of photosynthetic parameters and their rela-tionship to leaf nitrogen in a deciduous forest. Tree Physiol. 20:565–578.
Wilson, K.B., D.D. Baldocchi and P.J. Hanson. 2000b. Quantifying stomatal and non-stomatal limitations to carbon assimilation re-sulting from leaf aging and drought in mature deciduous tree spe-cies. Tree Physiol. 20:787–797.
Winget, C.H. and T.T. Kozlowski. 1964. Winter shrinkage of forest trees. J. For. 62:335–337.
Winget, C.H. and T.T. Kozlowski. 1965. Seasonal basal growth area as an expression of competition in northern hardwoods. Ecology 46:786–793.
Woodward, F.I. 1992. Predicting plant responses to global environ-mental change. Tansley Review No. 41. New Phytol. 122: 239–251.
Wullschleger, S.D., P.J. Hanson and T.J. Tschaplinski. 1998. Whole-plant water flux in understory red maple exposed to altered precipitation regimes. Tree Physiol. 18:71–79.