Technical note
A preliminary investigation of the relationships between employee
motivation/vision, service learning, and perceived service quality
Julie M. Hays
a,∗, Arthur V. Hill
baGraduate School of Business, University of St. Thomas, 1000 LaSalle Avenue, Room 343, Minneapolis, MN 55403-2005, USA bOperations and Management Science Department, Curtis L. Carlson School of Management,
University of Minnesota, Minneapolis, MN, USA Received 3 August 1999; accepted 15 September 2000
Abstract
Most experts agree that a learning organization whose employees have a clear vision of the importance of service quality and are motivated to provide that quality will achieve superior service quality. We develop a theoretical framework and conduct a cross-sectional empirical study to investigate the inter-relationships among these constructs. The results indicate that higher levels of both employees’ motivation/vision and organizational learning positively affect perceived service quality. Addi-tionally, employees’ motivation/vision was found to mediate the relationship between organizational learning and perceived service quality. These results highlight the importance of employees’ motivation/vision in both the service process and the learning process. © 2001 Elsevier Science B.V. All rights reserved.
Keywords: Empirical research; Human resources/OM interface; Quality; Service operations
1. Introduction
Many firms have been able to achieve significant competitive advantage by offering superior service quality (Albrecht and Zemke, 1985; Collier, 1994; Lovelock, 1994; Schmenner, 1995; Zeithaml et al., 1990). However, assuring quality in services is, in some ways, a more difficult proposition than assuring quality in manufacturing. Two factors, in particular, contribute to this difficulty. The ‘production process’ of services involves the interaction of employees and customers, making it difficult to insure consistency
∗Corresponding author. Tel.:+1-651-962-4306;
fax:+1-651-962-4710.
E-mail address: [email protected] (J.M. Hays).
and reliability in the service process and resulting ‘product’. Additionally, quality judgments of an intan-gible service are determined by individual customer’s perceptions and expectations, making it difficult to discover and correct service failures. Thus, both the employees and the learning ability of the firm are thought to play a critical role in achieving superior service quality.
Most experts agree that a learning organization whose employees have a clear vision of the impor-tance of service quality to the organization and are motivated to provide that quality will achieve supe-rior service quality. As Albrecht and Zemke (1985) assert, “excellent service companies: have a strong vision,. . . market service internally, measure service and publish results”. In other words, both employee
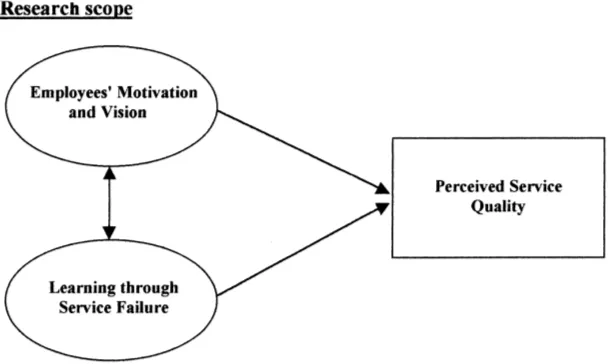
Fig. 1. Research scope.
motivation/vision (EMV) and organizational learn-ing are thought to positively affect perceived service quality (PSQ). However, little research has been con-ducted to determine the magnitude of those effects. Additionally, the nature of the relationship between organizational learning and EMV is not well under-stood. Some experts posit that the motivation and vision of employees is positively affected by orga-nizational learning, while other experts posit that organizational learning is positively affected by the motivation and vision of employees. The lack of theory-driven, systematic, empirical research leaves both academics and practitioners in doubt as to both why and how these constructs affect service quality.
Although, there are many factors that can influ-ence evaluations of service quality (Parasuraman et al., 1988; Zeithaml et al., 1988, 1990, 1993), this research is aimed at investigating the relationships be-tween EMV, learning through service failure (LTSF) and PSQ. The empirical study uses survey data ob-tained from customers, management employees, and front-line employees of a multinational hotel firm to measure the constructs of EMV, LTSF and PSQ as well as to investigate the nature of the inter-relationships among those constructs. Fig. 1 illustrates the scope of this research. We first review the relevant litera-ture and develop the theoretical foundation of this research. We then present the research methodology followed by an analysis of the results obtained from
the empirical study. We conclude the paper with a discussion of the implications of this research.
2. Literature review and theory development
2.1. Perceived service quality
to external customer perceptions. In contrast to Schneider et al. (1996), who focus on a specific strate-gic initiative, this study focuses on cultural aspects of individual outlets. This study represents an important attempt to relate internal drivers of service quality to external customer perceptions of service quality.
Although, this empirical study is focused on in-vestigating the effect of EMV and LTSF on customer perceptions of service quality, it also has strong im-plications for the business performance of the firm. Customer perceptions of superior quality have been found to relate to increased customer satisfaction, which in turn leads to increased customer retention and results in positive economic outcomes for the firm (Anderson et al., 1994; Fornell, 1992; Fornell et al., 1996; Ittner and Larcker, 1996; Johnson and Fornell, 1991). Thus, if EMV and LTSF are positively related to PSQ, they should also positively affect the financial performance of the firm.
2.2. The effect of employee motivation/vision on perceived service quality
The service literature highlights the importance of employees, particularly the motivation and vision of those employees, in successful service firms (Love-lock, 1994). Some experts emphasize the importance of ‘commitment’ (Farber and Wycoff, 1991), others emphasize the importance of ‘culture’ (Collier, 1994), and still others emphasize ‘climate’ (Schneider, 1980). They are all in agreement with Hostage (1975), who states, “service quality begins with people”.
The courtesy, empathy, and responsiveness of service employees all combine to influence quality perceptions of customers (Parasuraman et al., 1988). Czepiel et al. (1985) argue that, “employees not only deliver and create the service, but are actually part of the service in the customers’ view”. Process theo-ries of motivation (Porter and Lawler, 1968; Vroom, 1964) generally predict increased performance with increased motivation. Locke’s goal-setting model (Locke and Latham, 1984), in particular, predicts that both performance and motivation will be increased when individuals have clear goals. Motivated em-ployees who have a clear vision of the importance of service quality to the firm should provide superior service (Bowen and Lawler, 1992). Therefore, we hypothesize:
• H1: Higher levels of EMV will have a positive effect on PSQ.
2.3. The effect of learning through service failure on perceived service quality
The ability to learn efficiently from both employees and customers is thought, by some experts, to be nec-essary for organizational success and survival (Mar-quardt and Reynolds, 1994). Senge (1990) goes so far as to argue, “the rate at which organizations learn may become the only sustainable source of competi-tive advantage”.
Quality control is one of the primary ways in which organizations learn. Indeed, Argyris and Schon (1978) even define organizational learning as “the detection and correction of errors”, which could also be a defi-nition of quality control. In order to survive in an in-creasingly competitive and dynamic service economy, firms need the ability to quickly learn from their fail-ures. Because of the intangible nature of services, cus-tomer complaints are an important means of detect-ing service failures and can provide a significant op-portunity for organizational learning (Fornell, 1976). Although organizations can learn in many ways, this study is focused on LTSF.
Perceptions of service quality are shaped by cus-tomer expectations. Because cuscus-tomer expectations and perceptions change from customer to customer, as well as over time, organizational learning is needed to achieve and maintain superior service quality. We be-lieve that firms with a greater ability to learn from ser-vice failures will offer higher levels of serser-vice quality. Therefore, we hypothesize:
• H2: Higher levels of LTSF will have a positive effect on PSQ.
2.4. The relationship between employee
motivation/vision and learning through service failure
Employee motivation/vision is thought to be an essential ingredient of learning organizations (Mar-quardt and Reynolds, 1994). Senge (1990), who pop-ularized the concept of learning organizations, states:
which people truly want to achieve, the forces in support of the status quo can be overwhelming. Vi-sion establishes an overarching goal. The loftiness of the target compels new ways of thinking and act-ing. A shared vision also provides a rudder to keep the learning process on course when stresses de-velop. . . shared vision fosters risk taking and ex-perimentation.
Thus, service learning could be posited to depend on the motivation and vision of the firm’s employees, where higher levels of motivation and vision positively influence learning.
An opposite perspective is taken by some behavior-ists. Hackman and Oldham (1980) believe that a job’s motivating potential can be enhanced by increasing the level of feedback from job and/or knowledge of results (Oldham, 1996). Control theory (Carver and Scheier, 1981), goal-setting theory (Locke and Latham, 1990), and social cognitive theory (Bandura, 1986) all agree that feedback regulates action by stimulating a re-action to a feedback-standard discrepancy. The the-ories differ in their explanation of people’s reaction to this discrepancy. Control theory is in agreement with Wirtz (1998), who asserts that the negative feed-back employees obtain from service failure may have a demotivating effect, rather than a motivating ef-fect. Goal-setting theory (Locke, 1982) advances the premise that motivation increases with feedback dis-crepancy.
Thus, EMV could be posited to depend on learn-ing, through feedback and knowledge of results, where learning could either positively or negatively influ-ence EMV. Alternately, EMV and LTSF could inde-pendently affect PSQ. In this case, learning would not have an effect on EMV nor would EMV have an ef-fect on learning. They could, however, interact in their effect on PSQ.
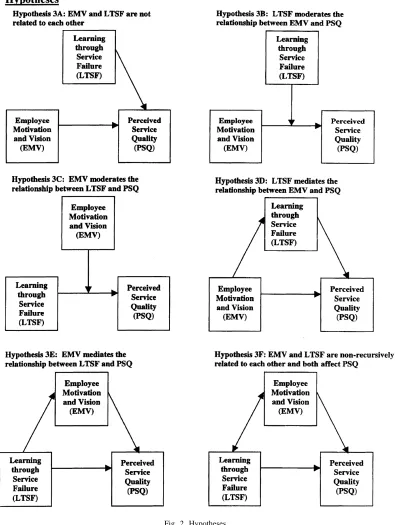
Although, there is theoretical support for the posi-tive effect of EMV and LTSF on PSQ, little empirical evidence exists to support these relationships. Addi-tionally, the nature of the relationship between EMV and LTSF is ambiguous in the literature. This study is aimed at resolving this ambiguity. Assuming that H1 and H2 are supported in this study leads to the follow-ing competfollow-ing hypotheses concernfollow-ing the nature of their relationship and their subsequent effect on PSQ. We hypothesize:
• H3A: EMV and LTSF are not related to each other.
• H3B: LTSF moderates the relationship between EMV and PSQ.
• H3C: EMV moderates the relationship between LTSF and PSQ.
• H3D: LTSF mediates the relationship between EMV and PSQ.
• H3E: EMV mediates the relationship between LTSF and PSQ.
• H3F: EMV and LTSF are non-recursively related to each other and both affect PSQ.
These hypothesized relationships are illustrated in Fig. 2.
3. Research methodology
3.1. Data collection
Data was collected via a mail survey sent to a sample of 25 North American hotel outlets of a multinational hotel corporation. The hotels included in this sample represented a wide variety of hotel types (with and without suites, vacation and business, franchised and owned); locations (urban, suburban, and resort across the USA and Canada); sizes (111–759 rooms) and ages (on-line from 1970 to the beginning of the study).
Both management and front-line personnel percep-tions of EMV, and LTSF were surveyed. Management personnel surveyed ranged from the hotel general manager, to the food and beverage manager, to the front office manager. Front-line personnel surveyed included receptionists, concierges, desk clerks, and housekeeping staff. Only one hotel did not respond (a response rate of 96%) and over 250 individual responses (174 management and 102 front-line). The corporation also provided their monthly and yearly PSQ data for most of these hotels.
This is a theory building cross-sectional design for studying a variance theory. The unit of observation for PSQ is the hotel customer as an informant. The unit of observation for both the EMV construct and the LTSF construct is the hotel employee as an infor-mant. However, the unit of theoretical analysis is the individual hotel.
and internal validity should result from careful defi-nition of constructs and relationships as well as the design of the survey instrument and the use of mul-tiple types of respondents and mulmul-tiple measures for this survey (Yin, 1989). Construct validity of the de-pendent measure is obtained partly by using the firm’s customer response data. This measure should be both more reliable and more valid than other commonly employed measures such as employees’ ratings of the quality of their service offering. Some statistical and practical validity should result from the regression analyses, as well as the other statistical analyses. Sta-tistical validity is also increased through our choice of sampling frame, multiple outlets of a single firm. Ran-dom irrelevancies in experimental settings (the units of theoretical analysis are subject to various environ-mental factors and systematic influences) are reduced by limiting the study to a single firm. However, limit-ing the study to a slimit-ingle firm reduces external validity and larger studies are planned for the future to address this problem.
3.2. Independent constructs
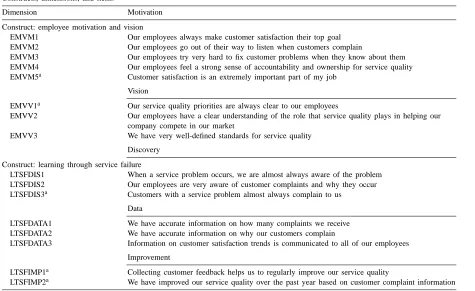
3.2.1. Definition and operationalization of constructs Academics and practitioners were consulted and the literature was reviewed to define the constructs of employee motivation/vision (EMV) and learning through service failure (LTSF) learning and to iden-tify the dimensions of these constructs. Additionally, the literature was searched for existing valid and re-liable measurement instruments/items (Hackman and Lawler, 1971; Lawler and Hall, 1970; Oldham, 1996; Price, 1972). Although, none of the existing measure-ment instrumeasure-ments/items was felt to be appropriate for this study, some of the underlying concepts were ap-plied in the design of the items.
Motivation can be defined as the desire to achieve some goal. Vision is described by Mellander (1993) as “a concordant view of the company’s activities and goals, and of the direction of future trends”. The EMV construct reflects employee motivation to provide high quality service and the existence of a company-wide, all encompassing vision of the importance of high quality service. This construct is defined as:
The degree to which a firm’s employees have a de-sire to provide high quality service and have a clear
vision of the role that service quality plays in the company’s overall strategy.
The two dimensions associated with this construct are defined as:
1. Motivation: The degree to which a firm’s employ-ees have a desire to provide high quality service. 2. Vision: The degree to which management has
com-municated priorities clearly and the firm’s employ-ees (managers through front-line workers) have an awareness of the key role that service quality plays in the company’s strategy.
Huber (1991) relates organizational learning to knowledge acquisition, information distribution, in-formation interpretation, and organizational memory. Nevis et al. (1995) condenses these dimensions to knowledge acquisition, dissemination, and utilization. Although organizations can learn in many ways, this study was focused on LTSF. Therefore, this construct is defined as:
The efficiency with which a firm is able to learn from its customers by discovering dissatisfied customers, collecting information from these cus-tomers, and improving their systems based on the information collected in order to improve the quality of its offerings.
Three dimensions were identified for this construct. They are defined as:
1. Discovery: The degree to which a firm is able to detect service failures.
2. Data: The degree to which a firm collects and com-municates information on service failures. 3. Improvement: The degree to which a firm uses the
failure information to improve quality.
Table 1
Constructs, dimensions, and items
Dimension Motivation
Construct: employee motivation and vision
EMVM1 Our employees always make customer satisfaction their top goal EMVM2 Our employees go out of their way to listen when customers complain
EMVM3 Our employees try very hard to fix customer problems when they know about them EMVM4 Our employees feel a strong sense of accountability and ownership for service quality EMVM5a Customer satisfaction is an extremely important part of my job
Vision
EMVV1a Our service quality priorities are always clear to our employees
EMVV2 Our employees have a clear understanding of the role that service quality plays in helping our company compete in our market
EMVV3 We have very well-defined standards for service quality Discovery
Construct: learning through service failure
LTSFDIS1 When a service problem occurs, we are almost always aware of the problem LTSFDIS2 Our employees are very aware of customer complaints and why they occur LTSFDIS3a Customers with a service problem almost always complain to us
Data
LTSFDATA1 We have accurate information on how many complaints we receive LTSFDATA2 We have accurate information on why our customers complain
LTSFDATA3 Information on customer satisfaction trends is communicated to all of our employees Improvement
LTSFIMP1a Collecting customer feedback helps us to regularly improve our service quality
LTSFIMP2a We have improved our service quality over the past year based on customer complaint information aThe exploratory factor analysis resulted in elimination of these items from the final analysis.
had difficulty with reverse-scaled items. Therefore, all items in the mail survey were positively worded. Items were randomized on the actual survey form.
3.2.2. Factor analysis
3.2.2.1. Suitability. Exploratory factor analysis was used to assess both convergent and discriminant con-struct validity. Factor analysis requires an approximate ratio of respondents/items of 10:1 (Tinsley and Tins-ley, 1987). With over 250 respondents and 16 items, this requirement is met.
The suitability of the data for factor analysis was assessed with various tests. Bartlett’s test of sphericity was significant at the 0.001 level. The overall measure of sampling adequacy was 0.893 and individual mea-sures were all above 0.8. All anti-image correlations were less than 0.3. Thus, this data meets the funda-mental requirements for factor analysis (Hair et al.,
1998). The results reported here were obtained using principal components as the means of extraction and varimax as the method of rotation.
analysis because their corrected item-total correlation was below 0.45.
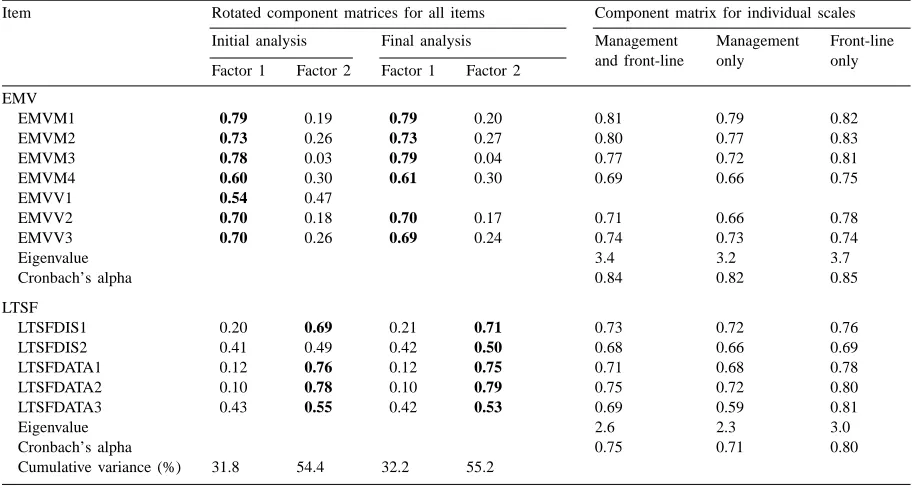
3.2.2.3. Convergent and discriminant validity. An exploratory factor analysis was conducted on the 12 items that remained after purification. Two factors with eigenvalues greater than one (Nunnally, 1978) were identified. All of these items loaded on their the-oretically predicted factor to a greater extent than they cross-loaded on the other factor. However, removal of the item EMVV1 resulted in a ‘cleaner’ solution with all items loading on their theoretical construct at greater than 0.5 and cross-loadings of less than 0.5. Therefore, to increase discriminant validity, this item was removed from further analysis. Additionally, the cumulative percent of variance explained was greater when this item was removed (see Table 2).
Convergent validity was tested by factor analyz-ing the individual constructs to determine whether all items in that construct load on a single factor, again using the eigenvalue greater than one rule (Nunnally, 1978). Table 2 contains the loadings for individual constructs for the entire data set, as well as
manage-Table 2
Factor loadings and Cronbach’s alphasa
Item Rotated component matrices for all items Component matrix for individual scales Initial analysis Final analysis Management
and front-line
Management only
Front-line only Factor 1 Factor 2 Factor 1 Factor 2
EMV
EMVM1 0.79 0.19 0.79 0.20 0.81 0.79 0.82
EMVM2 0.73 0.26 0.73 0.27 0.80 0.77 0.83
EMVM3 0.78 0.03 0.79 0.04 0.77 0.72 0.81
EMVM4 0.60 0.30 0.61 0.30 0.69 0.66 0.75
EMVV1 0.54 0.47
EMVV2 0.70 0.18 0.70 0.17 0.71 0.66 0.78
EMVV3 0.70 0.26 0.69 0.24 0.74 0.73 0.74
Eigenvalue 3.4 3.2 3.7
Cronbach’s alpha 0.84 0.82 0.85
LTSF
LTSFDIS1 0.20 0.69 0.21 0.71 0.73 0.72 0.76
LTSFDIS2 0.41 0.49 0.42 0.50 0.68 0.66 0.69
LTSFDATA1 0.12 0.76 0.12 0.75 0.71 0.68 0.78
LTSFDATA2 0.10 0.78 0.10 0.79 0.75 0.72 0.80
LTSFDATA3 0.43 0.55 0.42 0.53 0.69 0.59 0.81
Eigenvalue 2.6 2.3 3.0
Cronbach’s alpha 0.75 0.71 0.80
Cumulative variance (%) 31.8 54.4 32.2 55.2 aBold numbers highlights factor loadings >0.50.
ment only and front-line only data sets. Both con-structs exhibited convergent validity.
3.2.2.4. Measurement bias. Factor analysis was also used to test for common respondent (all respon-dents are from a single firm), common method, and percept–percept bias. Podsakoff and Organ (1986) suggest that if a single factor explains most of the variance in the data when a factor analysis is per-formed on items with common respondents and/or common methods, the threat of bias is high. However, if a single factor does not explain a large portion of the variance, the threat of bias is small. The above factor analysis identified more than a single factor, indicating that the threat of these biases is small.
The high response rate of 96% allows us to assume that non-respondent bias is not an issue in this study. The use of multiple types of respondents eliminates common respondent bias within the organization.
3.2.3. Reliability
1978) should insure reliability. Both scales had alpha values of 0.70 or greater for the entire data set, as well as the management and front-line subsets (Table 2).
Reliability was also evaluated by comparing man-agement responses to front-line personnel responses. A multivariate analysis of the responses found sig-nificant differences between hotels and personnel type. However, a profile analysis indicated there were no significant interactions between hotels and per-sonnel type (hotelling’s trace = 0.50, P ≥ 0.10). In other words, the response lines for management and front-line personnel were parallel. This indicates reliability across different types of respondents.
3.2.4. Formation of summated factor scores
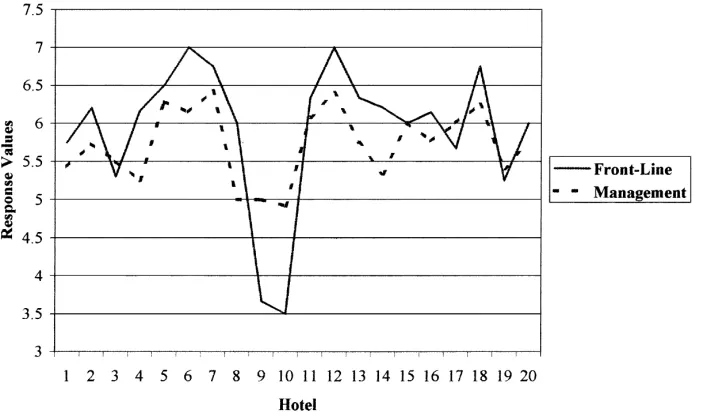
Simple summated factor scores for each construct (EMV, and LTSF) were formed from the items iden-tified by this analysis. Although, both the factor and reliability analysis identified identical constructs for both management and front-line personnel, a multi-variate analysis found significant differences between management and front-line perceptions (see Fig. 3 for a typical profile plot). In general, management evalu-ations of EMV were lower than front-line evaluevalu-ations and management evaluations of LTSF were higher than front-line evaluations. Therefore, the mean of each item for both management and front-line
per-Fig. 3. Profile plot for EMVM1.
sonnel was calculated for every hotel. The mean management score and the mean front-line score were averaged to form an average item score for each hotel. The item scores were then summed and stan-dardized to form two simple factor scores (one for each construct) for each hotel. The EMV factor score was obtained from the following items: EMVM1, EMVM2, EMVM3, EMVM4, EMVV2, and EMVV3. The LTSF construct was formed from the follow-ing items: LTSFDIS1, LTSFDIS2, LTSFDATA1, LTSFDATA2, and LTSFDATA3. These summated factor scores were used in the subsequent test of the research hypotheses.
3.3. Dependent variable
The perceived service quality (PSQ) data provided by the organization was obtained from customer comment cards placed in hotel rooms. It is based on customer response to the following question, “how willing are you to return to a brand hotel?” The re-sponse is a five-point anchored scale with: (1) not at all willing; (3) neutral and (5) definitely willing.
PSQ. Jones and Sasser (1995) argue that, “levels of satisfaction . . . are a good indicator of the level of quality. . . that they (customers) are receiving”. They extend this argument by asserting that only completely satisfied customers are loyal customers. Additionally, a customer’s perception of superior service quality re-sults in increased customer satisfaction, which in turn leads to increased customer retention (Anderson et al., 1994; Fornell, 1992; Fornell et al., 1996; Johnson and Fornell, 1991). Viewed from the opposite perspective, this implies that customers who are “definitely willing to return” are very satisfied and perceive that the firm offers a high level of the service quality.
Although, this is not a perfect measure of PSQ, it is certainly an adequate measure. As Hensley (1999) argues, “. . . if the research is focused on an OM mea-sure that is available from the organization, then the obvious choice should be to use the measure already developed by the organization”. For this study, PSQ data was provided by the organization.
The PSQ construct was operationalized as the proportion of customers in the “definitely willing to return” category in the year prior to employee data collection. A multivariate analysis of all response categories revealed that both EMV and LTSF had significant positive effects on only this category and negative effects on the other categories.
Data was available for 22 of the hotels in the year prior to the data collection period for EMV and LTSF. The number of customer respondents for each hotel in each month ranged from 20 to 700 with an average of 230.
4. Results
Regression analyses and path analyses were ducted to analyze the relationships among the con-structs.
4.1. Regression analyses
A series of regressions were used to test most of the hypotheses. For clarity, we summarize the hypotheses presented earlier.
• H1: Higher levels of EMV will have a positive effect on PSQ.
• H2: Higher levels of LTSF will have a positive effect on PSQ.
• H3A: EMV and LTSF are not related to each other.
• H3B: LTSF moderates the relationship between EMV and PSQ.
• H3C: EMV moderates the relationship between LTSF and PSQ.
• H3D: LTSF mediates the relationship between EMV and PSQ.
• H3E: EMV mediates the relationship between LTSF and PSQ.
• H3F: EMV and LTSF are non-recursively related to each other and both affect PSQ.
Regressions were estimated using the following lin-ear models.
proportion of customers choosing “definitely willing
to return”=Y =βZ+ε
Y =β1ZEMV+ε (1)
Y =β2ZLTSF+ε (2)
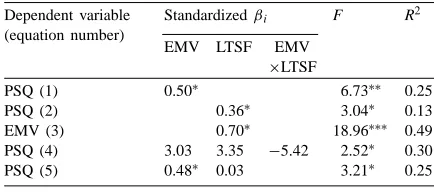
where ZEMV and ZLTSF are the standardized obser-vations for EMV and LTSF, respectively;β1 andβ2 the standardized regression coefficients andε the er-ror term. Table 3 contains the relevant data for all the regressions. EMV was found to have a significant ef-fect on PSQ (P ≤ 0.05). LTSF was found to have a significant effect on PSQ (P ≤0.10).
It is important to note that 25% of the variance in the proportion of customers who are definitely will-ing to return can be explained by the motivation and vision of the employees. While perceptions of
ser-Table 3
vice quality are affected by many things other than the motivation and vision of employees, this result highlights the magnitude of the effect of EMV on PSQ.
Hypotheses H3A, H3D, H3E, and H3F are compet-ing hypotheses, i.e. acceptcompet-ing hypothesis H3A would force us to reject hypotheses H3D, H3E, and H3F. To test hypothesis H3A the following standardized re-gression equation was estimated.
ZEMV =β3ZLTSF+ε (3)
where ZEMV and ZLTSF are the standardized observa-tions for EMV and LTSF, respectively; β3 the stan-dardized regression coefficient and ε the error term. LTSF was found to have a significant positive effect on EMV, thus hypothesis H3A was rejected and the remaining hypotheses could be tested.
Evidence of moderation is provided when there is a significant interaction between two predictor variables (Baron and Kenny, 1986). To test hypotheses H3B and H3C, the following standardized regression equation was estimated.
proportion of customers choosing “definitely willing
to return”=Zβ+ε
Y =ZEMVβ1A+ZLTSFβ2A+ZEMV,LTSFβ4+ε (4) where ZEMV and ZLTSF are the standardized observa-tions for EMV and LTSF, respectively;β1A andβ2A the standardized regression coefficients; ZEMV,LTSF the standardized observations for the interaction; β4 the standardized regression coefficient for the inter-action and ε the error term. There is no significant interaction between EMV and LTSF (p≥0.10), thus hypotheses H3B and H3C were rejected.
To establish mediation, the following criterion must be met (Judd and Kenny, 1981; Baron and Kenny, 1986): (1) the independent variable must have a sig-nificant effect on the mediator, when regressing the mediator on the independent variable; (2) the indepen-dent variable must have a significant effect on the de-pendent variable when regressing the dede-pendent vari-able on the independent varivari-able and (3) the mediator must have a significant effect on the dependent vari-able when regressing the dependent varivari-able on both the independent variable and the mediator. If these conditions all hold in the predicted directions and the
effect of the independent variable on the dependent variable is less in the third regression than the second regression, the mediation hypothesis is supported.
The test of hypothesis H3D utilized regression equa-tions: Eq. (3) (criterion 1), Eq. (1) (criterion 2) and the following standardized regression equation: Eq. (5) (criterion 3).
proportion customers choosing “definitely willing
to return”=Y =Zβ+ε
Y =ZEMVβ1B+ZLTSFβ2B+ε (5)
where ZEMV and ZLTSF are the standardized obser-vations for EMV and LTSF, respectively; β1B and β2Bthe standardized regression coefficients andεthe error term. While EMV was found to have a signif-icant effect on LTSF and EMV was found to have a significant effect on PSQ, the effect of EMV on PSQ was not significantly reduced when the effect of LTSF was added. Thus, hypothesis H3D is rejected.
The test of hypothesis H3E used regression equa-tions: Eq. (3) (criterion 1), Eq. (2) (criterion 2) and Eq. (5) (criterion 3). LTSF was found to have a significant positive effect on EMV and LTSF was found to have a significant positive effect on PSQ. And finally, when we account for the effect of EMV, the effect of LTSF on PSQ essentially disap-pears (p ≥ 0.10). Thus, supporting our hypothesis (H3E) shows that EMV mediates the effect of LTSF on PSQ.
4.2. Path analyses
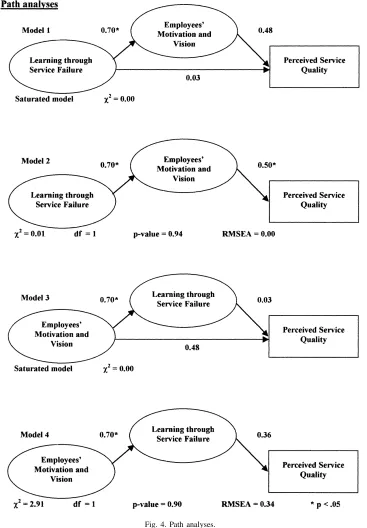
Structural equation modeling can be used to identify a nonrecursive relationship such as the one proposed by H3F. However, at least one predictor for each of the variables involved in the nonrecursive relationship must be unique (Marcoulides and Hershberger, 1997). The small sample size of this study poses an addi-tional problem; a maximum of only four parameters can reasonably be estimated. This makes the identi-fication of a nonrecursive relationship impossible in this case. However, path models can be used to assess the plausibility of hypothesis H3E by examining the level of fit obtained.
mediates the relationship between learning and qual-ity, does LTSF significantly affect (directly or indi-rectly) PSQ. Because, there is a strong theoretical basis for predicting that learning will significantly af-fect quality, only Model 2 is acceptable (Marcoulides and Hershberger, 1997). Additionally, Model 2 ev-idences a high level of fit. Thus, the path analyses provide considerable support for accepting hypoth-esis H3E, EMV mediates the effect of LTSF on PSQ.
5. Conclusions
Learning through service failure (LTSF) was found to have a significant positive effect on perceived ser-vice quality (PSQ) highlighting the importance of customer complaints to service firms. This study il-lustrates the importance of complaints as a means of learning and improving service quality. In many firms, customer complaints are viewed in a negative manner, as a reflection of poor service quality and the goal is to reduce or eliminate customer complaints. However, this study shows that complaints can pro-vide an important avenue for learning and improving PSQ. The goal should not be to eliminate customer complaints, but to eliminate the service failures that cause those complaints. Service firms would be wise to implement systems and procedures that not only encourage customer complaints, but also capture and employ the information contained in those complaints. Service firms with a greater ability to learn from their service failures will be able to achieve higher levels of service quality than their competitors.
Employee motivation/vision (EMV) was found to have a significant positive effect on PSQ. Particu-larly in service firms, because of the interaction of customers and employees in the service process, the motivation and vision of employees drives PSQ. This research provides important empirical verification for both the effect of EMV on service quality and the magnitude of that effect.
Additionally, this research provides strong support for the mediating effect of EMV in the relationship of LTSF to PSQ. Not only do service firms need to insure that their employees know the importance of service quality to the firm and are motivated to provide that quality in order to provide superior quality, the
motivation and vision of the firm’s employees also affects learning.
As firms strive to become ‘learning organizations’, new systems and procedures are designed and put into place in an attempt to achieve this goal. Managers need to be aware that the best systems and procedures are not enough. The motivation and vision of the firm’s employees affect the success of procedures and sys-tems designed to insure learning. Learning will not happen without motivation and vision.
Academics need to be aware of and account for the effects of EMV in any studies of organizational learn-ing and/or service quality that they conduct. If EMV is lacking, the effectiveness of any intervention designed to increase learning will be reduced. Practitioners and managers need to insure that continuing attention is paid to insuring that employees are motivated and have a clear vision of the importance of service qual-ity to the firm, both to increase the effectiveness of organizational learning and to achieve high levels of PSQ.
Although, this study offers important insights for both academics and practitioners, it is limited in size, scope and focus. The study is based on a limited sam-ple from a single firm and, although we believe these results have general applicability across other types of service firms, we do not have any proof that they will. Future study will be aimed at increasing validity by continuing this study with larger samples across a range of firms and service types.
While, we have shown that both EMV and LTSF are important determinants of service quality, there are many other factors, not mentioned here, that can also have a significant impact on service quality. Ser-vices are comprised of people, processes, and accom-panying tangible physical goods. For example, the age and condition of a hotel building will affect customer evaluations of service quality. We minimized the ef-fect of these differences through our sampling frame with a wide variety of multiple outlets from a single firm.
Acknowledgements
This research was partly supported by grants from the National Science Foundation Transformations to Quality Organizations (Grant SBR-9811047), the Ju-ran Center for Leadership in Quality at the University of Minnesota, IMD International, and Radisson Hotels Worldwide.
References
Albrecht, K., Zemke, R.E., 1985. Service America. Irwin (Richard D.), Homewood, IL.
Anderson, E.W., Fornell, C., Lehmann, D.R., 1994. Customer satisfaction, market share and profitability: findings from Sweden. Journal of Marketing 58, 53–66.
Argyris, C., Schon, D.A., 1978. Organizational Learning: A Theory of Action Perspective. Addison-Wesley, Reading, MA. Bandura, A., 1986. Social Foundations of Thought and Action.
Prentice-Hall, Englewood Cliffs, NJ.
Baron, R.M., Kenny, D.A., 1986. The mediator–moderator variable distinction in social psychological research: conceptual, strategic, and statistical considerations. Journal of Personality and Social Psychology 51 (6), 1173–1182.
Bowen, D.E., Lawler III, E.E., 1992. The empowerment of service workers: what, why, how, and when. Sloan Management Review 33 (3), 31–39.
Buzzell, R.D., Gale, B.T., 1987. The PIMS Principles: Linking Strategy to Performance. Free Press, New York.
Capon, N., Farley, J.U., Hoenig, S., 1990. Determinants of financial performance: a meta-analysis. Management Science 36 (1), 1143–1159.
Carver, C.S., Scheier, M.F., 1981. Attention and Self-Regulation: A Control Theory of Human Behavior. Springer, New York. Churchill Jr., G.A., 1979. A paradigm for developing better
measures of marketing constructs. Journal of Marketing Research 16 (1), 64–73.
Collier, D.A., 1994. The Service/Quality Solution Using Service Management to Gain Competitive Advantage. Irwin (Richard D.), Milwaukee, WI.
Czepiel, J.A., Solomon, M.R., Surprenant, C.F., 1985. The Service Encounter, Managing Employee/Customer Interaction in Service Businesses. Lexington Books, Lexington, MA. Farber, B., Wycoff, J., 1991. Customer service: evolution and
revolution. Sales and Marketing Management 44–51. Fornell, C., 1976. Consumer Input for Marketing Decisions: A
Study of Corporate Departments for Consumer Affairs. Praeger, New York.
Fornell, C., 1992. A national customer satisfaction barometer: the Swedish experience. Journal of Marketing 55, 1–21. Fornell, C., Johnson, M.D., Anderson, E.W., Cha, J., Bryant,
B.E., 1996. The American customer satisfaction index: nature, purpose, and findings. Journal of Marketing 60, 7–18. Hackman, J.R., Lawler III, E.E., 1971. Employee reactions to job
characteristics. Journal of Applied Psychology 55 (3), 259–286.
Hackman, J.R., Oldham, G.R., 1980. Work Redesign. Addison-Wesley, Reading, MA.
Hair Jr., J.F., Anderson, R.E., Tatham, R.L., Black, W.C., 1998. Multivariate Data Analysis, 5th Edition. Prentice-Hall, Upper Saddle River, NJ.
Hart, C.W.L., 1993. Extraordinary Guarantees. Amacom, New York.
Hensley, R.L., 1999. A review of operations management studies using scale development techniques. Journal of Operations Management 17 (3), 343–358.
Hill, A.V., 1995. Service guarantees: The fast-track to service quality. IMD Perspectives 2 (March), 1–4.
Hostage, G.M., 1975. Quality control in a service business. Harvard Business Review 53 (4), 98–106.
Huber, G.P., 1991. Organizational learning: the contributing process and the literatures. Organization Science 2 (1), 88– 115.
Ittner, C.D., Larcker, D.F., 1996. Measuring the impact of quality initiatives on firm financial performance. In: Ghosh, S., Fedor, D. (Eds.), Advances in the Management of Organizational Quality. JAI Press, Greenwich, CT.
Johnson, M.D., Fornell, C., 1991. A framework for comparing customer satisfaction across individuals and product categories. Journal of Economic Psychology 12 (2), 267–286.
Jones, T.O., Sasser Jr., W.E., 1995. Why satisfied customers defect. Harvard Business Review 73 (6), 88–99.
Judd, C.M., Kenny, D.A., 1981. Process analysis: estimating mediation in treatment evaluations. Evaluation Review 5 (5), 602–619.
Lawler III, E.E., Hall, D.T., 1970. Relationship of job characteristics to job involvement, satisfaction, and intrinsic motivation. Journal of Applied Psychology 54 (4), 305–312. Locke, E.A., 1982. Relation of goal level to performance with a
short work period and multiple goal levels. Journal of Applied Psychology 67 (4), 512–515.
Locke, E.A., Latham, G.P., 1984. Goal Setting: A Motivational Technique that Works. Prentice-Hall, Englewood Cliffs, NJ.
Locke, E.A., Latham, G.P., 1990. A Theory of Goal Setting and Task Performance. Prentice-Hall, Englewood Cliffs, NJ. Lovelock, C.H., 1994. Product Plus. McGraw-Hill, New York. Marcoulides, G.A., Hershberger, S.L., 1997. Multivariate Statistical
Methods: A First Course. Lawrence Erlbaum, Mahwah, NJ.
Marquardt, M.J., Reynolds, A., 1994. The Global Learning Organization. Irwin (Richard D.), New York.
Mellander, K., 1993. The Power of Learning. Irwin (Richard D.), Homewood, IL.
Mohr, L.A., Bitner, M.J., 1995. The role of employee effort in satisfaction with service transactions. Journal of Business Research 32 (3), 239–252.
Nevis, E.C., DiBella, A.J., Gould, J.M., 1995. Understanding organizations as learning systems. Sloan Management Review 36 (2), 73–85.
Nunnally, J.C., 1978. Psychometric Theory. McGraw-Hill, New York.
implications for the hospitality industry. Hospitality Research Journal 20 (3), 35–64.
Oldham, G.R., 1996. Job design. International Review of Industrial and Organizational Psychology, Vol. 11. Wiley, Chichester, UK. Parasuraman, A., Zeithaml, V.A., Berry, L.L., 1988. SERVQUAL: a multiple-item scale for measuring consumer perceptions of service quality. Journal of Retailing 64 (1), 12–40.
Phillips, L.W., Chang, D.R., Buzzell, R.D., 1983. Product quality, cost position, and business performance: a test of some key hypotheses. Journal of Marketing 47, 26–43.
Podsakoff, P.M., Organ, D.W., 1986. Self reports in organizational research: problems and prospects. Journal of Management 12 (3), 531–544.
Porter, L.W., Lawler, E.E., 1968. Managerial Attitudes and Performance. Irwin (Richard D.), Homewood, IL.
Price, J.L., 1972. Handbook of Organizational Measurement. Heath, Leungton, MA.
Sasser, W.E.J., Olson, R.P., Wycoff, D.D., 1978. Management of Service Operations: Text, Cases, and Readings. Allyn & Bacon, Boston, MA.
Schmenner, R.W., 1995. Service Operations Management. Prentice-Hall, Englewood Cliffs, NJ.
Schneider, B., 1980. The Service Organization: Climate is Critical. Amacom, New York.
Schneider, B., Bowen, D.E., 1985. Employee and customer perceptions of service in banks: replication and extension. Journal of Applied Psychology 70 (3), 423–433.
Schneider, B., Parkington, J.J., Buxton, V.M., 1980. Employee and customer perceptions of service in banks. Administrative Science Quarterly 25 (2), 252–267.
Schneider, B., Ashworth, S.D., Higgs, A.C., Carr, L., 1996. Design, validity, and use of strategically focused employee attitude surveys. Personnel Psychology 49 (3), 695–705.
Senge, P.M., 1990. The Fifth Discipline. Doubleday, New York. Tinsley, H.E., Tinsley, D.J., 1987. Use of factor analysis
in counseling psychology research. Journal of Counseling Psychology 34 (4), 414–424.
Voss, C.A., Blackmon, K., Chase, R., Rose, E., Roth, A.V., 1996. Competitiveness of UK Service: An Anglo-US Benchmark Comparison of Service Practice and Performance. Center for Operations Management, London School of Business, London, UK.
Vroom, V.H., 1964. Work and Motivation. Wiley, New York. Wirtz, J., 1998. Development of a service guarantee model. Asia
Pacific Journal of Management 15 (1), 51–75.
Yin, R.K., 1989. Case Study Research. Sage, Beverly Hills, CA. Zeithaml, V.A., Berry, L.L., Parasuraman, A., 1993. The nature
and determinants of customer expectations of service. Journal of the Academy of Marketing Science 21 (1), 1–12. Zeithaml, V.A., Parasuraman, A., Berry, L.L., 1988. SERVQUAL:
a multiple-item scale for measuring consumer perceptions of service quality. Journal of Retailing 64 (1), 12–40.