THE EFFECT OF TRANSITORY EARNINGS
ON THE USE OF E/P RATIOS IN CORPORATE VALUATION: EMPIRICAL EVIDENCE FROM INDONESIA
ERNI EKAWATI
Fakultas Ekonomi Universitas Kristen Duta Wacana
ABSTRACT
The purposes of this study are, firstly, to confirm the findings of the previous study, whether earnings contain transitory components. Secondly, to investigate how E/P ratios are affected when firms experience transitory earning changes. Thirdly, to examine whether the differences in E/P ratios across firms due to differences in the magnitude of transitory earnings will quickly disappear in subsequent years.
Using financial data of companies listed in Jakarta Stock Exchange (JSE) from the periods of 1993 to 2003, the study finds that earning changes exhibit a transitory component. Under the condition of transitory earnings, firm’s E/P ratio is positively affected by the changes in earnings. Industry-adjusted earning changes variable is shown to have a high explanatory power in predicting firm’s E/P ratio. As the variation of firm’s E/P ratios are mainly explained by the transitory component of earnings, time series pattern of E/P ratios reflects transitory deviations due to the transitory component of earnings changes.
A. INTRODUCTION
Many practitioners subscribe to the view that accounting earnings and earning-to-price (E/P) ratios are among the most important figures in making investment decisions. E/P has also drawn much attention from academicians, and has been interpreted in various ways. Some popular interpretations of E/P ratios have been an earning capitalization rate (Graham et al., 1962), an indicator of mis-priced stocks (Basu, 1977 and Jaffee et al., 1989), an indicator of transitory earnings (Beaver and Morse, 1978), and a risk measure (Ball, 1978).
Recent academic evidence documents that changes in earnings and profitability are to some extent predictable (Lev, 1969; Freeman et al., 1982; Collins and Kothari, 1989; Easton and Zmijewski, 1989; Ou and Penman, 1989; Elgers and Lo, 1994; Basu, 1997; and Fama and French, 2000;). Similar evidence are also found in Indonesia (Assih, 1999; Werdiningsih, 2001; and Febriyanti, 2004). Fama and French (2000) document that earnings tend to be mean reverting. Large increases in earnings are followed by subsequent decreases, while large decreases are followed by increases. The changes in earnings tend to reverse from one year to the next, and large changes of either sign reverse faster than small changes. They also find that negative changes in earnings reverse faster than positive changes. Since extreme changes in earnings seem to reverse faster, it is believed that these changes are due to the transitory component of earnings.
Unlike permanent earning components, transitory components such as extraordinary gains and losses, changes in earnings due to changes in accounting standards, and similar items that are not expected to continue in the future, are not expected to persist for long periods of time. Thus, earnings that contain a large transitory component lose relevance for making investment decisions (Stunda and Typpo, 2004).
correct adjustment may be to decrease the E/P ratio. Furthermore, as the transitory component of earnings may cause the E/P ratio of such firms temporarily deviate from its value, the differences of E/P ratios across firms due to differences of the magnitude of transitory components will quickly disappear in subsequent years.
The purpose of this study is, firstly, to confirm the findings of the previous study, using data from companies listed in Jakarta Stock Exchange (JSE), whether earnings contain transitory components or are mean reverting. Secondly, to investigate how E/P ratios are affected when firms experience transitory earning changes. Thirdly, to examine whether the differences in E/P ratios across firms due to differences in the magnitude of transitory earnings will quickly disappear in subsequent years.
For the most part, the studies on the transitory earnings conducted in Indonesia (e.g. Diana and Kusuma, 2004 and Mustafa, 2005) employ the model as used in Ou and Penman (1989), Ali and Zarowin (1992), Cheng et al. (1996) and Charitou et al. (2001). The model is to rank the firms based on their E/P ratios. Firms having the lowest and the highest E/P are identified to have transitory component of earnings. This study uses a finer approach by standardizing the firm earning changes using market capitalization and comparing the firm earning changes with the median of firms’ earnings changes in the same industry. This approach can identify the magnitude of the transitory component of earning changes. This study also provides an additional contribution to the previous study (Zulfiati, 2004) related to examining the time-series property of E/P ratios.
This study to some extent will contribute to the practitioners such as investment analysts, investors, investment bankers, and appraisers that appropriate adjustments due to transitory earning changes must be applied in using the E/P ratio approach for corporate valuation. For accounting literature, this study will provide evidence that the transitory components of earnings may reduce the value relevance of earnings information, as a consequence, alternative relevant information such as cash flows may be weighted more heavily by investors in making investment decisions. For finance literature, this study will provide an indirect test of efficient market hypothesis whether investors in JSE are knowledgeable in valuing the firm stocks containing transitory earnings.
B. RELATED STUDIES AND HYPOTHESIS DEVELOPMENTS
B.1. Transitory Earning Changes
All the events that may create or destroy a firm’s value are eventually reflected in earnings. In the long run, a fundamental connection exists between the changes in stock return and changes on earning per share. However, in the short run, the relationship between stock returns and earning is not as clear cut. The short run relationship is dependent on how accountants measure short run earnings. Compared to the transitory component, the permanent component of earnings generally has a greater effect on stock return. However, it is not clear how to decompose the earnings into the components of permanent and transitory. A fine approach is to examine the time series property of earnings.
reverse faster than small changes. They also demonstrate that the predictability of earnings is due to the mean reversion of profitability. These findings imply that earnings contain transitory components that construct the time-series properties in mean reversion of earnings.
This study will investigate the time series property of earnings changes using data from companies listed in JSE. Accordingly, the hypothesis is stated as follows:
H1: Earnings are mean reverting, in which, positive (negative) earnings changes are followed by negative (positive) earnings changes.
B.2. E/P Ratios and Earning Changes
Studies on the relationship between earnings and stock prices are dated back to Benston (1966) and Ball and Brown (1968). Ball and Brown find that the sign of stock price changes is positively related to that of the earnings changes. Beaver et al. (1979) extend Ball’s and Brown’s (1968) study by considering the magnitude of the changes in earnings. They divided the sample into 25 portfolios based on the residual percentage changes in price and find that the residual percentage changes in earnings was positively related to residual percentage changes in price. Judging from the magnitude of the changes in stock prices, it seems that some of the unexpected earnings is enduring and related to the dividend paying ability in the future. However, the relationship between the changes in stock prices and the changes in earnings is not constant across the portfolios. For the extreme portfolios, the percentage changes in stock prices is less than that of the earnings, suggesting part of the unexpected earnings is transitory. The transitory component affects only the current earnings, not the expected future earnings.
Beaver and Morse (1978) find out that stock with low (high) E/P ratio in the year-end often has low (high) earning growth during the year and has a high (low) earnings growth in the years thereafter. This phenomenon is explicable if investors are knowledgeable that a fraction of the earnings is transitory. Consistent with the previous studies, Bajaj et al. (2004) show that firms with changes in earnings that are below (above) the industry median have E/P ratios that are below (above) the industry median. These effects persist in cross-sectional regression that controls for other cross-sectional determinants of E/P ratios.
This study will examine the relationship between E/P ratios and transitory earnings changes using data from companies listed in JSE. Accordingly, the hypothesis is stated as follows:
H2: Under transitory earnings changes, E/P ratio is positively affected with the changes in earnings.
B.3. Time Series Pattern of E/P Ratios
Kormendi and Lipe (1987) indicate that the extent to which the stock return is affected by the unexpected earnings is linked to the present value of the revisions in future expected earnings. By assuming that the stochastic process of earnings and stock price consist of a permanent and transitory components, Liu and Wang (2004) decompose the variance of stock returns and are able to see how stock return and E/P ratio dynamically respond to the permanent and transitory shocks to accounting earnings. As E/P ratios are mainly explained by the temporary shocks to earnings, deviations in E/P ratios tend in part to be transitory.
Bajaj et al. (2004) use industry’s earnings and industry’s E/P median to indicate the norm level of earnings and E/P ratios, respectively. Their study demonstrates that as the firm’s earnings bounce back to the industry norm level, the firm’s E/P ratios bounce back towards the industry median as well. They explain the time series pattern of E/P ratios by demonstrating through their study that the differences between firm and industry E/P ratios diminish over the subsequent years as the firm’s earnings revert back towards the industry norm.
earnings will quickly disappear in subsequent years. Accordingly the hypothesis is stated as follows:
H3: The differences in E/P ratios across firms grouped on the basis of industry-adjusted, standardized change in earnings, disappear in subsequent years.
C. RESEARCH METHODS
C.1. Data
Financial data and capital market data are collected for all firms listed in Jakarta Stock Exchange from financial report database of Jakarta Stock Exchange and PDPM database of Accounting Development Center of Gadjah Mada University. The periods coverage is over the years 1990-2003.
All firms with available data are included in the sample. Following Bajaj et al. (2004), E/P ratios of firms with negative earnings are excluded from the sample.
C.2 Definition of the Variables
The followings are variables used in this study:
- EARN: earning measured as net income.
- ∆EARNt: earning change in year t measured as the differences between earning in year t and earning in year t-1. To have a meaningful comparison of earning changes across firms, earning changes are standardized by market value of firm’s equity as of end of year t-1.
- ∆AEARNt: industry-adjusted earnings changes measured as the difference between the firm’s standardized earnings change (∆EARNt) and the median of standardized earnings change among firms in the same industry.
- EP: earning-price ratio measured as firm’s annual earnings in the numerator and the market value of the firm’s equity as of the end of the following quarter in the denominator.
- EPmed: industry median E/P ratio measured as the median E/P ratios among firms in the same industry.
- GROWTH: firm’s sales growth measured as sales growth over the prior three years.
The ∆EARNt variable is used to measure earning changes of the firm in year t. This changes include the components of permanent and transitory. The permanent component of earnings changes is measured as the median of standardized earnings change among firms in the same industry. Thus, ∆AEARNt can be used as a measure of transitory component of earnings changes.
C.3. Statistical Model and Hypothesis Tests
To test the mean reversion of earnings (H1), firm-year observations are grouped into quintiles (Q1-Q5) on the basis of industry-adjusted standardized earnings change (∆AEARNt). Then, ∆AEARNt is examined for firms in the two most extreme quintiles (Q1 and Q5) on year 0 (Y0) and over the subsequent three years (Y1-Y3). T-test is used to test the differences in industry-adjusted earnings of firms in Q1 and Q5 in year 0 (Y0) and year 3 (Y3), where Q1 and Q5 consist of firms with negative and positive earning changes, respectively. The hypothesis (H1) is supported if there is a statistical difference in industry-adjusted earnings of firms in Q1 and Q5 in Y0, but there is no statistical difference in Y3. Thus, the test will indicate whether earnings tend to be mean reverting.
positive and significant in Q5. Thus, this test will indicate that firms experience extreme negative earnings changes (Q1) tend to have lower E/P ratios compared to the industry’s E/P ratio, while firms experience extreme positive earning changes (Q5) tend to have higher E/P ratios than industry’s.
Regression is also employed to test H2, the statistical model is as follows:
ε
EP across firms. H2 is supported if β3 is positive and significant. This result will indicate that knowledge of current industry-adjusted earnings changes (∆AEARN), a proxy of transitory earnings changes, has incremental power in explaining E/P ratios, even after accounting for differences in industry E/P ratios and differences in growth rate.To test the H3, whether the differences in E/P ratios across firms disappear in subsequent years, the differences of EP and EPmed are observed across quintiles (Q1-Q5) from year 0 (Y0) to year 3 (Y3). There should be a large differences of EP and EPmed across quintiles in year 0, and across quintiles differences should disappear in year 3 (Y3).
D. EMPIRICAL RESULTS
D.1. Descriptive Statistics
Table 1 provides descriptive statistics for variables of interest. Firm-year observations are first grouped into quintiles on the basis of industry-adjusted change in earnings. The mean and median of earnings changes are the lowest in quintile 1 and the highest in quintile 5. This phenomenon is similar for industry-adjusted earnings changes.
The mean of EP ratio of quintile 1 and 2 have negative values. The negative values are due to some negative numbers of earnings’ firm-year observations. The study will lose a significant number of observations if negative earnings are eliminated. However, negative median of EP ratios only occurs in quintile 1. Thus, the median EP ratios among firms in the same industry is used to measure industry EP ratio (EP med). Across quintile, the mean and median of sales growth are positive.
D.2. Mean Reversion of Earnings
After grouping firm-year observations into quintiles on the basis of industry-adjusted standardized earnings changes, the level of industry-adjusted earnings changes is examined over the subsequent three years, especially for firms in the extreme quintiles, the negative earnings changes tend to be followed by positive earnings changes in three subsequent years (Y1, Y2, and Y3). Conversely, firms exhibiting the largest positive earnings changes (quintile 5) have earnings that are above those of their industry peers. Similarly, this is a temporary phenomenon as the positive earnings changes tend to be followed by negative earnings changes in first year (Y1), and then positive earning changes again in second (Y2) and third (Y3) year.
years. As shown by the t-value, the mean differences are no longer statistically significant across Y1 to Y3. Thus, H1 is supported.
Table 1 Descriptive Statistics
Quintile 1 2 3 4 5
Total Sample EARN
mean -1.471 -0.184 -0.033 0.113 0.565 511 std 2.379 0.301 0.191 0.190 1.233 511 min -13.862 -1.821 -1.404 -0.226 -0.660 511 med -0.253 -0.041 0.008 0.034 0.125 511 max 0.175 0.258 0.309 0.801 7.591 511 EP
mean -2.103 -0.237 0.011 0.088 -0.044 511 std 3.908 0.794 0.203 0.196 1.881 511 min -19.239 -4.944 -0.854 -0.733 -17.803 511 med -0.192 0.040 0.063 0.087 0.116 511 max 0.576 0.506 0.310 0.543 1.796 511 EPmed
mean -0.042 -0.014 0.020 0.026 -0.090 511 std 0.256 0.216 0.152 0.150 0.294 511 min -0.835 -0.835 -0.835 -0.722 -0.835 511 med 0.061 0.062 0.062 0.073 0.056 511 max 0.164 0.164 0.164 0.164 0.164 511 Growth
mean 0.337 2.311 0.476 2.544 0.404 511 std 0.395 19.675 0.800 21.384 0.506 511 min -0.331 -0.584 -0.441 -0.410 -0.370 511 med 0.263 0.294 0.321 0.328 0.299 511 max 2.702 198.052 6.701 213.134 2.937 511 AEARN
mean -1.397 -0.143 -0.001 0.116 0.683 511 std 2.202 0.191 0.030 0.110 1.174 511 min -13.665 -1.051 -0.115 0.003 0.012 511 med -0.381 -0.071 0.000 0.074 0.296 511 max -0.019 -0.003 0.105 0.498 7.493 511
Table 2 Mean Differences of Industry-Adjusted Earnings Changes
Y0 Y1 Y2 Y3
Q1 -1.124 0.437 0.347 0.204 Q5 0.507 -0.367 0.272 0.014 Q5-Q1 1.631 -0.804 -0.075 -0.190 T-value 2.685** -1.073 -0.143 -0.501 Note:
** : Significant at the level of 5%
D.3. The Regression Result of Earnings Changes on E/P Ratios
sales growth as a control variable. Model 3 adds the variable of interest, industry-adjusted earnings changes.
Table 3 Regression Output
Model Intercept E/P med Growth AEARN R²
1 -0.427*** 2.730*** 0.079
(-4.570) (6.614)
2 -0.431*** 2.725*** 0.003 0.079
(-4.585) (6.595) (0.415)
3 -0.270*** 1.586*** 0.002 1.106*** 0.525 (-3.969) (5.257) (0.418) (21.804)
Note:
*** : Significant at the level of 1% ** : Significant at the level of 5% * : Significant at the level of 10%
The results indicate that industry-adjusted earnings changes have a statistically significant impact on E/P ratios. Model 3 that includes industry-adjusted earnings changes explain a significantly greater amount of the variation in E/P ratios than the other models do. The regression coefficient of industry-adjusted earnings changes is 1.106 and significant at the alpha level of 1%. Another explanatory variable, median of industry E/P ratio also has a positive and significant effect in explaining the variation of firm’s E/P ratio, while sales growth has no explanatory power in explaining the variation of firm’s E/P ratio. More importantly, the R2 of the regression increases from 0.079 in model 1 to 0.525 in model 3 after employing the earning changes variable in the model. Thus, H2 is supported that industry-adjusted earning changes has a substantially positive effect on firm’s E/P ratio. In predicting the firm’s E/P ratio, the variable of industry-adjusted earnings changes is more useful than industry median of E/P.
D.4. The Result on Time Series Pattern of E/P Ratios
To examine time series pattern in firm’s E/P ratio, this study observes the mean differences between firm’s E/P ratio and median of industry’s E/P ratio. Since earnings changes are conformed to be mean reverting, it is expected that industry-adjusted E/P ratios in each quintile to revert back towards industry norm over time. Table 4 reports the mean differences between firm’s and industry’s E/P ratio within each quintile over years 1 (Y1) to year 3 (Y3) relative to the year (Y0) in which the quintiles are formed on the basis of industry-adjusted change in earnings.
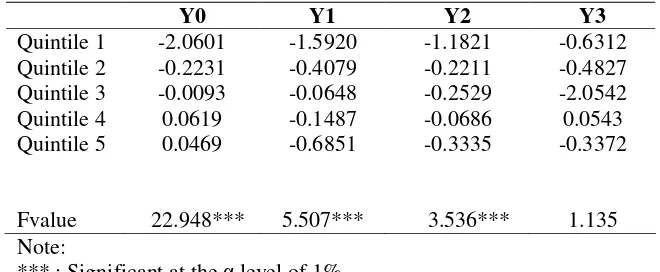
Table 4 The Mean Differences Between the Firm's E/P Ratio and the Industry Median E/P Ratio Across Quintiles
Y0 Y1 Y2 Y3
Quintile 1 -2.0601 -1.5920 -1.1821 -0.6312 Quintile 2 -0.2231 -0.4079 -0.2211 -0.4827 Quintile 3 -0.0093 -0.0648 -0.2529 -2.0542 Quintile 4 0.0619 -0.1487 -0.0686 0.0543 Quintile 5 0.0469 -0.6851 -0.3335 -0.3372
Fvalue 22.948***
5.507*** 3.536*** 1.135 Note:
*** : Significant at the level of 1%
differences are significantly varied with alpha level of 1%. The variation across quintile is consistent with the result of H2 test that transitory earning changes is positively related with firm’s E/P. Thus, Firms in quintile 1 has a negative transitory earnings change, in turn, the firms’ E/P ratio is lower than industry’s E/P ratio. The converse is true for the firms in quintile 5. As a consequence of the result of H1 test that earning changes are transitory, is that the mean differences in E/P ratios across quintiles are also not permanent over time. Table 4 shows that the mean differences of E/P ratios across quintiles are gradually disappeared, as indicated by the smaller F-value over the subsequent three year periods. Thus, H3 is supported.
E. CONCLUSIONS
This study finds that earning changes exhibit a transitory component. Under the condition of transitory earnings, firm’s E/P ratio is positively affected by the changes in earnings. Industry-adjusted earning changes variable is shown to have a high explanatory power in predicting firm’s E/P ratio. As E/P ratios are mainly explained by the transitory component of earnings, time series pattern of E/P ratios reflects transitory deviation due to the transitory component of earnings changes.
The results of this study have a substantial contribution related to the common approach used by practitioners in valuing the firm using P/E multiplier. Under the P/E multiplier approach, the analysts first estimates the appropriate P/E multiple for the firm using a comparable set of publicly traded companies. Median industry’s P/E ratio usually is used as an estimator. The analysts then estimates the firm’s stock price as the product of the firm’s earning and the estimate of the appropriate P/E multiple.
This study suggests that industry’s median E/P ratios should be adjusted if the earnings of the firm under consideration have a large transitory component. Firms with high (low) current earnings relative to the industry will have higher (lower) E/P ratios than their industry peers. The result of this study supports this prediction. As indicated by regression output, knowledge of industry-adjusted earning changes has a large incremental explanatory power in explaining E/P ratio variation across firms, even after controlling for median of industry’s E/P ratio and sales growth.
Nonetheless, this study is not able to explain the remaining substantial portion of the variation in E/P ratios. The sources of transitory earnings are not investigated. The decomposition of earnings into permanent and transitory components are required to identify the magnitude of transitory earnings. All these limitations are left for future research.
REFERENCES
Ali, A. and P. Zarowin. 1992. The Role of Earnings Levels in Annual Earning-Return Studies. Journal of Accounting Research30: 286-96.
Assih, P. 1999. Laba Akuntansi dan Klasifikasi Akuntansi untuk Menaksir Profitabilitas Perusahaan. Jurnal Bisnis dan Akuntansi 1,3: 183-94.
Ball R. 1988. Anomalies in Relationships between Securities’ Yields and Yield-Surrogates. Journal of Financial Economics: 663-682.
Bajaj, M., D.J. Denis, and A. Sarin. 2004. Mean Reversion in earnings and the Use of E/P Multiples in Corporate Valuation. Journal of Applied Finance 14,1: 4-10.
Basu, S. 1997. The Conservatism Principle and the Asymmetric Timeliness of Earnings.
Journal of Accounting and Economics 24: 3-37.
Beaver, W.H. 1970. The Time Series Behavior of Earnings. Journal of Accounting
Research 8. supp.: 62-69.
Beaver, W.H. and D. Morse. 1978. What Determines Price-Earning Ratios?. Financial
Analysts Journal: 65-76.
Beaver, W.H., R. Clark, and W. Wright. 1979. The association between Unsystematic Security Returns and the Magnitude of the Earnings Forecast Error. Accounting
Brooks, L.D., and D.A. Buckmaster. 1976. Further Evidence of the Time Series Properties of Accounting Income. Journal of Finance 31: 1359-73.
Charitou, A., C. Clubb, and A. Andreou. 2001. The Effect of Earning Permanence, Growth, and Firm Size on the Usefulness of Cash Flows and Earnings in Explaining Security Returns: Empirical Evidence for the U.K. Journal of
Business Finance and Accounting, 28: 563-94.
Cheng, C.S.A., C. Liu, and T. Schaefer. 1997. The Value Relevance of SFAS no. 95 Cash Flow from Operations as Assessed by Security Market Effects. Accounting
Horizon 11, 3: 1-15.
Cheng, C.S.A., and R. McNamara. 2000. The Valuation Accuracy of the Price-Earnings and Price-Book Benchmark Valuation Methods. Review of Quantitative Finance
and accounting 15, 4: 349-70.
Collins, D.W., and S.P. Kothari. 1989. An Analysis of Intertemporal and Cross-sectional Determinants of Earning Response Coefficients. Journal of Accounting and
Economics 11: 143-81.
Cornell, B. and W.R. Landsman. 2003. Accounting Valuation: Is Earnings Quality an Issue?. Financial Analysts Journal 59,6: 20-28.
Diana, S.R. and I.W. Kusuma. 2004. Pengaruh Faktor Kontekstual terhadap Kegunaan Earnings dan Arus Kas Operasi dalam Menjelaskan Return Saham. Jurnal Riset
Akuntansi Indonesia 7,1: 74-93.
Easton, P.D. and M. Zmijewski. 1989. Cross-sectional Variation in the Stock Market Response to Accounting Income. Journal of Accounting and Economics 11: 117-41.
Elgers, P.T. and M.H. Lo. 1994. Reductions in Analysts’ annual Earnings Forecast Errors using Information in Prior Earnings and Security Returns. Journal of
Accounting Research 32: 290-303.
Fama, E.F and K.R. French. 2000. Forecasting Profitability and Earnings. Journal of
Business 73,2: 161-75.
Febriyanti, G.A. 2004. Perbandingan Keakuratan Model Laba Permanen, Transitori, dan Agregat dalam Memprediksi Laba Masa Depan. Dipresentasikan pada SNA VII -Denpasar, Bali, 2-3 Desember.
Freeman, R.N., J.A.Ohlson, and S.H. Penman. 1982. Book Rte-of-Return and Prediction of Earnings Changes: An Empirical Investigation. Journal of Accounting
Research 20: 639-53.
Jaffe, J., D.B. Keim, and R. Westerfield. 1989. Earnings Yield, Market Values, and Stock Returns. Journal of Finance, 135-48.
Kang, T. 2003. The Profitability of EP Trading Rule Based on Operating Income.
American Business Review 21,2: 41-46.
Kang, T. 2004. Quality of Earnings Inferred from the Profitability of EP Trading Rules.
Managerial Fianance 30,1: 30-44.
Lev, B. 1969. Industry Averages as Targets for Financial Ratios. Journal of Accounting
Research 7: 290-99.
Liu, C.and T. Wang. 2005. The Response of Stock Prices to Permanent and Transitory Shocks to Accounting Earnings. Working Paper: Department of Accounting - National Taiwan University.
Lookabill, L.L. 1976. Some additional Evidence on the Time Series Properties of Accounting Earnings. Accounting Review 51: 724-38.
Mustofa, J. 2005. Informasi Relevan dari Laba dan Aliran Kas Operasi: Studi Empiris di Indonesia. Tesis S2. Program Magister Sains. Universitas Gadjah Mada. Yogyakarta.
Ou, J.A. and S.H. Penman. 1989. Accounting Measurement, Price-Earning Ratio, and the Information Content of Security Prices. Journal of Accounting Research 27,
Werdiningsih, S. 2001. Pengaruh Klasifikasi Komponen Laba terhadap Kemampuan Prediksi Laba. Tesis S2. Program Magister Sains. Universitas Gadjah Mada. Yogyakarta.
Stunda, R.A. and E. Typpo. 2004. The Relevance of Earnings and Funds Flow from Operations in the Presence of Transitory Earnings. Journal of Real Estate
Portfolio Management 10,1: 37-45.