This ar t icle was dow nloaded by: [ Univer sit as Dian Nuswant or o] , [ Rir ih Dian Prat iw i SE Msi] On: 27 Januar y 2014, At : 00: 33
Publisher : Rout ledge
I nfor m a Lt d Regist er ed in England and Wales Regist er ed Num ber : 1072954 Regist er ed office: Mor t im er House, 37- 41 Mor t im er St r eet , London W1T 3JH, UK
Accounting and Business Research
Publ icat ion det ail s, incl uding inst ruct ions f or aut hors and subscript ion inf ormat ion:
ht t p: / / www. t andf onl ine. com/ l oi/ rabr20
Investigating the audit fee structure of local
authorities in England and Wales
Gary Giroux a & Rowan Jones b a
Texas A&M Universit y b
Universit y of Birmingham Publ ished onl ine: 28 Feb 2012.
To cite this article: Gary Giroux & Rowan Jones (2007) Invest igat ing t he audit f ee st ruct ure of l ocal aut horit ies in Engl and and Wal es, Account ing and Business Research, 37: 1, 21-37, DOI: 10. 1080/ 00014788. 2007. 9730056
To link to this article: ht t p: / / dx. doi. org/ 10. 1080/ 00014788. 2007. 9730056
PLEASE SCROLL DOWN FOR ARTI CLE
Taylor & Francis m akes ever y effor t t o ensur e t he accuracy of all t he infor m at ion ( t he “ Cont ent ” ) cont ained in t he publicat ions on our plat for m . How ever, Taylor & Francis, our agent s, and our licensor s m ake no r epr esent at ions or war rant ies w hat soever as t o t he accuracy, com plet eness, or suit abilit y for any pur pose of t he Cont ent . Any opinions and view s expr essed in t his publicat ion ar e t he opinions and view s of t he aut hor s, and ar e not t he view s of or endor sed by Taylor & Francis. The accuracy of t he Cont ent should not be r elied upon and should be independent ly ver ified w it h pr im ar y sour ces of infor m at ion. Taylor and Francis shall not be liable for any losses, act ions, claim s, pr oceedings, dem ands, cost s, expenses, dam ages, and ot her liabilit ies w hat soever or how soever caused ar ising dir ect ly or indir ect ly in connect ion w it h, in r elat ion t o or ar ising out of t he use of t he Cont ent .
21
zyxwvutsrqponmlkjihgfedcbaZYXWVUTSRQPONMLKJIHGFEDCBA
Investigating the audit fee structure of local
authorities in England and Wales
Gary Giroux and Rowan Jones*
zyxwvutsrqponmlkjihgfedcbaZYXWVUTSRQPONMLKJIHGFEDCBA
Abstract-The purpose of this paper is to model and test the audit fee structure of local authorities in England and Wales, with particular interest in fees charged by the Big 4 and other private sector auditors. The Audit Commission, a national public body under Parliament, regulates local government audits in England and Wales. The Audit Commission sets audit standards, appoints the auditors, and establishes a formula to determine standard audit fees. Constrained by the standard audit fees, each local authority and its auditor negotiate the actual audit fees. The majority of audits are conducted by district auditors (public sector employees under the Audit Commission), although about 25% of local authorities are audited by one of six private auditors (including three of the Big 4). Regression results for financial year 2000/01 have high explanatory power and work well to explain fee differences. Model relationships are somewhat different from US counterparts (which is the context of most of the audit eco- nomics literature) and type of authority partially explains fee differences. OLS regression results indicate a Big 4 discount for local authority audits. Because of expected self-selection bias, the Heckman procedure is used to analyse the differences between private sector and public sector auditors, which indicates no selection bias for Big 4 firms, although bias is present for private firms as a whole and district auditors in some models. When fees are size-adjusted, results continue to show a Big 4 discount. The Big 4 discount was robust to other follow-up tests.
Key words: Audit fees; local government
1. Introduction
The objective of this paper is, for the first time, to model and test the audit fee structure of local au- thorities in England and Wales,' a setting in which dependence on central government may become less marked and governance more important, as one part of the greater accountability of public sec- tor organisations in the 21st century. The Audit Commission, which is a national body under Parliament and the regulator of local authority au-
dits in England and sets audit standards
for all local authorities and appoints the auditors for all local authorities. Most audits are conducted by district auditors (DAs), who are in-house audit providers of the Audit commission, operationally independent of the commission and, in particular, of the commission's regulatory functions.
The Audit Commission has the choice of auditor for all authorities and can use private sector audi-
*The authors are, respectively, at Texas A&M University and the University of Birmingham. They would like to thank Martin Evans and Mike Norman at the Audit Commission for their interest and assistance on this project; however, this paper and the views ycpressed are the sole responsibility of the authors and d o not necessarily reflect the views of the Commission. They thank Larry Johnson, Mike Wilkins, Scott Whisenant, Mike Kinney, Mary Lea McAnally, Jap Effendi, Ed Douthett, Tom Omer and two anonymous reviewers for comments on this paper, and Anup Srivastava for comments and research assistance. An earlier version of this paper was presented at the August 2003 American Accounting Association national meeting. Correspondence should be ad- dressed to Professor Rowan Jones, Birmingham Business
School, University of Birmingham, Edgbaston, Birmingham
zyxwvutsrqponmlkjihgfedcbaZYXWVUTSRQPONMLKJIHGFEDCBA
B15 2TT. E-mail: [email protected] This paper was accepted in December 2006.
tors. For the financial year 2000/01, the private audit firms included three of the Big
4
and three smaller firms that have a specialty in local author- ities. The local authority negotiates the audit fee, based in part on a standard fee schedule set by the commission.''Because of the involvement of the Audit Commission in auditor choice, self-selection bias becomes an issue. Self-selection is an agent be- haviour problem. The usual interpretation in audit- ing is that clients determine whether or not to use
~
I Northern Ireland has had a distinct form of local govern- ment and is not addressed in this paper. Local government in Scotland has similar features to local government in England and Wales, but there is a specific body for Scotland that regu- lates local government audits, which is also not addressed in this paper. Thus. our focus is with the local authorities in England and Wales, whose audits were regulated by one body, the Audit Commission.
'
The Audit Commission for Local Authorities and the National Health Service in England and Wales, while it was created by law and is answerable to Parliament, is not part of central government. Central government does appoint the members of the Commission but the officers of the commis- sion are not civil servants. The technical term in the UK for bodies such as this is 'non-departmental public body', mean- ing that while the government and Parliament have important roles to play in such bodies, the bodies are not part of any cen- tral government department. The Audit Commission does not allow charging for non-audit fees.There were four public audit agencies in the UK at the time the empirical work in this paper was carried out. In addi- tion to the Audit Commission, these were the National Audit Office, the Northern Ireland Audit Office, and Audit Scotland and the Accounts Commission for Scotland. The National Audit Office is responsible for central government audits. The remaining agencies are regional regulators of local authorities.
The standard fee is explained in Section 2.
22
zyxwvutsrqponmlkjihgfedcbaZYXWVUTSRQPONMLKJIHGFEDCBA
a Big 4 auditor. Because clients self-select the au- ditor, client observations are not randomly allocat- ed across auditor categories. The commission selects the auditor on some non-random basis (e.g. geographic reasons). In addition, private audit firms may select out of the job. Thus, self-selec- tion still exists and the result is a non-random as- signment of auditors.
A Heckman two-stage procedure is used to try to control for the consequences of self-selection. Following the model introduced by Chaney et al. (2004) for commercial audits, this paper represents the first use of the Heckman approach for govern- mental audit fee models. A separate selection equation (first stage) is used to construct a selec- tion-bias control factor, Lambda, designed to re- flect all unmeasured characteristics related to auditor choice. In the second stage, Lambda is added as an additional independent variable in the fee model. A significant Lambda indicates a self- selection bias, which can be further analysed.
The standard audit fee is set by the Audit Commission, based on the type of local authority? However, the actual financial audit fee, the amount paid directly for the financial audit, is negotiated between the auditor and the local authority. The total audit fee, which includes the fees for all other audit-related charges, is expected to be within 30% of the standard audit fee (Audit Commission, 2000). The commission recognises that fees may be outside this range under some circumstances, but seeks explanations when this occurs.
Although the economic relationships for audits of UK local authorities have not previously been tested, the audit economics literature associated with US local governments is extensive? However, the regulatory environments associated with UK
local authority audits differ from the
zyxwvutsrqponmlkjihgfedcbaZYXWVUTSRQPONMLKJIHGFEDCBA
US context,most markedly in that US cities and counties have
considerable autonomy in operations and the audit process. Consequently, audit relationships may be substantially different and our understanding of important regulatory and efficiency relationships may be incomplete. In the UK, we have now seen research (for example, Clatworthy et al., 2002; Basioudis and Ellwood, 2005) on that other area of the Audit Commission’s ambit, namely the National Health Service (NHS), but local authori- ties are fundamentally different bodies from those in the NHS because of the central role played by directly-elected local politicians in local govern- ment.
This paper focuses on: (1) actual financial audit fees and total audit fees charged for financial year
ACCOUNTING AND BUSINESS RESEARCH
2000/01, (2) the relative fee premium (or discount) by comparing the total audit fee divided by the standard audit fee, and (3) evaluating actual finan-
cial audit fees, total audit fees and fee premium (or discount) by auditor type. Actual financial audit fees are analysed because they are closely related to US audit fees. The total audit fees are examined
since they are used by the Audit Commission to evaluate actual financial audit fees to standard fees. The fee premium (or discount) is the differ- ence from the regulatory benchmark and functions as a separate test of relative fees. If local authority audits in England and Wales followed the results found in US studies, Big 4 firms would charge a higher premium than either district auditors or smaller private firms. However, univariate and multivariate results show a net fee discount for Big 4 firms.
This paper contributes to the literature in three ways. (1) A model of audit fees in local authorities in England and Wales is introduced. While this model is of interest in its own right, it has added interest given that the context of much of the audit economics literature (based in the US) is different, as is the context of the parallel work in the UK on the NHS. The environment associated with the Audit Commission is described in detail. (2) We focus on Big 4 audit fees, because a fee discount is found relative to district auditors. The fee discount holds up in most robustness checks and Big 4 pre- miums are not found in any of our models. (3) Two
particular self-selection issues are examined aris- ing from the facts that the Audit Commission se- lects the auditor and that, while district auditors must conduct audits to which they are assigned by the commission, the private sector auditors need not do so.
The remainder of the paper is divided into the following sections. The next section describes the audit process associated with local authorities in England and Wales, emphasising how the audit fee is determined. Section 3 reviews model develop- ment, specifically how to explain the audit fee structure. Section 4 describes the sample of local authorities in England and Wales used for empiri- cal analysis and describes the statistical methods used. Section 5 reviews the empirical results. Section 6 includes sensitivity checks. The last sec- tion concludes the paper.
A fuller explanation is given in Section 2 .
See, for example, Baber et al. (1987), Rubin (1988), Copley et al. (1994), Ward et al. (1994), Copley et al. (1995). Deis and Giroux (1996). Elder et al. (1999). and McLelland
2. Local authorities and audit fees
The Audit Commission database has 409 multi- function local authorities in England and Wales (at 1 April 2000), each of which is the responsibility of locally elected politicians. The law requires an external auditor to be appointed for each local au- thority and determines the auditor’s responsibili- ties and Dowers (Audit Commission Act 1998, Local
and Giroux (2000). Government Act 1999). The Audit Commission
Vol. 37 No. 1.2007
was created by law in 1983 and its members are
appointed by central government (Giroux et a1
zyxwvutsrqponmlkjihgfedcbaZYXWVUTSRQPONMLKJIHGFEDCBA
.,2002: 12- 14). The commission has the statutory role to regulate local authority audits, a role that explicitly includes setting the standards to which the auditors are required to work and monitoring and evaluating the auditors’ work against those standards. These requirements include compliance with professional auditing standards.
In addition to this regulatory role, the commis- sion appoints the external auditor to each of the 409 local authorities. There are two pools of exter- nal auditors from which the Audit Commission chooses. The first pool comprises in-house audi- tors, who are known as district auditors, and are public officials. The second pool comprises private sector auditors including, but not restricted to, the Big 4 firms. Traditionally, about 70% of the audi- tors appointed are district auditors, the balance being private sector auditors. For the financial year 2000/01, district auditors conducted 303 audits (74.1%), while the private sector audited 106 (25.9%) local authorities.
For the financial year 2000/01, the Audit Commission introduced a uniform method for set- ting audit fees for all local authorities.’ This method requires that the outputs of each audit are set by the commission and agreed with each audi- tor. The actual audit fee is determined by each au- thority and each authority’s auditor but is circumscribed by a standard fee determined by the commission. The standard fee represents the judg- ment of the commission of the expected audit costs, based on authority type and relative spend- ing levels, adjusted for cost-of-living differences. The new approach was designed ‘to encourage au- ditor innovation and efficiency improvements’ (Audit Commission, 2000:2).
Auditors conduct their work in accordance with
the requirements of the
zyxwvutsrqponmlkjihgfedcbaZYXWVUTSRQPONMLKJIHGFEDCBA
Code of AuditzyxwvutsrqponmlkjihgfedcbaZYXWVUTSRQPONMLKJIHGFEDCBA
Practice,published by the Audit Commission and approved by Parliament. Auditors must also take account of any supplementary guidance or instructions issued by the commission.
The commission requires the following outputs
23
from each financial audit:
A certificate that the audit of the accounts has been completed in accordance with statutory re- quirements;
An opinion on the financial statements (and other opinions, as required);
A statutory report on the audit of what is known as a ‘best value performance plan’ (when appro- priate);
A report dealing with matters that the auditor considers to be in the public interest (which is required by law in exceptional cases);
Oral and/or written reports or memoranda to of- ficers of the local authority and, when appropri- ate, politicians of the local authority on the results of, or matters arising from, specific as- pects of auditors’ work (when appropriate);
.
An annual audit letter addressed to the audited body.Auditors perform other audit-related procedures for additional fees, including value for money work, grant claims from central government and various statutory reports. The most common audit- related work includes:
’The new system had gradually been used for some author-
ities since
zyxwvutsrqponmlkjihgfedcbaZYXWVUTSRQPONMLKJIHGFEDCBA
1995/96 but was only applied to all in 2000/01. Under the former system, the audit fee was determined by thecommission in setting hourly rates, differentiated according to the type of local authority being audited. Total audit fees paid were, therefore, the product of actual audit hours and the rele- vant hourly rates.
‘Value for Money’ is the comprehensive term to refer both to economy and efficiency audits and to effectiveness audits. Auditors have a duty to do such work for their clients (known as ‘local value for money studies’). The Audit Commission also has the duty to carry out such work, not for each local au- thority taken separately, but for local governments as a whole (known as ‘national value for money studies’); auditors also contribute to these national value for money studies.
Programmed reviews of the financial aspects of the audited body’s corporate governance arrangements;
Programmed reviews of aspects of performance management, including the audited body’s arrangements to secure economy, efficiency and effectiveness in its use of resources, which may include national ‘value for money’ studies, follow-up work and local ‘value for money’ studies;*
The arrangements for collecting, recording and publishing performance indicators (when appli- cable);
The audit of ‘best value’ performance plans. All financial years are 1 April to 31 March, and the standard fee is set for work to be done in the period from 1 November within the financial year being audited to 31 October in the following year. Because some of this work relates to periods other than the financial year, these other periods are also detailed. In setting this scale, the commission ex- plicitly justifies the effects on audit fees paid by local authorities, fees received by the commis- sion’s own staff, fees received by private sector au- ditors, and the commission’s own finances, typically in terms of percentage changes from pre- vious years and comparisons with percentage changes in associated professional services.
The standard fee is a function of total annual gross expenditure of each local authority (but in- cludes turnover on the fund that deals with public housing and on the pension fund, when applica- ble). It is derived from the local authority’s con-
24
solidated income and expenditure account for the financial year being audited (Audit Commission, 2000). The standard fee function (STANDARD FEE) is:
STANDARD FEE =
zyxwvutsrqponmlkjihgfedcbaZYXWVUTSRQPONMLKJIHGFEDCBA
[(total annual gross expenditure
*
x%)+
&y]zyxwvutsrqponmlkjihgfedcbaZYXWVUTSRQPONMLKJIHGFEDCBA
Type of local authority
zyxwvutsrqponmlkjihgfedcbaZYXWVUTSRQPONMLKJIHGFEDCBA
X%zyxwvutsrqponmlkjihgfedcbaZYXWVUTSRQPONMLKJIHGFEDCBA
fYLondon boroughs 0.0350
zyxwvutsrqponmlkjihgfedcbaZYXWVUTSRQPONMLKJIHGFEDCBA
I10,OOOMetropolitan councils -
outside London 0.0320 95,000 County councils 0.0175 95,000 Unitary authorities 0.0410 95,000 District councils 0.0875 35,000
To take a specific example, the city of Birmingham, which is the biggest authority in our sample, had total annual gross expenditures of &1,786.1m for 2000/01. Birmingham is a metro- politan council; therefore, the calculation of STANDARD FEE is: [(&1,786.1m x 0.00032)
+
&95,000] = &666,552. TOTAL FEE for Birmingham was &632,000 (BASE FEE of E573,OOO+
E59,OOO in audit-related fees), or E34,552 below the standard fee. Birmingham was audited by a district auditor. Each local authority is expected to set its audit fee within +/- 30% of the relevant STANDARD FEE. In other words, the total audit fees charged to the local authority can vary from 70% to 130% of STANDARD FEE (with adjustments for specified areas). Auditors can charge an additional 6.5% of total fees in ‘specified areas’ based on higher perceived costs. These specified areas are in the south-east of England, where the cost of living is higher?ACCOUNTING AND BUSINESS RESEARCH
thority negotiated an actual fee lower than the standard fee. FEE PREM should be within 30% of the standard fee. The Audit Commission investi- gates exceptions, which often can be justified by the particular local authority but which also can in- fluence the local authority in setting future audit fees.
Both univariate and multivariate tests will be used to analyse FEE, TOTAL FEE, and FEE PREM. BASE FEE and TOTAL FEE are logged for corre- lation and multivariate analysis, due to skewness.
These three measures of audit fees are used be- cause of the different perspective of the England and Wales local governmental audit market from
that in the
zyxwvutsrqponmlkjihgfedcbaZYXWVUTSRQPONMLKJIHGFEDCBA
US. BASE FEE seems roughly consis-tent with audit fee calculations of US studies. However, the TOTAL FEE construct is relatively more important according to the Audit Commission. This measure captured all audit-related charges and this is the measure the commission uses to compare to standard fees.
3. Model development
The purpose of this paper is to evaluate the finan- cial audit fees (BASE FEE) of local authorities in England and Wales, TOTAL FEE, and the relative fee premium or discount (FEE PREM), measured as TOTAL FEE / STANDARD FEE. TOTAL FEE includes all audit-related fees charged by the audi- tor. BASE FEE is associated with the six required financial audit outputs previously listed. TOTAL FEE includes the six required outputs plus addi- tional sanctioned procedures such as ‘value for money’ (also previously listed). If TOTAL FEE is equal to the standard fee, FEE PREM=I. If the local authority pays a premium over the standard fee, FEE PREM>I; FEE PREM<I if the local au-
’
The ‘specified areas’. for which there is the 6.58 premium, are local authorities within the counties of Kent, Surrey, Sussex, Hampshire, Isle of Wight, Berkshire, Oxfordshire, Buckinghamshire, Bedfordshire, Hertfordshire, Cambridgeshire and Essex.“’
This insight is provided by staff members of the AuditCommission.
zyxwvutsrqponmlkjihgfedcbaZYXWVUTSRQPONMLKJIHGFEDCBA
3.1. Fee model
zyxwvutsrqponmlkjihgfedcbaZYXWVUTSRQPONMLKJIHGFEDCBA
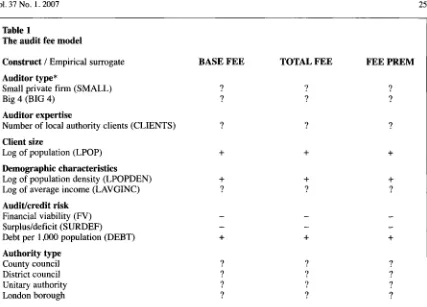
constructs Six constructs are used to capture audit fee char-acteristics: (1) auditor type, (2) auditor expertise, (3) client size, (4) measures of client complexity, including demographic characteristics, ( 5 ) audit risk factors and (6) local authority type. These are discussed below, along with the empirical surro- gates used for analysis. The model is summarised in Table 1.
Of particular interest is the auditor category: dis- trict auditor (DA), one of the Big 4 accounting firms (BIG 4), or a non-Big 4 private firm with a local governmental specialty (SMALL). Dummy variables are used to identify BIG 4 and SMALL. The remaining variables serve as control measures. In many US audit fee studies of commercial clients, a premium for a Big 4 auditor was found, usually associated with the reputation effect (e.g. Copley et al., 1995). As summarised by Ireland and Lennox (2002), Big N (Big 8 down to Big 4, depending on the time of the studies) fee premi- ums were found in Australia, New Zealand, UK, Hong Kong, Singapore and India. However, no fee premiums were found in Malaysia, Norway, the Netherlands and South Africa.
Limited literature also suggests that private sec- tor auditors (Big 4 and smaller firms) charge high- er fees for local governmental audits (e.g. Rubin 1992). However, in the England and Wales local government context, it has been suggested that there is a district auditor premium. This reflects the fact that DA is motivated by gross turnover, whereas the firms are motivated by profit. That is, DAs are likely to perform more audited-related procedures than BIG 4 or SMALL. So an audited body that has a DA as its auditor pays a marginal- ly higher fee but gets more work for it.“’ Basioudis
Vol. 37
zyxwvutsrqponmlkjihgfedcbaZYXWVUTSRQPONMLKJIHGFEDCBA
No. 1.2007 25 Table 1The audit fee model
Construct
zyxwvutsrqponmlkjihgfedcbaZYXWVUTSRQPONMLKJIHGFEDCBA
/ Empirical surrogate BASE FEE TOTAL FEE FEE PREM Auditor type*Small private firm (SMALL)
Big 4 (BIG 4)
? ? Auditor expertise
Number of local authority clients (CLIENTS) ? Client size
Log of population (LPOP)
Demographic characteristics
Log of population density (LPOPDEN)
Log of average income (LAVGINC)
AudWcredit risk
Financial viability (FV) Surplus/deficit (SURDEF)
Debt per 1,000 population (DEBT)
Authority type
County council District council Unitary authority London borough
? ?
? ? ? ?
+
+
+
zyxwvutsrqponmlkjihgfedcbaZYXWVUTSRQPONMLKJIHGFEDCBA
t
?
+
?
+
?
zyxwvutsrqponmlkjihgfedcbaZYXWVUTSRQPONMLKJIHGFEDCBA
*Note: There are three audit types: district auditor (DA), one of the Big 4 accounting firms (BIG 4), or a non-
Big 4 private firm with a local governmental specialty (SMALL). Dummy variables are used to identify BIG
4 and SMALL (relative to DA).
and Ellwood (2005) tested the audit fee structure of 369 NHS trusts. They predicted a fee premium for Big 4 firms. Regression models indicated sig- nificant Big 4 fee premiums; however, when indi-
vidual firms were tested only one
zyxwvutsrqponmlkjihgfedcbaZYXWVUTSRQPONMLKJIHGFEDCBA
firm
recorded asignificant premium. No Big 4 premium existed when total fees (including non-audit fees) was the dependent variable. Clatworthy et al. (2002) also tested audit fees for National Health Service trusts. Neither Big 6 nor mid-tier private firms were sig- nificant. Consequently, there is evidence from a similar audit market to conclude that a Big 4 pre- mium is not likely.
Following Mayhew and Wilkins (2003), the number of authority clients (CLIENTS) is used as a measure of industry market share. Deis and Giroux (1996) use the number of local govern- mental clients as a measure of reputation. Mayhew and Wilkins (2003) view auditor specialisation as measured by market share as a differentiation strategy, providing economies of scale and indus- try-specific expertise. Higher audit quality, higher client satisfaction and lower audit costs are ex- pected with this differentiation strategy. Mayhew and Wilkins (2003) found a fee premium when specific auditors dominate market share, but a rel- ative fee discount for audit industry specialisation but not domination. The auditor can (1) pass on the
lower costs due to economies of scale through lower pricing or (2) retain the cost savings and charge a premium price. Therefore, no sign is pre- dicted.
Client size should be associated with audit com- plexity. Population is used to capture relative size. The log of population (LPOP) is used in the multi- variate analysis to control for skewness. Following Bamber et al. (1993) and McLelland and Giroux (2000), a positive sign is expected.
Two demographic measures of client complexi- ty are population density and average income. Population density (POPDEN) is used to capture relative ‘urbanness’ and financial complexity. The Gonzales and Mehay (1985) model used popula- tion density to control for economies of density, as public spending may relate to land area rather than population size (Giroux and Shields, 1993). Most of the major urban areas have only one local au- thority; most of the rural areas have two (a county council plus one other geographically smaller local authority) so that the public services provid- ed are divided between the two. Therefore, most local authorities in major urban areas provide more services than local authorities do in rural areas. Also, certain public services are associated with urban areas, such as transport. A positive coeffi- cient is predicted. Average income (AVGINC) cap-
[image:6.540.57.484.73.380.2]2 6
zyxwvutsrqponmlkjihgfedcbaZYXWVUTSRQPONMLKJIHGFEDCBA
tures the relative wealth of a local authority. Income levels are usually associated with greater financial health in US studies (e.g. Deis and Giroux, 1996). However, only limited revenues are generated from the local property tax base for au- thorities in England and Wales. Most revenues come from central government and these public monies tend to be ‘dependence-based’, that is, rel- atively more funding is given to poorer authorities. No sign is predicted for AVGINC. The logs of pop- ulation density (LPOPDEN) and average income (LAVGINC) are used for multivariate analysis to control for skewness.
The audit firms may focus on audit and credit risk to determine fees, a possible factor for audit pricing differences. However, risk measures may differ from US counterparts because of institution- al and other differences. Two variables are used as potential empirical surrogates for audit risk in this environment: financial viability (FV) (Giroux and McLelland, 2003) and surplus/deficit (SURDEF) (McLelland and Giroux, 2000). Debt per capita (DEBT) is used to proxy for credit risk (Baber et al., 1987; Ward et al., 1994; Copley et al., 1995).
Financial viability is defined as general fund bal-
ance
zyxwvutsrqponmlkjihgfedcbaZYXWVUTSRQPONMLKJIHGFEDCBA
/ net revenue expenditures and is used as an indicator of relative equity. A low measure can sig-nal fiscal stress, increasing audit risk. A negative sign is expected. On average, authorities have a net equity position (FV) of 0.3% of net revenue ex- penditures (CIPFA, 200 1). Surplus/deficit (SUR- DEF) is the general fund surplus or deficit, stated
in pounds
zyxwvutsrqponmlkjihgfedcbaZYXWVUTSRQPONMLKJIHGFEDCBA
(f). Running a deficit should indicate in- creasing financial risk. However, only 91 authori-ties (22.2%) had a surplus in 2001 (CIPFA, 2001). A negative sign is predicted; however, since au- thorities can budget for a deficit only if a positive fund balance exists to cover the deficit, this vari- able may be less important than FV.
Debt levels are measured as the total borrowing of the authorities including bank overdrafts. DEBT is scaled by population per thousand. The most common debt variable measured in US studies is municipal debt. Since the interest is ‘tax-free’ to lenders, the interest rates are lower to municipal borrowers and debt levels tend to be relatively large. There is no ‘tax benefit’ to local authorities in England and Wales. Most debt comes from bank lending and borrowing from the Public Works Loan Board, a central government agency. Despite the institutional differences, the interpretation is the same. Higher debt levels are associated with greater credit risk and a positive sign is expected.
Local authorities are multi-function entities ad- ministered by politicians elected locally, with lim- ited power to tax and borrow. There are five categories of authorities in this analysis: county councils, district councils, London boroughs, unitary authorities, and metropolitan councils.
ACCOUNTING AND BUSINESS RESEARCH
Because each category has unique characteristics, dummy variables are used to capture locally-spe- cific information. In 1974 there was a major reor- ganisation of local authorities and piecemeal changes since then.
London boroughs and metropolitan councils are located in major urban areas, each providing all the major services associated with local authorities in England and Wales. Each unitary authority also provides all major services. While every unitary authority may not necessarily be in a major urban area, each will have a significant town at its heart. London boroughs, metropolitan councils and uni- tary authorities tend to have larger populations and higher population densities.
County councils and district councils conduct the major local authority services for a given geo- graphical area. Within any given county area, there will be one county council and many contiguous district councils. The county council will typically provide services such as education for the whole area (and therefore across the jurisdictions of many district councils), while services such as re- fuse collection are provided separately by each district council. County councils are often rural and usually have low population densities; district councils usually have smaller populations, but
population densities can vary.
zyxwvutsrqponmlkjihgfedcbaZYXWVUTSRQPONMLKJIHGFEDCBA
3.2. Robustness checksSelf-selection bias is a major concern associated with audit fee models, especially when Big 4 audi- tors are present. Selection bias ‘refers to the bias in the estimates obtained by following the usual pro- cedures of estimation that ignore the non-random- ness of the samples’ (Maddala, 1991: 797). A Big 4 audit fee premium is a typical empirical finding and associated with a brand name auditor provid- ing a higher quality audit (DeAngelo, 1981; Copley et al., 1995). Each client determines whether or not to use a Big 4 auditor, resulting in a self-selection problem. As stated by Chaney et al. (2004: 53): ‘[Ilt is probable that firms self-select into Big 5 and non-Big 5 auditees based on firm characteristics, private information, and other un- observable characteristics.’ OLS models not cor- recting for self-selection produce biased and inconsistent coefficients. The error term in the OLS model will be systematically associated with type of auditor. The Heckman procedure is used to correct for self-selection.
James Heckman introduced his correction for self-selection bias in the 1970s to deal with indi- vidual decisions about labour-force participation and hours worked (e.g. Heckman, 1979 or Heckman and Smith, 1995). It has been used in ac- counting and recently in the audit fee literature to control for selection of Big N firms. Ireland and Lennox (2002) tested UK audit fees, using
Vol.
zyxwvutsrqponmlkjihgfedcbaZYXWVUTSRQPONMLKJIHGFEDCBA
37 No.zyxwvutsrqponmlkjihgfedcbaZYXWVUTSRQPONMLKJIHGFEDCBA
I. 2007 27geographic reasons. This is the first potential bias. The private audit firms may select out of the audit job, also resulting in a non-random assignment of auditors.
It is not clear that a fee premium or discount is expected for Big 4 auditors of local authorities. However, certain Big 4 characteristics are expect- ed. Big 4 firms base their product differentiation strategies on personnel training. key technological advantages, and other efficiency-related character- istics (Mayhew and Wilkins, 2003). Following Chaney et al. (2004), it is hypothesised that Big 4 firms have higher fixed costs related to technology and other efficiencies, but potentially lower vari- able costs. Chaney et al. (2004) expect that this should result in a larger intercept for Big 4 firms. while the slope coefficient should be smaller.
Client size is the primary driver for audit fees. Consequently, a size variable is included as an in- dependent variable to control for size; we use local authority population in this case. Despite this vari- able. size may still be a biasing factor in the model. For example. in most audit fee studies Big 4 audi- tors are associated with larger clients. That is true in this case. The average authority size for BIG 4 is 25 1,245. compared to 180.954 for district audi- tors and 136,544 for small firms.
Because of the systematic differences in size, the error term will be directly related to size of the clients. which violates the OLS a
moskedasticity. To correct for t
other set of regressions was run with fees scaled by population. which provides more reliable t-statis- tics. The remaining independent variables are the same. An alternative test uses rank transformations for fees and population.
Heckman to compare Big 5 to non-Big 5 firms. A selection bias was discovered based on a signifi- cant inverse Mills ratio (Lambda), which translated into a Big 5 audit fee premium of 53.4% (com- pared to 19.2% without measuring selection bias). Copley and Douthett (2002) used Heckman's si- multaneous equation two-step estimation to analyse auditor choice (including audit fees) asso-
ciated with
zyxwvutsrqponmlkjihgfedcbaZYXWVUTSRQPONMLKJIHGFEDCBA
US initial public offerings. Client firmsinitiating IPOs were more likely to select a Big N auditor if they had higher risk characteristics. Chaney et al. (2004) found a Big 5 audit premium on a sample of UK private firms. They found both intercept and slope coefficients significant, indi- cating that Big 5 firms have different fee structures than non-Big 5 firms. McMeeking et al. (2006) looked at why Big N firms earned a fee premium for big U K firms, over a long time period (1985-2002). They used Heckman's as part of their sen si t i v it y anal y s i s , w h ic h indicated that 1 arg- er firms with more overseas subsidiaries or more non-audit services were more likely to hire Big N firms. Lambda was significant only for large client firms. Omer et al. (2006) considered auditor-pro- vided tax services for 2002-2003, using an abnor- mal audit fee more to determine unexpected audit fees. Disclosure of tax fees was voluntary and Heckman's was used to control for the voluntary nature of tax fee disclosure (i.e.. disclosure of tax fee was self-selected in this time period). The ex-
tant literature using Heckman's indicates
zyxwvutsrqponmlkjihgfedcbaZYXWVUTSRQPONMLKJIHGFEDCBA
a Big N fee premium larger than expected based on OLSregression. However, our analysis focuses on a
unique environment and a different self-selection bias.
The auditor selection process for U K local au- thorities is different relative to the extant US liter- ature, with the Audit Commission making the final auditor choices. Self-selection is still an econo- metric problem but is based on unobserved char- acteristics of the Audit Commission and potential auditors. A key point is that the private auditors
can decline audits, while district auditors cannot An objective of the Audit Commission is to have three potential auditors for each authority: i.e.. the regional district auditor's office and two private firms (Audit Commission, undated). Consequently. the selection incentives differ from other environ- ments.
Since the Audit Commission assigns the auditor. there are two possible biases. Whether the coni- mission picks a DA presumably depends on vari- ous factors. but it may select Big 4 and other private auditors on a non-random basis. such as for
I ' This w i i p l e of 400 ;ititlioritielr includes the Corporation o f London. which is a busincss district olf'icially liatcd w i t h ;I
population of ii few thou\itnd. This obscrvation was dropped
from the empirical analysis.
4. Sample and method
The sample is based on the data files of the Audit Commission, which includes 409 multi-function local authorities." Information on audit fees and related data comes from the commission files. Financial information on the local authorities comes from the Chartered Institute of Public Finance and Accountancy (CIPFA. 2001 ). Income data is taken from Inland Revenue Statistics (Reade, 2000).
The initial testing of the audit fee models uses OLS regression. The dependent variables are ( 1 )
FEE. (2) TOTAL FEE and (3) FEE PREM. The major independent var i a b I es are dummy vari a b I es for SMALL and BIG 4. to discern if these are sig- nificantly different from fees charged by the dis- trict auditors. Diagnostic tests include tests for normality of residuals. extreme values. multicolin- earity and honioskedasticity. Extreme values were detected in various models and deleted from the sample for multivariable analysis. Extensive heteroskedasticity was discovered and White's
28
correction was used to restate t-values in the re- gression models.
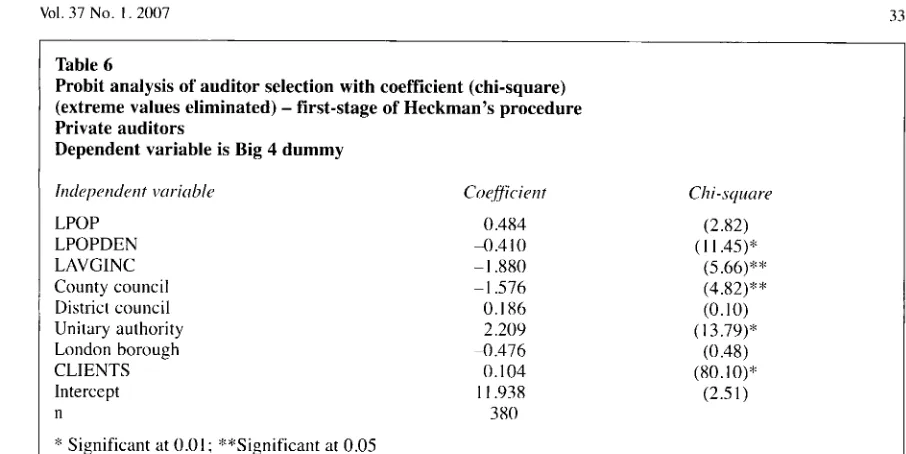
To correct for self-selection bias, the Heckman (1979) two-stage procedure is used for the TOTAL FEE model. In the first stage, a probit model is used as an auditor choice model, using the dummy variable BIG 4.'* The independent variables proxy for client attributes associated with the selection process. The variables are: LPOP, LPOPDEN, LAVGINC, county council, district council, uni- tary authority, London borough, and CLIENTS. First stage results are presented in Table 6. The predicted values from the probit models are trans- formed into the inverse Mills Ratios (Lambdas), probability functions of the selection decision. Lambda is the self-selection variable used in stage two.
The second stage is OLS regression, split by BIG 4/district auditor (and private/district auditor), with and without Lambda. With the exception of Lambda, the model is the same as described above. The coefficients for the Lambdas are the estimates from the residuals of the auditor choice models. (See Chaney et a]., 2004: 54-58 for a more de- tailed discussion of the Heckman two-stage proce- dure.) Second stage results are summarised for the BIG 4 model using TOTAL FEE.
OLS results were rerun where the dependent
variables were
zyxwvutsrqponmlkjihgfedcbaZYXWVUTSRQPONMLKJIHGFEDCBA
( 1 ) log of FEE per 1,000 populationand (2) log of TOTAL FEE per 1,000 population. Interestingly, there were no diagnostic problems with these models.
ACCOUNTING AND BUSINESS RESEARCH
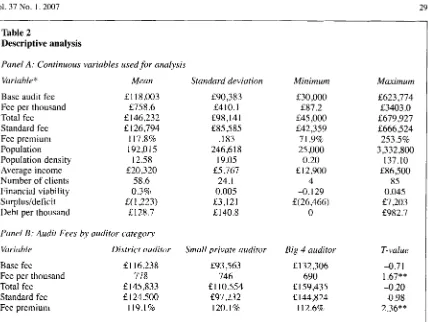
than standard, although all were above the 70% expected minimum. The remaining 357 authorities (87.5%) charged a premium, with 89 (21.8%) above the 130% expected maximum. Fourteen of these extreme premium firms had fees above 150%; that is, over 50% above the standard fees. The commission investigates the authorities pay- ing more than the 30% premium. The most com- mon explanations for higher fees were (1) high audit risk and/or (2) the statistical calculations on which the standard fees were based were inappro- priate. In most cases, the commission was satisfied with the explanation. For example, Watford District Council had the highest fee premium at 153.5% above the standard fee. The explanation was that this was a high-risk audit and a disclaimer audit opinion issued, which was accepted by the
Audit Commission. Also, 25.1
zyxwvutsrqponmlkjihgfedcbaZYXWVUTSRQPONMLKJIHGFEDCBA
%zyxwvutsrqponmlkjihgfedcbaZYXWVUTSRQPONMLKJIHGFEDCBA
of Watford's totalfees was for other audit services, above the 19.2% average for the sample. Watford was one of the ex- treme values deleted from the regression analysis. Population averaged 192,000, with a substantial range of 25,000 to 3.3 million. Mean population density was 12.6 persons per hectare, again with a substantial range (0.2-137.1). Because of the skewness of these two variables, they were logged for the multivariate analysis.
Financial viability (FV) measures the relative equity position to spending (fund balance to total expenditures). A higher FV suggests lower audit risk. On average, FV was slightly positive (0.3%), but ranged from a negative 12.9% to 4.5%. The av- erage authority has a small deficit of 21 ,223, but with a substantial range of 226,466 deficit to 27,203 surplus. Deficits were found in 287 (70.2%). This is a potential indicator of audit risk for the majori- ty of authorities.
Panel B of Table 2 describes fee data by auditor category. Big 4 audits were more expensive on av- erage at 2132,306, almost 15% above the average district duditor fee. However, the average fee per 1,000 was the lowest for the Big 4 at &690 per 1,000 population. Both standard fees and total fees had the same relationships by auditor type. The av- erage fee premium was the lowest for BIG 4 audits at 112.6% (that is, the Big 4 audit premium was 12.6% above standard fees on average). The aver- age fee premium for DA was 119.1% (19.1% above standard). A t-test was run (Satterthwaite
method for unequal variances) comparing DA with private sector auditors. District audit fees were sig- nificantly higher only for fee per thousand and fee premi um .
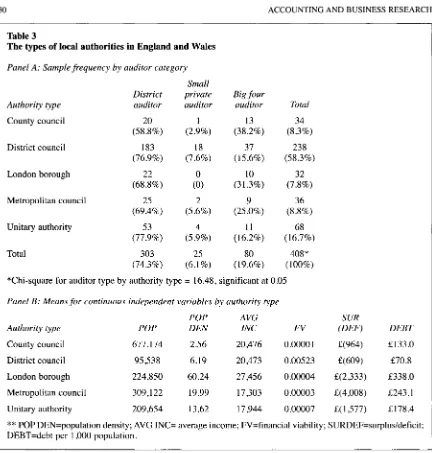
Local authorities are analysed in Table 3, cross- classified by auditor category in Panel A and by means for the continuous independent variables in Panel B. The majority of the local authorities are district councils (58.3%), but these also have the
smallest populations, averaging less than 100,000.
zyxwvutsrqponmlkjihgfedcbaZYXWVUTSRQPONMLKJIHGFEDCBA
5 .
Results
zyxwvutsrqponmlkjihgfedcbaZYXWVUTSRQPONMLKJIHGFEDCBA
5.1. Univariate analysisTable 2 summarises means and distribution char- acteristics (standard deviation, minimum and max- imum) of the variables of interest. Base audit fee averaged 21 18,000, or 2759 per 1,000 population. The total fee (which included non-recurring charges for statutory reports, fees for best value plans, and audits of grant claims from the central government) was 2146,232 or about 24% above the base audit fee. The average standard fee set by the Audit Commission was 2126,794, 17.8% below the total fee, on average. The relative dis- counted or premium fee ranged from 71.9% to 253.5% (with 100% meaning total fee was identi- cal to the standard fee).
Fifty-one authorities ( 1 2.5%) charged fees less
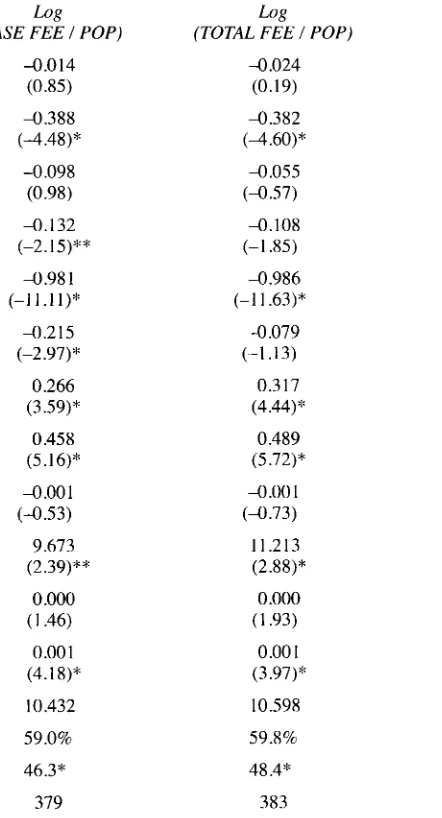
"Two models are run. The first comparison is Big 4 to dis- trict auditors and the second, private to district auditors. In the first model, SMALL firms are deleted. However, an important consideration is the distinction of district auditors to all private firms. Consequently, this second approach also is used. Heckman also was run for the BASE FEE and FEE PREM models. However, no independent variables were significant including Lambda in the FEE PREM model. Only the TOTAL FEE using BIG 4 is tabulated.
Vol.
zyxwvutsrqponmlkjihgfedcbaZYXWVUTSRQPONMLKJIHGFEDCBA
37 No.zyxwvutsrqponmlkjihgfedcbaZYXWVUTSRQPONMLKJIHGFEDCBA
1. 2007zyxwvutsrqponmlkjihgfedcbaZYXWVUTSRQPONMLKJIHGFEDCBA
29 Table 2Descriptive analysis
zyxwvutsrqponmlkjihgfedcbaZYXWVUTSRQPONMLKJIHGFEDCBA
Panel A: Continuous variables used f o r analysis
Variable* Mean Standard deviation
Base audit fee Fee per thousand Total fee Standard fee Fee premium Population Population density Average income Number of clients Financial viability Surplus/deficit Debt per thousand
E118,003 E758.6 f 146,232 f 126,794 117.8% 192,O 15 12.58 E20,320
58.6
0.3%
zyxwvutsrqponmlkjihgfedcbaZYXWVUTSRQPONMLKJIHGFEDCBA
E(
1,223) E128.7&90,383 E410.1 E98,141 &85,585
,183 246,618
19.05 E5,767 24.1 0.005 f3,121 E140.8
Panel
zyxwvutsrqponmlkjihgfedcbaZYXWVUTSRQPONMLKJIHGFEDCBA
B : Audit Fees by auditor categoryWiriable District auditor Small private auditor
Base fee & I 16,238 &93,563 Fee per thousand 778 746 Total fee .f 145,833 E l 10.554 Standard fee
E
124,500 E97,232 Fee premium 119.1% 120.1%Minimum
f30,OOO f87.2 E45,OOO E42,359
7 1.9% 25,000 0.20 &12,900
4
-0.129
E(
26,466)0
zyxwvutsrqponmlkjihgfedcbaZYXWVUTSRQPONMLKJIHGFEDCBA
Big 4 auditor
E132,306 690 f 159,435 &144,824
112.6%
Maximum
&623,774 53403 .O
&679,927 f666,524
253.5% 3,332,800
137.10 &86,500
85 0.045 &7,203 f982.7
T-value
4 . 7 1
zyxwvutsrqponmlkjihgfedcbaZYXWVUTSRQPONMLKJIHGFEDCBA
1.67** 4 . 2 0 -0.98 2.36**
*
Actual audit fee, fee per 1,000 population, total fee, standard fee, and average income are stated inE,
popu- lation density is persons per hectare, number of clients is number of authority audit clients by auditor, finan- cial viability is the ratio of general fund balance to total expenditures, surplus/deficit is general fund revenues minus expenditures stated in f , and debt per capita is total debt per 1,000 population stated inE.
**
Significant at 0.05 (t-test using the Satterthwaithe method, comparing district auditors to private auditors).There are only 34 county councils (8.3%), but
these have the largest populations on average. Big
zyxwvutsrqponmlkjihgfedcbaZYXWVUTSRQPONMLKJIHGFEDCBA
4
firms audited a much larger percentage of coun- ty councils (38%), London boroughs (31%), and metropolitan councils (25%). These categories tend to have larger and wealthier populations.Population density varied from 2.6 for county councils to 60.2 for London boroughs. Only dis- trict councils reported relatively large financial vi- ability, at 0.5% of net revenue expenditures. All authority types reported an average general fund deficit, over &4,000 at Metropolitan Councils. DEBT also varied by category, from &7 1 at to &338 at London Boroughs.
Table 4 presents a Pearson's correlation matrix for the variables in the regression models. As ex- pected, BASE FEE and TOTAL FEE are both sig- nificantly correlated with POP and POPDEN, but FEE PREM is negatively correlated with POP. Smaller authorities tend to pay larger fee premium percentages. Neither SMALL nor BIG 4 is corre- lated with BASE FEE or TOTAL FEE, although BIG 4 is negatively correlated with FEE PREM.
All authority types are correlated (either positively or negatively) with both BASE FEE and TOTAL
FEE. Both BASE FEE and TOTAL FEE are posi- tively correlated with CLIENTS and DEBT and negatively correlated with financial viability and surpluddeficit. FEE PREM is correlated (either positively or negatively) with two of the authority types. FEE PREM also is positively correlated with financial viability and surplus/deficit. Generally, the correlation results were similar be- tween BASE FEE and TOTAL FEE, but quite dif- ferent for FEE PREM." Across the independent variables, there are some significant correlations; however, variance inflation factors used in the re- gression models are all below 10, a common rule of thumb to indicate no multicollinearity problems (Gujarati, 1995).
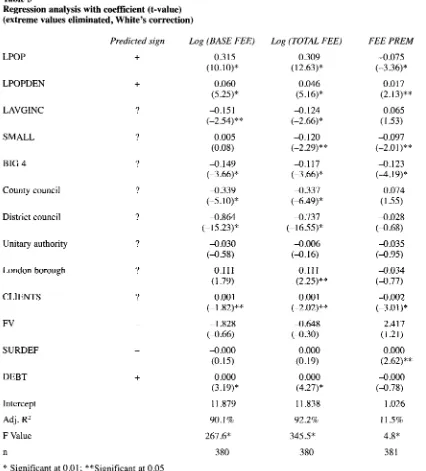
5.2. OLS regression analysis
Regression results are summarised in Table 5 .
Separate OLS results are presented for BASE FEE, TOTAL FEE and FEE PREM. Observations
l 3 Since STANDARD FEE is a linear function of total ex-
penditures, it is likely that actual audit fees are relatively lower as size increases. That is, audit fees are not expected to rise as fast as total expenditures. The result is consistent with oppo- site signs for FEE PREM.
[image:10.540.61.489.73.395.2]30 ACCOUNTING AND BUSINESS RESEARCH
zyxwvutsrqponmlkjihgfedcbaZYXWVUTSRQPONMLKJIHGFEDCBA
Table 3
The types of local authorities in England and Wales
zyxwvutsrqponmlkjihgfedcbaZYXWVUTSRQPONMLKJIHGFEDCBA
Panel A: Sample frequency by auditor category District Authority type auditor (58.8%)
(76.9%) (68.8%) (69.4%) (77.9%) (74.3%)
County council 20
District council 183
London borough 22
Metropolitan council 25
Unitary authority 53
Total 303
Small private
auditor
zyxwvutsrqponmlkjihgfedcbaZYXWVUTSRQPONMLKJIHGFEDCBA
1
(2.9%) 18 (7.6%)
0 (0)
2 (5.6%)
4 (5.9%)
25 (6.1%)
Big four auditor
13 (38.2%)
37 (15.6%)
10 (31.3%)
9 (25.0%)
1 1
(16.2%) 80 (19.6%)
Total
34 (8.3%)
238 (58.3%)
32 (7.8%)
36 (8.8%)
68 (16.7%)
408*
zyxwvutsrqponmlkjihgfedcbaZYXWVUTSRQPONMLKJIHGFEDCBA
( 100%)
*Chi-square for auditor type by authority type = 16.48, significant at 0.05
Panel B: Means for continuous independent variables by authority type POP AVG
Authority type POP DEN INC FV
County council 677,174 2.56 20,476 0 .OOOO 1
District council 95,538 6.19 20,473 0.00523
London borough 224,850 60.24 27,456 0.00004
Metropolitan council 309,122 19.99 17,303 0.00003
Unitary authority 209,654 13.62 17,944 0.00007
SUR
( D W DEBT
E(964) E133.0 f(609) 570.8 &(2,333) f338.0 &(4,008) f243.1 &( 1,577) E178.4
**
POP DEN=population density; AVG INC= average income; FV=financial viability; SURDEF=surplus/deficit; DEBT=debt per 1,000 population.were lost from the full sample due to missing data and extreme values which were deleted. The final sample sizes were 380 for BASE FEE and TOTAL FEE, and 381 for FEE PREM. Regression diag- nostics included variance inflation factors to test for multicollinearity, studentised residuals to test
for extreme values, and the Glejser test for het-
zyxwvutsrqponmlkjihgfedcbaZYXWVUTSRQPONMLKJIHGFEDCBA
l4 It may be that the close relationship between district au-
ditors and the commission has an effect on audit fees. The ar- gument is that DAs have an incentive to charge higher fees, since the Audit Commission benefits financially from the fees charged. The commission states that a fee premium exists for district auditors, because they perform additional duties be- yond the private audit firms. As stated by an Audit Commission executive: ‘It is perhaps not surprising that the “brand name” of the Big 4 does not attract a price premium, as the audited bodies are not purchasing the brand! It is the commission that buys the brand, and appoints the auditor.’ However, Basioudis and Ellwood (2005) found a BIG 4 pre- mium for NHS entities, where auditors also are selected by the Audit Commission.
eroskedasticity. Extreme values were detected and eliminated and White’s correction run because of detected heteroskedasticy. All variance inflation factors except district council were below five, suggesting no multicollinearity problems. district council consistently had VIFs about 6.5, moder- ately problematic but not a variable that could be eliminated or transformed.
The BASE FEE model is significant, with an ad- justed R2 of 90.1 %. LPOP and LPOPDEN are pos- itive and significant as expected, while LAVGINC is negative and significant. The negative sign can be interpreted as an indicator of increased audit risk to local authorities as income levels rise. BIG 4 is negative and significant. Similar to the uni- variate findings, BIG 4 audits are associated with lower audit fees, when compared with district au- ditors. In most comparable settings ‘brand name’ audits typically have a higher price (Rubin 1988).14 SMALL firm audit fees, on the other
Table 4
Correlation matrix (Pearson's)
zyxwvutsrqponmlkjihgfedcbaZYXWVUTSRQPONMLKJIHGFEDCBA
TOTAL FEE FEEPREM POP POPDEN AVGINC SMALL BIG 4 DA County council District council Unitary authority London borough CLIENTS FV SURDEF DEBT County council District council Unitary authority London borough CLIENTS FV SURDEF
DEBT
zyxwvutsrqponmlkjihgfedcbaZYXWVUTSRQPONMLKJIHGFEDCBA
BASE FEE 98.6* 0.1 74.0* 53.7* 4 . 1 -3 .O
7.5 -5.2 27.4* -90.2* 39.1" 41.1* -12.5** -54.1*
-26.0"
zyxwvutsrqponmlkjihgfedcbaZYXWVUTSRQPONMLKJIHGFEDCBA
55.5"
DA
-1 0.6** 7.1 3.8 -3.7 75.1" 4.2 4.5 -2.3 TOTAL
FEE
zyxwvutsrqponmlkjihgfedcbaZYXWVUTSRQPONMLKJIHGFEDCBA
- 0
.o
74.6* 54.7* 4 . 1 -7.77.7 -2.8 26.0" -9 1 .O*
39.9" 42.8" -9.9** -54.1" -26.6* 56.1" County council - NM NM NM 0.6 -20
.o*
2.6 1.2 FEE PREM - -25.3* 4 . 7 6.5 -0.3 -15.0* 11.9** -10.9** 20.2" -9.6 -1.5 1.7 14.0* 18.3* -5.4 District council - NM NM 14.2* 52.6* 24.3* -50.4* POP - 32.5* 6.7 -4.8 16.2* -12.1** 64.0" -70.1* 8 .O 19.0* -5.9
4 7 . 5 *
-21.3" 29.0* Unitary authority - NM -18.8* -25.6* 4 . 5 14.3*
POP DEN
-
14.5* 1
.o
10.7** -10.3** -18.4* -39.6* 9.1 49.4* -1.6 -29.3 * -27 .O*42.1 London borough - 3.3 -19.2* -10.6** 45 .O* AVG INC - 13.2* 12.2** -18.3* 3.2 7.5 -22.6* 34.9* -2.8 12.9** -1.2 7.5 CLIENTS - 10.6** 0.4 -9.4 SMALL - NM NM
-4 .O
7.1 -0.4 -7.5 -52.0* 0.1 4.2 1.2 FV - 12.9** -30.6*
BIG
zyxwvutsrqponmlkjihgfedcbaZYXWVUTSRQPONMLKJIHGFEDCBA
4- NM 14.1* -12.1** -3.9 8.6** -5 1.3*
4 . 6 -7.5
1.8
SURDEF
- -19.9*
(logs used for FEE, TOTFEE, FEE PREM, POP, POPDEN and AVGINC; NM = not meaningful)
* Significant at 0.01;
**
Significant at 0.05**
FEE PREM=audit fee premium; POP=population; POP DEN=population density; AVGINC=average income; SMALL=non-Big 4 private audit firm; BIG 4=Big 4 [image:12.540.88.765.69.422.2]32
zyxwvutsrqponmlkjihgfedcbaZYXWVUTSRQPONMLKJIHGFEDCBA
ACCOUNTING AND BUSINESS RESEARCHTable 5
Regression analysis with coefficient (t-value) (extreme values eliminated, White's correction)
Predicted
zyxwvutsrqponmlkjihgfedcbaZYXWVUTSRQPONMLKJIHGFEDCBA
signzyxwvutsrqponmlkjihgfedcbaZYXWVUTSRQPONMLKJIHGFEDCBA
LPOP
zyxwvutsrqponmlkjihgfedcbaZYXWVUTSRQPONMLKJIHGFEDCBA
+
LPOPDEN+
LAVGINC ?
SMALL ?
BIG 4 ?
County council ?
District council ?
Unitary authority ?
London borough ?
CLIENTS ?
FV -
SURDEF -
DEBT
+
InterceptAdj. R2
F Value n
*
Significant at 0.01; ""Significant at 0.05zyxwvutsrqponmlkjihgfedcbaZYXWVUTSRQPONMLKJIHGFEDCBA
Log (BASE FEE)
[image:13.540.60.486.108.579.2]0.315
(10.10)*
0.060 (5.25)* 4 . 1 5 1 (-2.54)""
0.005
(0.08) 4 . 1 4 9 (-3.66)" 4 . 3 3 9 (-5.1 O)* 4 . 8 6 4 (-15.23)* 4 . 0 3 0 (4.58)
0.111 (1.79)
4
.oo
1(-1.82)** (4.66)
4 . 0 0 0 (0.15)
0.000 (3.1 9)* -I 328
11.879 90.1% 267.6"
380
Log (TOTAL FEE)
0.309 (12.63)*
0.046 (5.16)" 4 . 1 2 4 (-2.66)" 4 . 1 2 0 (-2.29)*
*
4 . 1 17 (-3.66)* 4 . 3 3 7 (-6.49)
*
4 . 7 3 7 (-1 6.55)*4 . 0 0 6 ( 4 . 1 6 ) 0.111 (2.25)*
*
4.oo
1(-2.02)** 4 . 6 4 8 ( 4 . 3 0 ) 0.000 (0.19)
0
.ooo
(4.27)*
11.838 92.2% 345.5*380
FEE PREM
4 . 0 7 5 (-3.36)* 0.017 (2.13)**
0.065
( I .53) 4 . 0 9 7 (-2.0 I)** 4 . 1 2 3 (-4.19)*
0.074 (1.55) 4 . 0 2 8 ( 4 . 6 8 )
4 . 0 3 5 (-0.95)
4 . 0 3 4 ( 4 . 7 7 ) -0.002 (-3
.o
1 )*2.417 (1.21) 0
.ooo
(2.62)**-0
.ooo
(-0.78) 1.026
I 1.5% 4.8* 38 1
**
FEE PREM=fee premium; LPOP=log of population; LPOPDEN=log of population density; LAVGINC=log of average income; SMALL=non-Big 4 audit firm; BIG 4=Big 4 audit firm; CLIENTS=number of local authority clients; FV=financial viability; SURDEF=surplus/deficit; DEBT=debt per 1,000 population.hand, are not significantly different to district audit fees. Four authority types are compared with met- ropolitan districts; county councils and district councils have significantly lower fees relative to metropolitan districts. County and District gener- ally are rural, suggesting relatively lower fees for rural authorities. CLIENTS is negative and signif- icant, indicating that industry specialisation results in lower fees, an economies of scale interpretation. Neither financial viability nor surplus deficit is
significant. DEBT is positive and significant, in- dicative of a higher fee associated with increased credit risk.
The TOTAL FEE model was run to determine if the additional audit-related fees have a different impact than the original BASE FEE decision. While we did not expect a differential impact (be- cause all the audit work is required by the com- mission), we did test for corroboration. The results are similar to the BASE FEE model, suggesting
Vol. 37 No. I . 2007
zyxwvutsrqponmlkjihgfedcbaZYXWVUTSRQPONMLKJIHGFEDCBA
33zyxwvutsrqponmlkjihgfedcbaZYXWVUTSRQPONMLKJIHGFEDCBA
Table 6
Probit analysis of auditor selection with coefficient (chi-square)
(extreme values eliminated)
-
zyxwvutsrqponmlkjihgfedcbaZYXWVUTSRQPONMLKJIHGFEDCBA
first-stage of Heckman's procedure Private auditorsDependent variable is Big 4 dummy
zyxwvutsrqponmlkjihgfedcbaZYXWVUTSRQPONMLKJIHGFEDCBA
Indeprrident vnr-itrble Co<jfi'cie.nt Chi-,quare
LPOP
L P O P D E N L A V G I N C County council District c o u n c i l Unitary authority London b o r o u g h
CLIENTS
Intercept
n
0.484 -0.410 - I ,576
0.186 2.209 -0.476
0.104
1 1.938
380 -1.880
(2.82)
( I I .45)*
(5.66) #' I:
(4.82)
* *
(0.10)
( 1 3.79)* (0.48)
(80.10)*'
(2.51)
*
Significant a t 0.01: "'"Significant a t 0.05zyxwvutsrqponmlkjihgfedcbaZYXWVUTSRQPONMLKJIHGFEDCBA
*'k'k L P O P = l o g of population: L P O P D E N = l o g of population d e n s i t y ; L A V G I N C = l o g of a v e r a g e i n c o m e ;
C L I E N T S = n u m b e r of local authority clients.
that there are no significant incentives to charge lower audit fees to receive additional audit-related work. The Audit Commission has strict rules for- bidding non-audit work, which they identify as a 'regime constraint'. Adjusted R' is 92.2%. The
only differences in the TOTAL FEE model are: ( 1
zyxwvutsrqponmlkjihgfedcbaZYXWVUTSRQPONMLKJIHGFEDCBA
)SMALL is negative and significant, indicating that total fees are significantly lower than for District auditors and (2) London boroughs are positive and significant, suggesting higher audit costs.
The FEE PREM model has an adjusted R' of 11.5%, much lower than the two previous models. The results differ from the other two models, as expected given the correlation results in Table 4. This model attempts to explain the differences be- tween the total fee and Audit Commission's stan- dard fee. LPOP is negative and significant, LPOPDEN is positive and significant, and LAVGINC is insignificant. Fee premiums are rel- atively higher for smaller, less crowded authori- ties. Standard fees are a linear function of expenditures and the negative sign suggests that audit fees rise with size at a lower than linear rate. Both SMALL and BIG4 are negative and signifi- cant, suggesting that on average the private firms
l 5 An alternative analysis to explain relative fee premium is to use TOTAL FEE minus STANDARD FEE as a fee pretni- um measure. (Since negative signs are common. the variable cannot be logged.) In this model, the adjusted R? is only 25.78 and LOGPOP is insignificant. SMALL. BIG 4 and CLIENTS are negative and significant, while all authority types are also negative and significant. In other words, the same basic auditor-related results hold in this context.
The Heckman analysis was also run using BIG 4 com- pared to DA based on BASE FEES and private firms (BIG 4 plus SMALL) compared to DA using both TOTAL FEES and BASE FEES.
receive relatively lower fee premiums. None of the authority types is significant, indicating that the relative premium is independent of type of author- ity. CLIENTS is negative and significant. The re- sults for CLIENTS are robust across the models, indicating the importance of economies of scale for audit fee pricing. SURDEF is positive and sig- nificant. an unexpected result. This suggests that audit fees rise for higher surpluses. Both FV and DEBT are insignificant.'s
6.
Sensitivity checks
6.1. Heckinan k two-stage procedure
Table 6 presents the stage one results, based on
probit analysis.
Stage-one is a probit analysis where the depend- ent variable is a dummy variable where I=Big 4 firm and O=DA. The independent variables are the OLS variables that are consistently significant (LPOP, LPOPDEN, LAVGINC, CLIENTS, and the four authority dummies). All but LPOP, district council and London boroughs are significant.I6
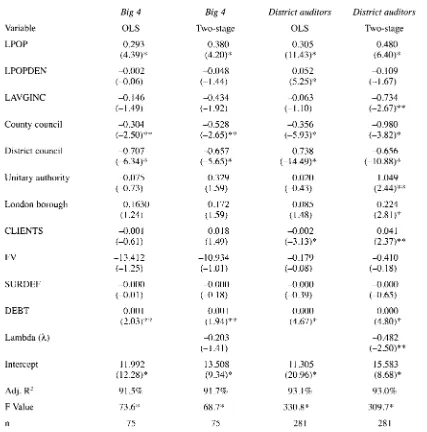
The second stage (Table 7) compares audit fees for Big 4 firms compared to District auditors using Log of TOTAL FEE as the dependent variable. The 75 authorities using Big 4 auditors are com- pared with the 281 using DA. The OLS results for both BIG 4 and DA compared with the overall re- sults i n Table 5 , are somewhat different.
Several variables are not significant for BIG 4 (LPOPDEN, LAVGINC, London boroughs, and
CLIENTS) and DA (LAVGINC and London
Boroughs) that were significant in the overall (Table 5 ) analysis. However, the overall explana-
tory power as measured by adjusted R' was similar at 91.5% and 93.1% for BIG 4 and DA
34
zyxwvutsrqponmlkjihgfedcbaZYXWVUTSRQPONMLKJIHGFEDCBA
ACCOUNTING AND BUSINESS RESEARCH Table 7Regression analysis with coefficient (t-value); dependent variable is log of TOTAL FEE
Big 4 to district auditor comparison, based on Heckman's two-stage procedure
zyxwvutsrqponmlkjihgfedcbaZYXWVUTSRQPONMLKJIHGFEDCBA
Big
zyxwvutsrqponmlkjihgfedcbaZYXWVUTSRQPONMLKJIHGFEDCBA
4 Big 4 District auditors District auditorsVariable OLS Two-stage OLS Two-stage LPOP 0.293 0.380 0.305 0.480
(4.39)" (4.20)" (1 1.43)" (6.40)"
LPOPDEN -0.002 -0.048 0.052 -0.109 (-0.06) (-1.44) (5.25)" (-1.67)
LAVGINC -0.146 -0.434 -0.063 -0.734
zyxwvutsrqponmlkjihgfedcbaZYXWVUTSRQPONMLKJIHGFEDCBA
(- 1.49) (-I .92) (-1.10) (-2.67)""
County council 4 . 3 0 4 -0.528 -0.356 -0.980
District council -0.707 -0.657 -0.738 -0.656 (-6.34)j: (-5.65)" (- 1 4.49)" (-10.88)4'
Unitary authority -0.075 0.329 -0.020 I .049
London borough 0.1630 0.172 0.085 0.224
CLIENTS -0
.oo
1zyxwvutsrqponmlkjihgfedcbaZYXWVUTSRQPONMLKJIHGFEDCBA
0.018 -0.002 0.041 (-2 ,SO)""
(-2.65)" 1: (-5.93)" (-3.82)"(-0.73) ( I .59) (-0.43) (2.44)""
( I .24) (1.59) (1.48) (2.81)4:
(-0.61) ( 1.49) (-3.13)" (2.37)"j'
FV -1 3.4 12 -10.934 -0.179 -0.410 (-1.25) (-1.01) (-0.08) (-0.18)
SURDEF -0.000 -0.000 -0.000 -0
.ooo
( 4 . 0 1 ) (-0.18) (-0.39) (-0.65)DEBT 0.001 0.00 I 0.000 0.000 (2.03p j' ( I .94)""' (4.67)" (4.80) q'
Lambda ( h ) -0.203 -0.482
(-I .4l) (-2 50)"
"
Intercept 11.992 1 3 .SO8 11.305 15.583
( I2.28)$: (9 3 4 )
*:
(20.96)'" (8.68):'Adj. R' 91 .5% 91.7% 93.1% 93.0%
F Value 13.6j: 68.7*' 330.8* 309.74' n 75 75 28 I 28 I
*
Significant at0 .01: ""$Significant at 0.05; h = Inverse Mill's Ratio**1: FEE PREM=fee premium; LPOP=log of population: LPOPDEN=log of population density: LAVGINC=log
of average income: SMALL=non-Big 4 audit firm: BIG 4=Big 4 audit firm; CLIENTS=number of local authority clients; FV=financial viability: SURDEF=surplus/deficit: DEBT=debt per thousand population. respectively.
The second-stage approach shows some model differences in Table 7. If self-selection is present, it may manifest itself in the change in coefficients as well as the intercept between the OLS and two- stage models. The Big 4 two-stage results are sim- ilar to OLS results. The second-stage Big 4 model has four significant variables, LPOP, county coun- cils, district councils, and DEBT. All variables are
significant for DA, except FV and SURDEF. CLIENTS switches signs to positive, a results sug- gesting a fee premium for increased specialisation. Adjusted R' is similar for both Big 4 (at 91.7%) and D A (93.0%) and when compared with OLS results. The intercepts are roughly similar between OLS and two-stage for both Big 4 and district auditors, indicating no systematic shift when a self-selection correction is applied.
[image:15.540.59.486.138.570.2]Vol.
zyxwvutsrqponmlkjihgfedcbaZYXWVUTSRQPONMLKJIHGFEDCBA
37 No. 1.2007Lambda is a residual calculation of the first- stage probit regression and represents those factors that ‘help’ self-select into BIG 4 or DA, but are not captured in the OLS model. In the BIG 4 model, Lambda is insignificant, indicating no self-selec- tion bias. Lambda is negative and significant for DA, which indicates a selection bias. This suggests that local authorities that used a DA auditor could have had a more ‘efficient’ audit (that is, lower fee) by using a Big 4 firm. In summary, the results using the Inverse Mills Ratio provide no evidence of a