Epiclastic volcanic debrites-evidence of flow transformations
between avalanche and debris flow processes, Middle
Ordovician, Baie Verte Peninsula, Newfoundland, Canada
L.G. Kessler
a,*, J.H. Be´dard
baMarathon Oil Company,P.O.Box3128,Houston,TX77253,USA
bGeological Sur6ey of Canada,Centre Geoscientifique,C.P.7500,Sainte-Foy,Que´bec,Canada G1V4C7
Abstract
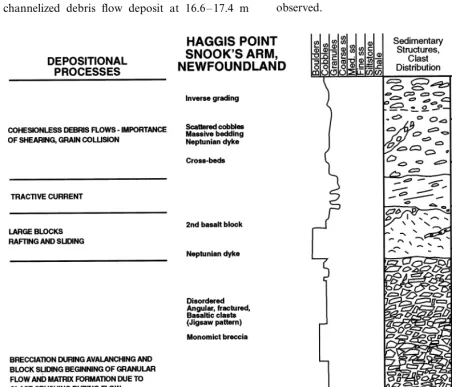
The Balsum Bud Cove Formation of the Snooks Arm Group, eastern Baie Verte Peninsula, Newfoundland contains intervals of epiclastic mafic volcanic debrites characterized by textures indicative of gravity flow evolution in a submarine setting. These proximal to distal and aggradational deposits record a downslope change from debris avalanche to cohesionless debris flow processes. This change involves the mechanical formation of small cobble to granular matrix due to apparent crushing and grinding of large, angular basalt clasts during downslope movement. This flow evolution has been studied in two measured sections in the Upper Debrite Member of the Balsum Bud Cove Formation along Snooks Arm. Avalanche and proto-debris flow deposits have been studied in the stratigraphically lower and more proximal section at Haggis Point. An upper and more distal section, Devil’s Splitting Table (:20 – 30
m above Haggis Point), contains mostly channelized basalt-clast debris flow deposits which are chaotic or crudely inversely graded and amalgamated with the underlying flow units. Some inversely graded, cohesionless, debris flows observed at Devil’s Splitting Table contain basaltic clasts, 20 – 100 cm in diameter, supported at or near their tops. In an effort to better understand the flow dynamics of the debrites observed at Haggis Point and Devil’s Splitting Table, individual flow units in both sections were analysed to determine original flow thickness at initiation, slope angle at flow initiation, and flow velocity. Using equations from Takahashi (1978) (Mechanical characteristics of debris flow, J. Hydraul. Div. Am. Soc. Civ. Eng., 104 (HYB 8), 1153 – 1159) and Takahashi (1981) (Debris flow, Ann. Rev. Fluid Mech., 13, 57 – 77), which are applicable to both to subaerial and submarine debris flows, flow velocities ranging from 6.22 to 7.78 m/s were calculated for proto- and cohesionless debris flows at Haggis Point. Initiation slopes range from 12.3 to 16.7°. An avalanche deposit at Haggis Point attained a velocity of 28.87 m/s. Cohesionless debris flows at Devils Splitting Table had a range of flow velocities of 5.86 – 12.32 m/s at calculated slopes of 4.8 – 18.8°. With the exception of the avalanche velocity these examples are consistent with velocities observed or calculated for other high slope submarine debris flow deposits. The calculated initiation slopes and velocities indicate 5-11 km of potential avalanche/debris flow run-out in the Upper Debrite. The epiclastic volcanic apron observed in the Upper Debrite outcrops along Snooks Arm is progradational. It consists of a proximal apron dominated by avalanche and proto-debris flow deposits and a distal apron dominated by highly channelized cohesionless debris flows and sandy turbidites. © 2000 Elsevier Science B.V. All rights reserved.
www.elsevier.com/locate/precamres
* Corresponding author.
Keywords:Debrite; Epiclastic; Avalanche; Debris flow; Mafic volcanic; Ordovician; Newfoundland
1. Introduction
The Middle Ordovician Balsum Bud Cove For-mation of the Snooks Arm Group, eastern Baie Verte Peninsula, Newfoundland contains a series of epiclastic mafic volcanic debrites characterized by textures indicative of complex gravity flow evolution. Specifically, these are proximal to dis-tal, aggradational, deposits recording a downslope change from avalanche to debris flow deposition in a submarine setting. This change occurs, both as the result of, and due to, the apparent mechan-ical formation of matrix due to clast crushing and grinding of angular basaltic boulders during downslope avalanche movement.
We measured two sections in the Upper Debrite Member of the Balsum Bud Cove Formation along Snook’s Arm (Figs. 1 and 2). Haggis Point, the stratigraphically lower section contains mostly avalanche and proto-debris flow deposits, where clast grinding and crushing with primitive matrix development appears to be a major mechanical process. The upper section, Devil’s Splitting Table, is :20 – 30 m higher and contains mostly
channelized basaltic clast debris flow deposits with fine-to-medium-grained basaltic matrix. These flows are chaotic or crudely inversely graded and are often amalgamated with underly-ing flows in what appear to be individual channel fills. We infer that these flows can support (20 – 100 cm in diameter) large clasts at their tops. The aim of this investigation is a better understanding of gravity current flow transformations in a tran-sition from avalanche to debris flow processes. To this end, clast distribution patterns and recogniz-able flow units are compared between the two sections in an effort to construct a scenario for the progradation of an epiclastic submarine debrite sequence. Using equations from Taka-hashi (1978, 1981) and assumptions about clast and fluid concentrations, initiation slope angles of debris flows and initial flow velocities were
calcu-lated. These calculations, which are adjusted to submarine transport conditions, suggest debris flow run-out distances in the excess of 5 km and may be useful in texturally demarcating the boundary between proto-debris flows and avalanches.
The presence of angular, apparently crushed, clasts (the material for early matrix creation) in avalanche and proto-debris flow deposits, and of a strong, clast support capability in debris flows, suggest that other processes such as granular flow may occur in this depositional setting. Similar processes are thought to occur in subaerial debris flows in the Triassic/Jurassic of the Newark Basin, where Takahashi’s equations yielded similar re-sults (to those obtained for the Upper Debrite) in initiation slope angle and flow velocity (Kessler and Manspeizer, 1994).
.
Kessler
,
J
.
H
.
Be
´dard
/
Precambrian
Research
101
(2000)
135
–
161
137
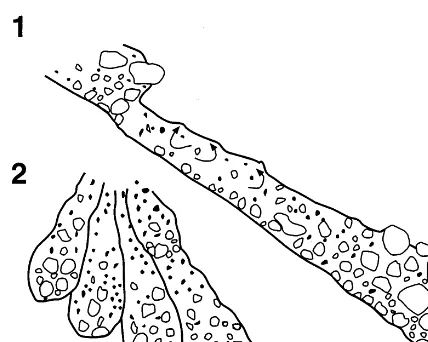
Fig. 3. Models of surging cohesionless debris flow showing examples of potential vertical size distribution within flow. Large clasts are supported at the top of the flow in the proximal zone and a more chaotic class distribution is ob-served further back in the flow. Diagram 2 shows abrupt lateral facies changes along lateral transects (After Kim et al., 1995).
solids (such as sand, gravel, cobbles, and boul-ders), water, and air as a single phase system.’’ This gravitational downslope movement involves clast, fluid, and matrix interaction to the extent that coarser particles such as gravel, cobbles, and boulders can be supported in the body of the flow. The clast-support property requires that de-bris flows have a yield strength, which must be exceeded for movement (deformation) to begin. Movement begins in a basal zone of maximum shear stress where laminar flow, sliding, and rolling of clasts occurs. Further up in the flow, in a zone of lower shear stresses, the rest of the material is rafted along as a semi-rigid plug. Clast-support mechanisms and their rheology vary in debris flows. Many debris flows are sup-ported mostly by the strength of their interstitial matrix, which contains varying amounts of clay. In addition, such cohesive debris flows are also supported by the buoyancy of the clasts as exerted by the matrix. However, the main support mecha-nism in debris flows with a sandy and/or gravelly matrix appears to be inertial grain interaction, and they act as inertial slurries or granular fluids (Kim et al., 1995). In such cohesionless debris flows with large clast concentrations, inverse grad-ing with the largest clasts supported at or near the top of the flow is observed (Shultz, 1984). Normal grading and/or chaotic distribution of larger clasts is also observed in both cohesive and cohesionless debris flows and depends on turbulence, degree of grain interlocking, amount of matrix and location along the debris flow’s path (Fig. 3). Shultz (1984) equates debrite grading style, texture, and volume of matrix to the relative importance of cohesion, clast interaction or dispersive pressure, and fluid behavior.
We propose the new term, proto-debris flow, to facilitate the discussion of debrite matrix creation in flows which appear to be transitional between avalanches and debris flows. A proto-debris flow represents the first stage of matrix formation by apparent clast crushing and grinding during avalanche flow. Proto-debris flows that are ob-served in two parts of the Haggis Point section consist of small cobble and gravel size clasts as matrix between angular boulder-size basaltic frag-ments. Further downslope movement of
proto-de-2. Terminology
Avalanches are characterized as large dislodged rock mass flows which move rapidly (:10 – 100
m/s) down generally high slopes (10°+). Cas and Wright (1987), p. 302) view an avalanche as ‘‘... a mobile, fluidal, close packing of blocks and ments which jostle, bump, push, collide, and frag-ment each other in transit.’’ Finer-grained interstitial material or matrix has little affect on avalanche movement and is largely abraded dur-ing flow. Avalanches do not have pervasive inter-nal deformation and are thus not coherent flows. Flow momentum and mobility are maintained by grain-to-grain collisions with progressive momen-tum transfer through the avalanching mass (Cas and Wright, 1987). Avalanche deposits are gener-ally very poorly sorted with a mixture of megablocks (tens of meters+ in diameter), boul-der and cobble-size fragments, gravel, sand, and mud. Due to collisional breaking during trans-port, individual clasts are generally very angular and often form a jigsaw fit breccia.
bris flows leads to formation of finer grained matrix and fully developed cohesionless debris flows.
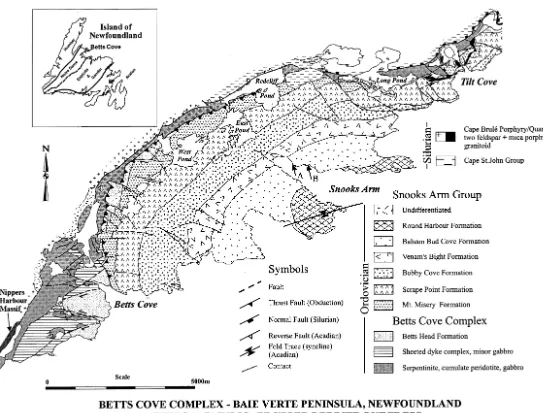
3. Geological setting
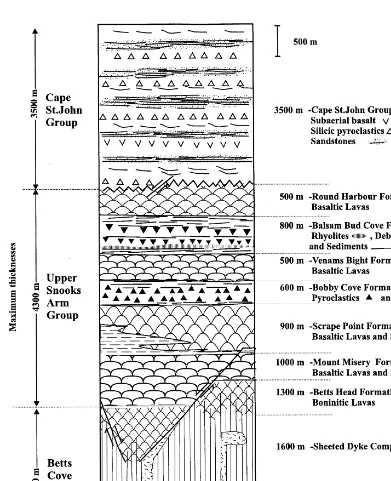
The Balsum Bud Cove Formation of the Snooks Arm Group in the eastern Baie Verte Peninsula, Newfoundland was deposited as part of the cover rocks of the Betts Cove Ophiolite which was one of a collage (temporally fourth of five) of oceanic terranes (the Dunnage Zone) accreted to the Lau-rentian continental margin (the Humber Zone) during the Taconic Orogeny (Williams, 1979; Hib-bard, 1983; Williams et al., 1988). Humber and Dunnage zone rocks are separated by the Baie Verte-Brompton Line (BBL) which formed as a suture where the oceanic Dunnage terranes over-thrust the Humber zone (Fig. 1). The Betts Cove Ophiolite (a relic of Ordovician oceanic crust) and its associated cover rocks provide a record of marginal basin evolution and terrain accretion at this time (Dunning and Krogh, 1985; Be´dard et al., 1999, 2000). The volcano-sedimentary con-formable cover of the Betts Cove Ophiolite is the 4300-m thick Upper Snooks Arm Group (Hibbard, 1983) which contains the 800-m thick Balsum Bud Cove Formation near its top (Fig. 2). The Upper Snooks Arm Group is divided into six formations of which the lower two, the Mt Misery and Scrape Point are predominantly basaltic lavas with minor amounts of chert and a mixed interval of mud-stone, siltmud-stone, turbidites, and tuffaceous sand. The overlying Bobby Cove Formation consists of a lower member of interbedded tuffaceous volcani-clastic conglomerates (of pyrovolcani-clastic debris flow origin), mafic to felsic tuffaceous sandstones, and rare basaltic to andesitic lava flows. The upper member of the Bobby Cove Formation is com-posed of epiclastic volcanogenic turbidites in-terbedded with pelagic siliceous mudstones (Cousineau and Be´dard, 2000). Most of the turbid-ites are normally graded and contain mudstone rip-up clasts of varying size. Of note, in the Bobby Cove Turbiditic Member is the occurrence of onlapping domal bedforms which suggest deposi-tion in a highly density stratified basin by interac-tion of standing waves with basin floor topography
(Kessler and Prave, 1998). The Bobby Cove For-mation is overlain by the basaltic lavas (with rare red siliceous mudstone interbeds) of the Venams Bight Formation which is, in turn, overlain by the Balsum Bud Cove Formation (Fig. 2). The Balsum Bud Cove Formation is overlain by the basaltic lavas of the Round Harbour Formation.
The Balsum Bud Cove Formation is divided into two members. The lower member consists of pelagites, volcaniclastic turbidites, tuffaceous sand-stones, and basaltic lava. The pelagites are in-terbedded with volcaniclastic sandstones. Above this, interbedded felsic tuffs (some massive and up to 4 m thick) and black shale are observed with succeeding units of thin tuff beds. The black shale interbeds of the lower member contain a graptolite fauna from theDidymograptus bifiduszone, indica-tive of an early Llanvirn age (:477 Ma) (Williams,
1992).
The base of the Upper Debrite Member of the Balsum Bud Cove Formation is defined at the first thick mass flow and, as will be discussed below, is related to the development of a volcaniclastic apron with both proximal and distal parts (Be´dard et al., 1999). Two detailed sections measured on the northeast shore of Snooks Arm at Haggis Point (HP on Fig. 1) and Devils Splitting Table (DSP on Fig. 1) are the basis for this study.
In the Snook’s Arm section of the Upper Debrite, the lower part of the member is exposed at Haggis Point and consists of 45 m of mass-flow deposits which contain large fragments (up to 20 m in diameter) of massive and pillowed basalt, leu-coxene-rich diabase, basalt breccia, polymictic breccia, and felsic tuff (Fig. 4). The larger basaltic clasts (\10×30 m) are pillowed and grade out
through a monomict basaltic breccia to a polymict conglomerate. Lava clasts are cut by thin (1 – 2 cm) pebbly sandstone dykes. This basal debrite interval is overlain by :50 m of amalgamated,
coarse, channelized conglomerates or debrites with individual beds or flow units ranging fro 0.4 to 5.0 m thick. Debris flow conglomerates have a matrix which contains clinopyroxene fragments (1 – 2 mm), saussuritized plagioclase (B
At-Devil’s Splitting Table, 24 m of this section was described. At the top of the Devil’s Splitting Table Section, a set of planar- and cross-stratified sandstones appear, followed by thin-bedded tur-bidite sandstones and pelagic mudstones. Above the Devil’s Splitting Table section, a further 100+ m section of channelized debris flow de-posits in a distal volcaniclastic apron is observed. These debrites are interbedded with basin-plain turbidites and pelagites near their tops.
4. Descriptions of measured sections
Two accessible measured sections in the Upper Debrite Member of the Balsum Bud Cove Mem-ber, Haggis Point and Devils Splitting Table, were initially described (1:50 scale) along the northeast shore of Snooks Arm (Fig. 1). These sections, which are the main data base for this study, illustrate the main proximal to distal variations in debrite texture.
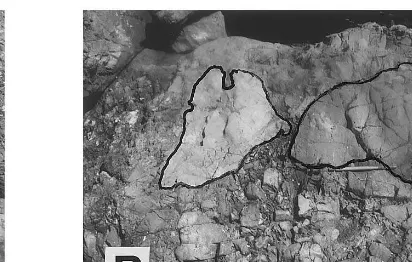
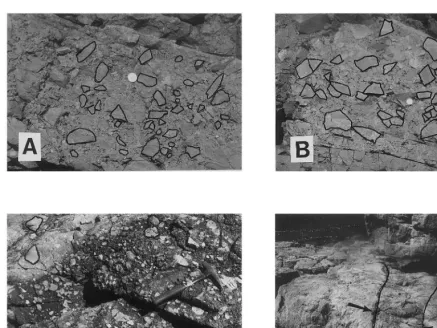
Fig. 5. Haggis Point (A) polymictic conglomerate/breccia from 7.8 to 8.3 m. Clasts are polymictic with chaotic distribution and fine grained to granular basaltic material as matrix. Diameter of tape measure is 17 cm. (B) Top of monomict breccia at 22.8 – 23.2 m, large clasts (outlined in black) supported at top of flow with crude clast ordering below. This is part of a proto-debris flow with a granular matrix. Length of pen is 13 cm. (C) Top of monomict breccia (1) with overlying muddy turbidity current deposit (2) which is, in turn, overlain by a basalt slab (3) shown in Fig. 5D. The three units are separated by black lines. The slab slid or was probably carried down slope by a proto-debris flow. The interval is from 22.8 – 23.5 m. Length of pencil is 16 cm. (D) Top of monomict breccia shown in Fig. 5C (1) with overlying basalt slab (3) (note pillows on viewer’s left). Basalt slab grades laterally and vertically into monomict breccia interval shown in Fig. 7A, B. Up is toward viewer’s left of picture. Length of hammer is 28 cm.
4.1. Haggis Point
Haggis Point (measured section, 42 m), is the stratigraphically lowermost measurable section in this study. Starting from the base, the lowest 15 m of the section is composed of five amalgamated flow units (1.5 – 4.0 m in thickness) of polymictic conglomerate containing cobble- and boulder-size clasts of leucoxene-rich diabase, basaltic brec-cia, and felsite tuff (Fig. 4). Clasts are mostly angular and range in diameter from 3.5 to 35.0 cm. with a generally coarse matrix material (coarse-grained, granule, even pebble size)
deposited in a shallow scour and has a 25×60 cm sub-rounded basaltic clast at its base whilst sup-porting a 25×35 cm clast at its top (Fig. 4). A thin mudstone unit at 14.9 – 15.1 m ends this episode of debrite deposition.
Beginning at 15.1 m, individual flow units of cobble and boulder debrites become more difficult to identify (Figs. 4 and 6). As shown on the detailed core log from 16.0 to 25.0 m, there are several zones where a group of boulders appear to be floating at the top of a flow unit, at 17.0, 18.0, 21.5, and 23.0 m, respectively (Fig. 6). Only the
17.0 and 18.0 m examples have clear bases and are recognizable as single, crudely inversely graded, debris flow units. The interval from 22.8 to 23.5 m is of major interest in understanding the mechanics of epiclastic debrite emplacement (Fig. 5B,C, Fig. 6). As Fig. 5B shows, the monomict breccia observed from 22.8 to 23.0 m consists of large (15×25 and 20×17 cm) clasts supported at the top of a flow unit with crude clast ordering below. The small cobble-, gravel-, and granule-size clasts are very angular and appear to act as a matrix, which supports the larger clasts. Debrites
with these matrix characteristics are referred to as proto-debris flows in this study and are probably the product of clast grinding and crushing during downslope movement. The upper surface of this flow unit is irregular and shows some zones where granule and gravel-sized clasts show normal rather than inverse grading. This may indicate deposition from the main body of the flow rather than near the front or snout as suggested by the presence of the larger boulders (Fig. 5C). Two other features are visible in Fig. 5C. Just above the debrite material is a muddy unit :10 cm
thick with planar and contorted vortex-like bed-ding and normal grabed-ding. Based on bedbed-ding char-acteristics, this probably represents a muddy turbidity current, between debrite emplacement events. Immediately above this muddy unit, are three basaltic slabs (one a pillow basalt) which lie on top of the debrite and muddy turbidite unit (Fig. 5C,D, Fig. 6). The base and main body of the pillow basalt is seen at the top of Fig. 5C and in Fig. 5D. These slabs (tens of meters in length) may have initially been carried down slope by debris avalanches and have advanced further by being carried by newly formed proto-debris flows. The pillow basalt slab shown in Fig. 5D grades laterally and vertically into the monomict breccia interval which is observed in Fig. 7A and B.
The interval from 25.0 to 34.0 m includes 6.0 m of mostly monomict, cobble to boulder, basaltic breccia which has sub-rounded to angular clasts with a large basaltic block (1.3 m in thickness) at its top (Fig. 8). Flow units are not easily recogniz-able though some differences are apparent higher in the section. The interval from 26.1 to 26.5 m consists of large clasts (10 – 20 cm diameter) with a matrix of smaller sub-angular to sub-rounded clasts (Fig. 7A Fig. 8). The lack of an ordered fabric in this flow unit indicates that clast size reduction is an ongoing process, and that grain support support mechanisms (whether through grain collision or a cohesive matrix) have only begun to develop.
In the section from 27.3 to 28.5 m the interval consists of angular basaltic clasts ranging in di-ameter from 2.0 – 25.0 cm and having the appear-ance of angular pieces in a jigsaw puzzle (Fig. 7B). Such features in subaerial avalanche deposits are
referred to as ‘crackle or jigsaw breccia’ and are the result of in place, pervasive, fracturing of large rocks during down-slope avalanche movement and large clast collision (Yarnold, 1993). Since there is space observed between angular clasts in this interval, it probably represents a ‘jigsaw brec-cia’. The presence of numerous small angular basaltic clasts suggests that even more organiza-tion has occurred with the small clasts represent-ing the beginnrepresent-ing of matrix formation (Fig. 9). Though this matrix is not yet a true support mechanism, it may represent the earliest stages of proto-debris flow formation with clast crushing and grinding and lie between the first two stages of flow evolution shown in Fig. 9.
The remainder of the Haggis Point measured section from 31.0 to 42.0 m consists of sand matrix cohesionless debris flow deposits with ma-trix supported cobbles and boulders. Such cobble-dominated debris flows are generally disorganized as shown at 38.5 to 40.0 m (Fig. 7C). In addition, several parts of this interval contain massive and normally graded sandstone scour fills with occa-sional planar and cross bedding. Such a feature is shown at 34.8 to 35.6 m where massive and planar bedded, coarse-grained sandstone fill a scour (Fig. 7D). The sandy, more organized, upper part of the Haggis Point section probably represents de-position in the distal part of a submarine volcani-clastic (epivolcani-clastic) apron.
4.2. De6il’s Splitting Table
The Devil’s Splitting Table measured section is
:30 m stratigraphically above the top of the
Fig. 7. Haggis Point (A) primitive proto-debris flow unit with granule and small cobble matrix. A selection of angular to subangular, cobble to boulder-size clasts and rounded to subangular, small cobble-size matrix material has been outlined in black. Matrix was probably formed during avalanche and early proto-debris flow movement, 26.1 – 26.5 m. Diameter of coin is 2.7 cm. (B) Mostly angular, brecciated basalt clasts which broke in place during downslope debris avalanche movement. A selection of mostly angular clasts is outlied in black. Smaller clasts probably represent the first step in proto-debris flow matrix formation by class crushing and grinding, 27.3 – 28.5 m. Diameter of coin is 2.7 cm. (C) Cohesionless debris flow at 38.5 – 40.0 m. Larger clasts are observed at the top of flow and are outlined in black. Stratigraphically up is toward the top left (reader’s) of picture. Length of hammer is 28 cm. (D) Scour fill containing planar bedding and matrix-supported debris flows at 34.8 – 35.6 m. Deposition was by sandy turbidity currents and cohesionless debris flows. Between arrows and black lines scour fill is 30 cm thick. Top is to reader’s left.
be, in part, channelized. It is amalgamated with the overlying flow. At 3.6 – 4.0 m a scour down-cutting into massive sandy (basaltic) material is observed (Figs. 11 and 12B). This scour is filled with granular basaltic material and appears to be part of a complex anastomosing channel system on the distal part of the volcaniclastic debris apron surface.
In contrast to the inversely graded cohesionless debris examined at 0.2 – 0.8 m, a highly disordered flow unit is observed from 5.5 to 7.3 m (Fig. 12C). This flow unit consists of boulder and cobble size
basaltic clasts in a sandy and silty matrix with virtually no discenible pattern of size sorting. This totally disordered interval contains elongate boul-ders standing on end and complete scattering of clast sizes throughout. This indicates turbulent flow conditions in this cohesionless debris flow.
apparent weight of this basaltic clast, the support mechanism of this debris flow must be in part cohesive, since inertial grain interaction may not be sufficient for the task. The remainder of the Devil’s Splitting Table section from 12.0 to 17.65 m consists of scour fills with massive and tractive bedding deposited by high concentration sandy turbidity currents (Fig. 13). This turbidite deposi-tion is punctuated by isolated, channelized, basaltic conglomerates that are the product of cohesionless debris flows. Of particular note, is a channelized debris flow deposit at 16.6 – 17.4 m
which has inverse grading to disordered clast dis-tribution upward of fairly large (up to 25 cm diameter) basaltic clasts (Fig. 14). Above this debris flow the section is dominated by sandy turbidity current deposits.
Debrite deposition at Devil’s Splitting Table appears to be largely the result of cohesionless debris flows, which depending on clast size, ma-trix strength and nature, and various flow parameters may be inversely graded or highly disordered. Rare normal grading is also observed.
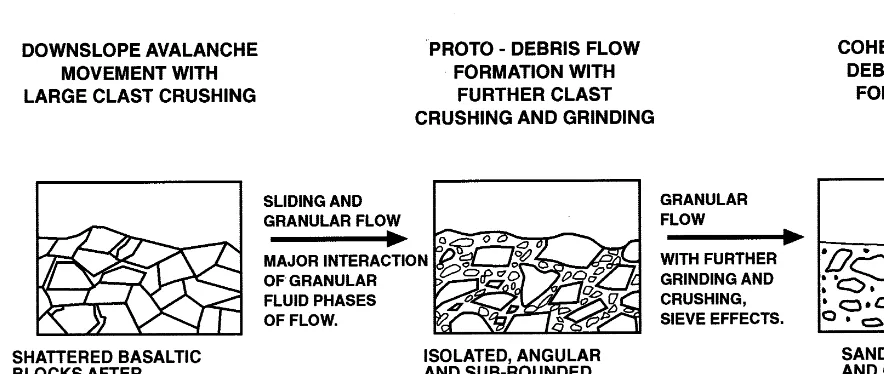
Fig. 9. Transition from debris avalanche to proto-debris flow to cohesionless debris flow. This transition involves the gradual creation of sandy matrix by grain crushing and grinding during debris avalanche and proto debris flow movement. This process is a continuum and involves granular flow in its middle and later phases.
5. Depositional mechanics
In an effort to understand flow transformations and dynamics of the debrite deposits observed in the Balsum Bud Cove Formation better measure-ments, estimates, and calculations of various flow parameters have been made. The ultimate aim of this quantitative analysis is calculation of reliable values for such properties as debris flow initiation (u) and depositional (g) slopes, initiation (U) and depositional (U1) flow velocities, and flow yield strength (k). These calculations allow us to pre-dict debris flow rout potential and better un-derstand facies distribution on the epiclastic debrite apron. In addition, the results of these calculations allow us to better recognize flow transformations between debris avalanche and co-hesionless debris flow processes and deposition (Fig. 9).
Following the lead of Kessler and Moorhouse (1984) and Hiscott and James (1985), who made calculations of such properties as yield strength, slope, and flow velocity, measurements and esti-mations of parameters like outcrop flow unit
thickness, maximum and 16% ile large clast di-ameters (d), and flow initiation (h) and deposi-tional (h1) thicknesses were made. Values for overall debris flow density (nd) and initiation/
de-positional flow thicknesses were derived from esti-mated values of clast and matrix concentrations (CandCdu) and an assumption of an at rest flow
unit porosity (f) of 0.30 (Beard and Weyl, 1973). Since virtually all the clasts in the studied flow units are basaltic, a clast density (s) of 2.70 was used. Deposition under marine conditions was accounted for by a fluid density (r) of 1.03 (Table 1).
Bagnold (1954) of dispersive pressure resulting from the momentum exchange between grains in neighboring layers and through collisions and near misses. This momentum transfer also in-volves intergranular fluid in the flow. This mecha-nism, which was the result of experimental work by Bagnold (1954), is in contrast to cohesive debris flow models where the main grain support is from the plastic strength of an interstitial clay slurry.
More complex debris flow support mechanisms define flow competence by equating the weight of the largest supported clast with the sum of buoy-ancy and cohesive strength in the flow (Johnson, 1970). Such a mechanism is more likely to support clasts in a clay/water slurry. Hampton (1975, 1979) states that dispersive pressure created by grain collisions in debris flows makes a major contribution to grain support in addition to the dominance of cohesive strength and buoyancy.
Fig. 11. Devil’s Splitting Table detailed measured section between 0.0 and 9.0 m. This section is dominated by amalgamated cohesionless debris flows.
Pierson (1981) adds a further support mechanism to plastic strength, buoyancy, and dispersive pres-sure. He believes that excess pore pressure con-tained between clasts and in matrix in a debris flow unit is necessary to support large boulders. Pierson states that up to 67% of debris flow yield strength, where large clasts are supported is ac-counted for by buoyancy resulting from excess pore pressure. Preservation of pore pressure to the extent of making this mechanism dominant does not seem likely in a cohesionless submarine debris flow.
5.1. Application of Takahashi’s equations
The Takahashi (1978, 1981) equations for de-bris-flow slope and flow velocity are given in Table 2. Solutions of the debris flow initiation (u) and depositional (g) slope equations require val-ues for clast density (s), fluid density (r), grain concentration (C), equillibrium concentration
attained. The depositional slope angle (g) repre-sents the highest slope at which the flow will freeze and deposit. Solution of the Takahashi (1978, 1981) equation for debris flow initiation velocity (U) requires values for clast diameter (16%ile; d), acceleration of gravity (g=981 cm/
s2), constant (a=0.042), angle of internal friction
(a), grain concentration (C), equillibrium
con-centration (Cdu), fluid density (r), clast density (s), flow initiation thickness (h), and initiation slope angle (u) (Tables 1 and 2). The value of the
debris flow initiation flow velocity is used as the maximum velocity achieved by the flow. The de-positional flow velocity (U1), which represents the lowest velocity which will sustain the flow, is calculated by substituting the depositional flow thickness (h1) for h and the depositional slope angle (g) foru in the velocity equation (Table 2). As stated, some of the parameters used for solution of the Takahashi (1978, 1981) equations must be estimated and the assumption for these estimations should be reviewed. The most
Fig. 13. Devils Splitting Table detailed measured section between 9.0 and 17.65 m. This interval contains debris flow units with boulders supported at or near their tops.
tant assumption is that of an at rest flow unit porosity (f) of 0.30. This value is based on an average porosity for moderately to poorly sorted, medium to coarse-grained, mixed, wet, sand as determined by Beard and Weyl (1973). This paper is often used as a basis for porosity and perme-ability estimates in shallow marine sands and supplies the closest available analogy to pre-initia-tion, submarine gravity flows resposible for the Upper Debrite. Using a porosity value of 0.30, a baseline grain concentration by volume (C) of
0.70 is calculated (1.0−0.3) for a flow unit with
an equal distribution of clasts and matrix. Using this baseline, C was visuallly estimated for the
eight flow units analyzed in this study with a range of 0.68 – 0.85 (Tables 3 and 4). Low values (:0.70) indicated nearly equal amounts of clasts
and matrix whilst higher values (0.80+) indicate a dominance of clasts. Values of Cdu, the equil-librium concentration or grain concentration by volume once the flow is moving are normally in the range of 0.70 – 0.75Cagain based on relative
and 4). C is used as the proportion of basaltic
material in calculating flow density (r) and depo-sitional thickness (h1). The value of 1.0−Cdu is used as the proportion of basaltic material in computing flow iniation thickness (h). The angle of internal friction (a) is assumed to be 25° for
Table 2
Fig. 14. Debris flow unit at 16.6 – 17.4 m (between arrows and black lines, up is to reader’s right) containing angular to sub-rounded basaltic clasts (10 – 30 cm diameter) with crude inverse grading to disordered class distribution. Larger clasts are supported at the top of the flow. Hammer is 28 cm long.
use of the Takahashi equations in this study. Since the angle of internal friction is not readily measurable in ancient deposits, this assumption is based on what material scientists think would be accurate for very coarse poorly supported debris (Takahashi and Barree, 1998). The 16% ile clast size diameter is used instead of the median clast size (Takahashi, 1981) in order to account for a small amount of cohesive support of very large outside clasts in some flow units.
In order to evaluate whether the computed initiation and depositional flow velocities from selected flow units in the Upper Debrite are realis-tic, the densiometric Froude number (Fr%) was calculated for each velocity. This dimensionless number is the ratio between inertial forces (veloc-ity) and gravitational forces operating in a flow and is adjusted for a submarine setting. A value
B1.0 for Fr% indicates that gravitational forces dominate in the flow and it is said to be sub-criti-cal. Such conditions in a debris flow indicate laminar flow with little turbulence and internal disruption within the flow. A densiometric Froude number \1.0 indicates that inertial forces
(veloc-ity) forces dominate in the flow which is described as supercritical. Supercritical flows have surface waves, internal disturbances, and can develop
full-Table 1
Grain concentration (volume) C Angle internal friction a=25° Grain diameter (16% ile) d
Initiation slope u
Flow velocity (initiation) U(m/s) Flow velocity (deposition) U1(m/s)
Initiation thickness h
Depositional thickness h1
Froude number Fr
Densiometric Froude number Fr% c Boulder length
Tc
Flow thickness (fork)
nb
Boulder density
h
% Boulder exposed
scale turbulence. A densiometric Froude number
\2.0 indicates highly turbulent conditions where
debris flow deposits would have little or no clast organization.
5.2. Haggis Point — proto-debris flows and debris a6alanches
Three flow units at Haggis Point were selected for calculation of flow thickness, slope, and
veloc-ity at flow initiation and deposition (Fig. 4, Table 3). Flow unit 1 from 17.0 to 18.0 m in the measured section is amalgamated with flows im-mediately above and below it and supports a 45×20 cm clast at its top (Figs. 4 and 6). This flow which is crudely inversely graded is inter-preted as a primitive cohesionless debris flow with granular to small cobble matrix between cobble to small boulder clasts. This flow unit was calculated to have a flow density of 2.28 and a flow thickness
Table 3
Calculated debris flow properties — Haggis Point
Flow 1 Flow 2a Flow 3b
21.5–23.5
Section level (m) 17.0–18.0 26.5–29.8
0.75
Grain concentration (vol.)C 0.80 0.85
0.55
Equilibrium concentrationCdu 0.58 0.61
0.15 0.13
Grain diameter (16% ile)d(m) 0.09
2.52
Initiation thicknessh(m) 1.45 4.50
1.25
Deposition thicknessh1 (m) 2.16 3.80
Flow densityr 2.32 2.36 2.45
12.8–16.7° 13.1–18.4° 12.3–13.3°
Initiation slopeu
Depositional slopeg 0.9° 0.6° 0.4°
Flow velocity (initiation)U(m/s) 7.78 6.22 28.87
2.87
2.11 7.90
Flow velocity (deposition)Ul(m/s)
5.18×10⁴
Yield strength (dynes/cm2)k 3.78×10⁴ 5.98×10⁴
0.95
1.87 3.17
Froude number (density — initiation) Fr%
0.51 0.90
Froude number (density — deposition) Fr% 0.45
aProto-debris flow. bDebris avalanche.
Table 4
Calculated debris flow properties — Devil’s Splitting Table
Flow 5 Flow 4
Flow 3 Flow 2
Flow 1
0.2–0.8 4.7–5.6 5.5–7.3 10.48–11.35 16.6–17.4 Section level (m)
0.70 0.75
Grain concentration (vol.)C 0.67 0.72 0.68
0.54
Equilibrium concentrationCdu 0.50 0.56 0.51 0.53
0.11
Grain diameter (16% ile)d(m) 0.15 0.13 0.18 0.13
1.18
1.03 1.15
Initiation thicknessh(m) 2.48 1.34
Deposition thicknessh1 (m) 0.80 1.00 2.18 1.19 1.04
2.16
2.23 2.20
2.28 2.15
Flow densityr
9.8–11.8° 6.3–12.5° 4.8–12.3° 10.4–18.8° 6.7–12.1° Initiation slopeu
0.6°
Depositional slopeg 1.1° 0.9° 0.4° 1.2°
11.25 Flow velocity (initiation)U(m/s) 5.86 9.31 12.32 8.71
2.98 2.90
2.11 Flow velocity (deposition)Ul(m/s) 1.33 1.01
1.23×10⁴
1.05×10⁴
Yield strength (dynes/cm2)k 1.59×10⁴ 2.96×10⁴ 6.98×10⁴
1.63 1.98
Froude number (density — initiation) Fr% 2.28 2.08 1.87
0.52 0.48
0.70 0.30
of 1.45 m at initiation and 1.25 m at deposition. Flow was initially down a slope of 12.3 – 13.3° with flow termination at 0.9° (Table 3). Flow initiation velocity was calculated as 7.78 m/s (Table 3). The maximum flow velocity for flow dissipation was calculated to be 2.11 m/s. Using the equations of Johnson (1970) (Table 2), the yield stength (k) was calculated to be 1.78×10⁴
dynes/cm2 (Table 3). This yield srength is
consis-tent with cohesionless debris flows of similar thicknesses studied by Kessler and Moorhouse (1984). The densiometric Froude number for the initiation flow velocity of 7.78 m/s was 1.87, which indicates supercritical, semi-turbulent con-ditions at flow commencement. A densiometric Froude number of 0.51 was computed for the depositional flow velocity 2.11 m/s suggests lami-nar flow at this time. Such conditions are consis-tent with the formation of crude inverse grading in cohesionless debris flows, just before or at deposition.
Flow unit 2 from 21.5 to 23.3 m in the mea-sured section has an amalgamation surface at its base and carries large basaltic slabs (tens of me-ters in length) at its top. As mentioned, these slabs were initially carried downslope by debris avalanches and advanced further either by sliding over or being carried by newly formed proto-de-bris flows (Fig. 5C,D, Fig. 6). For purposes of flow property calculations, it is assumed that these slabs were carried by flow unit 2. Below these slabs, the main body of flow unit 2 is interpreted as a proto-debris flow with crude inverse grading and 20+cm thick clasts supported at its top. The matrix between cobble and boulder clasts in this flow consists of small cobble, gravel, and granular size basaltic material. A flow density of 2.36 was calculated with initiation and depositional thick-nesses of 2.52 and 2.16 m, respectively (Table 3). Flow movement initiated down a slope of 12.8 – 16.7° with deposition commencing on a maximum slope of 0.6°. Flow initiation velocity was calcu-lated at 6.22 m/s with initial deposition being possible at 2.87 m/s (Table 3). Debris flow yield strength was 5.18×10⁴ dynes
/cm2, approximately
three times that of flow unit 1. The densiometric Froude number for the initiation flow velocity in flow unit 2 was 0.95 indicating non-turbulent,
generally laminar flow conditions. Such condi-tions should be common in proto-debris flows where a very coarse matrix separates large clasts, and continued downslope movement is as a gran-ular flow with clast (especially matrix) grinding and crushing leading to size reduction (Savage, 1979).
Flow unit 3 from 26.5 to 29.8 m is a complex flow unit consisting of monomict basalt breccia with rare zones of basaltic matrix (Figs. 4 and 8). At its base flow unit 3 is amalgamated with a primitive proto-debris flow (Fig. 7A, Fig. 8). It is overlain by a large basaltic slab that was either carried downslope on top of flow 3 or slid over it (Fig. 8). The flow unit is dominantly composed of angular boulders and cobbles ranging in diameter from 2.0 to 25.0 cm and having the appearance of angular jigsaw fit pieces (Fig. 7B). Based on clast size and appearance with a lack of matrix, the flow unit is interpreted as a debris avalanche deposit. Flow unit 3 has a flow density of 2.45 with an initiation thickness of 4.50 m (Table 3). At the beginning of deposition flow thickness was 3.80 m. Flow initiated on a slope ranging from 13.1 to 18.4° with deposition beginning on a slope of 0.4°. Flow initiation velocity was calculated at 28.87 m/s with initial deposition being possible when the flows slows to 7.90 m/s on a lower slope (Table 3). Flow yield strength was calculated as 5.98×10⁴ dynes
/cm2, but is not be applicable if
flow unit 3 is not a debris flow with a clast support mechanism. The densiometric Froude number was calculated to be 3.17 for the initiation flow velocity and 0.90 for the depositional flow velocity. These high velocities and densiometric Froude numbers suggest highly turbulent flow conditions well beyond those expected for either proto- or cohesionless debris flows in a submarine setting. Comparable submarine velocities (20+
m/s) have been measured from cable breaks and modeled by various workers for debris slides/
information and modeling by Mulder (1994) and Mulder et al. (1997) indicate initial velocities ranging from 36 to 43 m/s for slide, avalanche, and debris flow movement in the Var Canyon. The debris flow movement described here is prob-ably similar to our debris avalanche movement. Depending on assumptions about flow viscosity, slide/avalanche initiation velocity may have been as high as 65 m/s (Mulder et al., 1997). The high slide/avalanche velocities mentioned above in the Var example are the result of supercritical flow down steep slopes ranging from 12 to 17°, not unlike the 13.1 – 18.4° computed for flow unit 3. The high calculated value for initiation velocity obtained for flow unit 3 by using Takahashi’s equations would suggest that this method applies to both debris flows and avalanches and is capa-ble of yielding the high velocities and Froude numbers expected in the latter. Study of further examples from the Upper Debrite and other simi-lar sequences in the future may help define a velocity and Froude number range between avalanches and debris flows.
5.3. De6il’s Splitting Table — cohesionless debris flows
Five flow units in the Devil’s Splitting Table measured section were selected for calculation of flow thickness, slope, and velocity at flow initia-tion and depositon (Figs. 10, 11, and 13, Table 4). These flows (numbered 1 – 5 in Table 4) are all cohesionless debris flows carrying cobble and boulder clasts with a well-developed matrix of medium to fine grained sand with rare muddy zones. With the exception of flow unit 3 (Figs. 11 and 12C) which has a chaotic clast distribution, these deposited cohesionless debris flows all show some degree of inverse grading. Flow unit 1 from 0.2 to 0.8 m in the measured section is inversely graded with basaltic clasts up to 25 cm diameter at its top (Fig. 12A). At its base the flow unit fills a scour in an underlying cross-bedded flow. Flow 1 had a calculated flow density of 2.15 with a flow thickness of 1.03 m at initiation and 0.80 m at deposition. Flow was initially down a slope of 9.8 – 11.8° with flow termination at 1.1° (Table 4). Flow initiation velocity was calculated at 5.86 m/s
with initial deposition being possible at 1.33 m/s (Table 4). Debris flow yield strength was 1.05×
104 dynes
/cm2. The densiometric Froude number
for the initiation flow velocity in flow unit 1 was 1.63 which indicates supercritical, but not neces-sarily turbulent flow conditions. Fr% for deposi-tional flow conditions was 0.37 which indicates subcritical laminar flow conditions. These condi-tions are consistent with the well developed in-verse grading observed in the outcrop. With the exception of a much higher initiation flow velocity (9.31 m/s) and densiometric Froude number (2.28) flow unit 2, an inversely graded cohesionless de-bris flow with larger clasts near its top, has similar flow properties to flow unit 1 (Fig. 11, Table 4).
Flow unit 3 from 5.5 to 7.3 m in the measured section has a highly disordered and chaotic, cob-ble and boulder, clast distribution in a sandy and silty matrix (Figs. 11 and 12C). The flow unit has a density of 2.23 with a flow thickness of 2.48 m at initiation and 2.18 m at deposition (Table 4). Flow initiated at a slope of 4.8 – 12.3° with deposi-tion commencing at 0.4°. The velocity at flow iniation was calculated as 12.32 m/s with a den-siometric Froude number of 2.08 (Table 4). The high velocity and densiometric Froude number indicate that this cohesionless debris flow was supercritical and likely turbulent at initiation. De-spite a velocity of 2.11 m/s at the beginning of deposition and a densiometric Froude number of 0.70, both indicating laminar flow conditions, there is little clast ordering upon the deposition of flow unit 3. Debris flow yield strength was 2.96×
104 dynes/cm2.
Flow unit 4 (10.48 – 11.35 m in the measured section) is a cohesionless debris flow with a very large clast (116×42 cm) supported at its top (Fig. 12D, Fig. 13). Calculated values for thickness, slope, and velocities are similar to those obtained for flow units 1 and 2 and little difference between the flows is apparent (Table 4). However, the yield strength for flow unit 4 is 6.98×10⁴ dynes
/cm2,
strength. In addition, other support mechanisms such as pore pressure and various buoyancy phe-nomena may effect this flow.
Flow unit 5 from 16.6 to 17.4 m in the mea-sured section is a channelized cohesionless debris flow which is inversely graded with a disordered distribution of basaltic clasts at its top (Figs. 13 and 14). This flow, which has a initiation velocity of 11.25 m/s and a densiometric Froude number of 1.98, occurs near the end of this cycle of Upper Debrite deposition and may represent some sort of partially turbulent surge event.
The cohesionless debris flows observed at Dev-il’s Splitting Table appear to be largely channel-ized as shown by the down-cutting erosional surfaces between some debris flow units (Figs. 11 and 12A,B). Though in part turbulent on initia-tion, most of the cohesionless debris flows ob-served here show at least some clast oganization on deposition. These channelized flows are the distal facies equivalent of upslope debris avalanches and proto-debris flows similar to those observed at Haggis Point. The matrix and rounded clasts in these flows have evolved from upslope debris avalanches and proto-debris flows through clast shattering, crushing, and grinding during downslope movement.
5.4. Another application of Takahashi’s equations
Kessler and Manspeizer (1994) examined two channelized, subaerial, cobble-boulder, medium grained sand to granular matrix, debris flows which crop out in the Upper Triassic/Lower Jurassic Passaic Formation along the western bor-der fault of the Newark Basin of SE New York State. These flows, which were mapped along their 12-km run-out, were analysed using the Takahashi (1978, 1981) equations for debris flow initiation and depositional slopes and velocities. Initiation slopes ranged from 10 to 12°. This high slope is no surprise, since provenance studies (boulders from the Rosetown dyke swarm to the north) show that the debris flows originated from a rift accomodation zone between the Newark and Hartford Basins (Ratcliffe, 1980). Deposi-tional slopes ranged from 1 to 2°. Calculated iniation velocities from near the sediment source
ranged from 9 to 12 m/s with depositional veloc-ities of 2 – 4 m/s. Froude numbers ranged from 1.15 to 1.78 suggesting the possibility of moderate turbulence at flow initiation. Generally laminar flow conditions are indicated at deposition by Froude numbers of 0.61 – 0.79 and the presence of inverse grading with large boulders at the top of each flow unit. The matrix of these two debris flow units contains angular quartzite and carbon-ate granules which were crushed and ground into finer material during downslope transport. Though these debris flows were subaerial, solu-tions to the Takahashi (1978, 1981) equasolu-tions suggest that similar types of downslope movement and deposition occurred in both the Upper Debrite and Newark Basin examples.
5.5. Implications of depositional mechanics
Fig. 15. Facies distribution in a proximal to distal, largely submarine, volcaniclastic (epiclastic) apron. Haggis Point (HP) conglomerates are in the proximal apron where debris avalanches and proto-debris flows are the dominant depositional mechanism. Devil’s Splitting Table (DSP) conglomerates are largely channelized and in the distal apron where cohesionless debris flows and turbidites are the dominant depositional mechanism. This figure was adapted from an unpublished report by Tomasz Dec (1994).
unit 1) have flow densities of 2.36 and 2.32, respectively, with similarly high yield strengths and depositional slopes (Table 3). However, flow unit 2 (the proto-debris flow) has a densiometric Froude number of 0.95, which indicates subcriti-cal, non-turbulent, generally laminar flow condi-tions. Such conditions are consistent with proto-debris flow movement where coarse matrix separates large clasts and continued downslope transport involves granular flow with clastic and matrix grinding and crushing. The cohesionless debris flows, which were analysed at Devil’s Split-ting Table, generally had lower initiation slopes which on the low end ranged from 4.8 to 10.4° (Table 4). These lower initiation slopes indicated a distal setting for these channelized cohesionless
debris flows (Fig. 15). Other flow parameters vary greatly for the cohesionless debris flows. Veloc-ities and yield strengths vary greatly depending on flow thickness, slope, maximum sizes of large supported clasts, and amount of cohesive support (Table 4).
6. Facies distribution in a volcaniclastic apron
Cousineau and Be´dard (2000) who observe thick (200+ m) sequences of pillow lavas and sheet flows with associated feeder sills in the Balsum Bud Cove Formation. These sequences are, in turn, overlain by the thick epiclastic debris avalanche and debris flow deposits examined in our study. These debrites are almost certainly derived from the underlying volcanics. Such a depositional site is consistent with flow initiation slope angles ranging from 12.3 to 18.4° which were calculated for debris avalanche, proto-debris flow, and primitive cohesionless debris flow de-posits at Haggis Point (Table 3). As is illustrated by Fig. 15, the debris avalanche material moves downslope with large clasts and blocks being crushed and fragmented during this non-coherent flow movement. Beginning further downslope where Haggis Point (HP) is shown in Fig. 15, flow units look more organized than the more proxi-mal debris avalanche deposits. Here proto-debris flows with crude inverse grading and gravel to small cobble matrix between cobble and boulder clasts begin to form after possible clast crushing and grinding during earlier debris avalanche movement (Fig. 9). Proto-debris flows were prob-ably deposited either in swales or crude scours on the edges of debris avalanche material. Further downslope where Devil’s Splitting Table (DSP) is shown in Fig. 15, channelized cohesionless debris flows are observed. Cohesionless debris flows con-sist of either inversely graded or chaotically bed-ded basaltic clasts with a matrix of fine to medium grained basaltic sand with varying amounts of silt. Within channels debris flows are either amal-gamated or scour into each other. Some channels in this lobate part of the epiclastic debrite apron contain massive bedded sandy turbidites with cross-bedded intervals of varying thickness. Thin sheets of basin plain turbidites and mudstone, which immediately overlie the debrites at Devil’s Splitting Table, are apparently distal to this chan-nelized and lobate zone (Figs. 10 and 15).
From the base of the measured section at Hag-gis Point to the top of the section at Devil’s Splitting Table, the depositional setting becomes more distal (Figs. 4 and 10). Debris avalanche and proto-debris flow deposits grade upward into channelized cohesionless debris flows and thin
basin plain turbidites. These vertical changes reflect changes in the location of debris avalanche origin, slope, and topography as deposition con-tinues. As time progresses, the source of basaltic clasts is exhausted and the debrite apron is aban-doned. This change is indicated at the boundary with basin plain turbidites at the top of the Dev-il’s Splitting Table section.
A volcanic sedimentary fan on the submarine part of the La Fournaise volcano, Re´union Is-land, SW Indian Ocean has some similarities to the Upper Debrite deposits at Snooks Arm (Ollier et al., 1998). Sonar studies and coring show that the proximal fan contains sedimentary slides and debris avalanche deposits from 500 down to 2000-m water depth. Reworked finer sedi2000-mentry lobes are seen to be just distal to the debris avalanches. Since there seem to be some similarities to the Upper Debrite, at least in facies distribution, the 1500 m of slide/avalanche change in water depth can be used to roughly estimate potential flow run-out of the analysed flows at Haggis Point and Devil’s Splitting Table. Using the sine of com-puted flow initiation angles for the debris avalanche, proto-debris flow, and primitive cohe-sionless debris flow studied at Haggis Point, a range of flow run-out distances from 4753 to 7042 m was calculated. At Devil’s Splitting Table flow run-out distances for cohesionless debris flows were further, ranging from 6205 to 11 750 m using this method. These larger values resulted from lower flow initiation angles, inclusion of the chan-nelized lobate part of the apron system, and possi-bly greater flow efficiency of cohesionless debris flows. The values for flow run-out in the Upper Debrite are essentially estimates, but seem reason-ably consistent with the La Fournaise example and smaller landslides with debris flow character-istics studied by Iverson (1997).
7. Summary and conclusions
avalanche to cohesionless debris flow processes in a submarine setting (Fig. 9). The mostly monom-ict basaltic rocks studied here represent a rare opportunity to study a system where clast and matrix material densities are always the same, allowing for easy and accurate calculation of flow parameters such as flow density, initiation slope, velocity, and yield strength. In addition, this study helps the volcanic worker better understand the dynamics and results of the marine sedimentary processes which alter now cooled eruptives.
Conclusions about the deposits observed are as follows:
1. Cycles of submarine debrite emplacement show a complex downslope evolution from highly fractured and disordered clasts of de-bris avalanche origin to clast and matrix sup-ported debris flows.
2. Downslope debris avalanche deposits evolve into proto-debris flows where cobble and boulder size clasts are carried in a gravel to small cobble matrix. Proto-debris flows are crudely inversely graded and represent the first stage of matrix formation due to clast crushing and grinding under granular flow conditions (Haggis Point).
3. Basalt slabs (tens of meters in length) may slide over (causing clast shattering, bed con-tortion, Neptunian dykes) or be supported and ride downslope on debris avalanches or proto-debris flows (Haggis Point).
4. Debris avalanche and proto-debris flow de-posits as observed at Haggis Point indicate deposition in the proximal part of a debrite apron, perhaps in an upslope feeder valley. 5. Overlying channelized debris flows are either
crudely inversely graded or have a disorga-nized clast distribution with a medium to fine grained basaltic sand size matrix. The princi-pal support mechanism in debris flows of this sort is thought to be inertial grain interac-tion. Such flows are referred to as cohesion-less debris flows and can support large outsize clasts (Devil’s Splitting Table). 6. Scour surfaces between individual and
amal-gamated cohesive debris flows in the Devil’s Splitting Table section suggest their deposi-tion in channels in the lobate distal part of a
debrite apron. Associated tractive sand and sandy turbidite channel fills are also observed in this part of the apron (Devil’s Splitting Table).
7. Since the both the Ordovician and Archean are characterized by intense arc-related vol-canism and high relative sea level, the epiclas-tic basalepiclas-tic debrite sequence in the Balsum Bud Cove may be a useful analogue (espe-cially in a paleogeographic context) to similar deposits in the Archean.
The second part of this study involved the measurement, estimation, and calculation of such flow parameters as flow density, flow initiation and depositional thicknesses, slopes, and veloc-ities; flow yield strengths, and densiometric Froude numbers in an effort to better understand flow evolution. Equations from Takahashi (1978, 1981) were used for slope and velocity calcula-tions with the results being realistic for avalanches and debris flows and consistent with other analy-ses. Conclusions from these results included:
8. High initiation flow velocity and densiometrc Froude number (28.87 m/s and 3.17, respe-cively) for a debris avalanche flow unit at Haggis Point suggest highly turbulent flow conditions, unlikely with debris flow move-ment. This velocity is similar to initiation flow velocities for other submarine debris slides/avalanches.
9. Based on a sub-critical densiometric Froude number, laminar, generally non-turbulent flow conditions are suggested for a proto-de-bris flow at Haggis Point. Such conditions are consistent with flow movement where coarse matrix separates large clasts and fur-ther downslope transport involves granular flow with continued clast and matrix grinding and crushing.
on other factors like flow density, flow thick-ness, maximum size of large supported clasts, and amount of cohesive support.
Acknowledgements
The authors wish to acknowledge logistical as-sistance from Ray Wimbleton of Snooks Arm. We thank Pierre Cousineau (University of Que´bec at Chicoutimi) and Kirsten Oravec for their help in the field. Financial support was from Marathon Oil Company (LGK) and the Geological Survey of Canada (JHB). We wish to acknowledge the previous work of Tomasz Dec, Petroleum Consul-tant, Calgary, Alberta, who examined and de-scribed parts of the Upper Debrite section during a 1994 field study. He first recognized the presence of cohesionless debris flows in the section.
References
Bagnold, R.A., 1954. Experiments on a gravity-free dispersion of large solid spheres in a Newtonian fluid under shear. Proc. R. Soc. Lond. Ser. A 225, 49 – 63.
Beard, D.C., Weyl, P.K., 1973. Influence of texture on poros-ity and permeabilporos-ity of unconsolidated sand. Am. Assoc. Petrol. Geol. Bull. 57, 349 – 369.
Be´dard, J.H., Lauzie`re, K., Boisvert, E´ ., Sangster, A., Tellier, M., Tremblay, A., Dec, T., 1999. Geologic map of the Betts Cove Ophiolitic Massif and its cover rocks. Geologi-cal Survey of Canada, Map 1969 A, 1:20 000 sGeologi-cale. Be´dard, J.H., Lauzie`re, K., Tremblay, A., Sangster, A., Dec,
T., 2000. Betts Cove Ophiolite and its cover rocks. Geol. Surv. Can. Bull., 550, in press.
Cas, R.A.F., Wright, J.V., 1987. Volcanic Successions-Modern and Ancient. Allen and Unwin, London, p. 582. Chen, C., 1987. Comprehensive review of debris flow modeling
concepts in Japan. In: Costa, J.E., Wieczorek, G.F. (Eds.), Debris Flows/Avalanches: Process, Recognition, and Miti-gation: Geological Society of America Reviews in Engi-neering Geology, vol. 7, pp. 13 – 30.
Costa, J.E., Williams, G.P., 1984. Debris flow dynamics. U.S. Geological Survey, Open-File Report 84-606, (videotape). Cousineau, P.A, Be´dard, J.H., 2000. Sedimentation in a
sub-aqueous arc/back-arc setting: The Bobby Cove Formation, Snooks Arm Group, Newfoundland. Precambrian Res. 101, 111 – 134.
Dunning, G.R., Krogh, T.E., 1985. Geochronolgy of ophio-lites of the Newfoundland Appalachians. Can. J. Earth Sci. 22, 1659 – 1670.
Fryer, P., Fujimoto, H., Sekine, M., Johnson, L.E., Kasha-hara, J., Masuda, H., Gamo, T., Ishi, T., Ariyoshi, M., Fujioka, K., 1998. Volcanoes of the southwestern exten-sion of the active Mariana island arc: new swath mapping and geochemical studies. Isl. Arc 7, 596 – 607.
Hampton, M.A., 1975. Competence of fine grained debris flows. J. Sediment. Petrol. 49, 834 – 844.
Hampton, M.A., 1979. Buoyancy in debris flows. J. Sediment. Petrol. 49, 753 – 758.
Heezen, B.C., Ewing, M., 1952. Turbidity currents and sub-marine slumps and the 1929 Grand Banks earthquake. Am. J. Sci. 250, 849 – 873.
Hibbard, J.P., 1983. Geology of the Baie Verte Peninsula, Newfoundland. Newfoundland Department of Mines and Energy, Memoir 2, pp. 279.
Hiscott, R.N., James, N.P., 1985. Carbonate debris flows, Cow Head Group western Newfoundland. J. Sediment. Petrol. 55, 735 – 745.
Iverson, R.M., 1997. The physics of debris flows. Rev. Geophys. 35, 245 – 296.
Johnson, A.M., 1970. Physical Processes in Geology. Freeman and Cooper, San Francisco 577 pp.
Kessler, L.G., Moorhouse, K., 1984. Depositional processes and fluid mechanics of Upper Jurassic conglomerate accu-mulations, British North Sea: In: E.H. Koster and R.J. Steel, (Eds.), Sedimentology of gravels and conglomerates: Canadian Society of Petroleum Geologists, Memoir 10, 383 – 398.
Kessler, L.G., Manspeizer, W., 1994. Depositional mechanics of channelized sand matrix debris flows, Upper Triassic/
Lower Jurassic Passaic Formation, Newark Basin, Laden-tow /Suffern area, New York: Geological Society of America, Northeastern Section. Abstracts with Programs 26, 28.
Kessler, L.G., Prave, A.R., 1998. Multi-directional and domal bedforms in Middle Ordovician turbidity current deposits, Que´bec and Newfoundland: evidence of complex flow transformations before deposition: Sediment Transport and Deposition by Particulate Gravity Currents Confer-ence, Leeds University, UK, Geological Society of Lon-don, Program and Abstract Volume, p. 76.
Kim, S.B., Chough, S.K., Chun, S.S., 1995. Bouldery deposits in the lowermost part of Cretaceous Kyokpori Formation, SW Korea: cohesionless debris flows and debris falls on a steep gradient delta slope. Sediment. Geol. 98, 97 – 119. Kirwin, A.D., Doyle, L.J., Bowles, W.D., Brooks, G.R., 1986.
Time dependent hydrodynamic models of turbidity cur-rents analyzed with data from the Grand Banks and Orleansville events. J. Sediment. Petrol. 56, 379 – 386. Kuenen, P., 1952. Estimated size of the Grand Banks turbidity
current. Am. J. Sci. 250, 849 – 873.
Mulder, T., 1994. La vitesse de turbidite´ de 1979 a` Nice, apports de la mode´lisation. Comptes Rendus. Acad. Sci., Paris, 317 (Ser. II), 1449 – 1455.
Ollier, G., Cochonat, P., Le´nat, J.F., Labuazuy, P., 1998. Deep-sea vocaniclastic sedimentary systems: an example from La Fournaise volcano, Re´union Island, Indian Ocean. Sedimentology 45, 293 – 330.
Pierson, T.C., 1981. Dominant particle support mechanisms in debris flows at Mt. Thomas, NewZealand and its implication for flow mobility. Sedimentology 28, 49 – 60.
Piper, D.J.W., Farre, J.A., Shor, A.N., 1985. Late Quaternary slumps and debris flows on the Scotian Slope. Bull. Geol. Soc. Am. 96, 1508 – 1517.
Ratcliffe, N.M., 1980, Brittle faults (Ramapo Fault) and phyl-lonitic ductile shear zones in the basement rocks of the Ramapo seismic zones, New York and New Jersey, and relation ship to current seismicity. In: W. Manspeizer (Ed.), Field Studies of New Jersey and Guide to Field Trips. 52nd Annual Meeting of the New York State Geological Associ-ation, pp. 278 – 311.
Savage, S.B., 1979. Gravity flow of cohesionless granular materials in chutes and channels. J. Fluid Mech. 92, 53 – 96.
Shultz, A.W., 1984. Subacqueous debris flow deposition in the
Upper Paleozoic Cutler Formation, western Colorado. J. Sediment. Petrol. 54, 759 – 772.
Takahashi, T., 1978. Mechanical characteristics of debris flow. J. Hydraul. Div. Am. Soc. Civ. Eng. 104, HYB 8, 1153 – 1159.
Takahashi, T., 1981. Debris flow. Ann. Rev. Fluid Mech. 13, 57 – 77.
Takahashi, T., personal communication, 1998.
Takahashi, T., Barree, R.D., personal communication, 1998. Williams, H., 1979. The Appalachian orogen in Canada. Can.
J. Earth Sci. 16, 792 – 807.
Williams, H., Colman-Sadd, S.P., Swinden, H.S., 1988. Tectonic subdivisions of Central Newfoundland: Current Research, Part B, Geological Survey of Canada, Paper 88-1B, 91 – 98. Williams, S.H., 1992. Lower Ordovician (Arenig-Llanvirn) graptolites from the Notre Dame Subzone, central New-foundland. Can. J. Earth Sci. 29, 1717 – 1723.
Yarnold, J.C., 1993. Rock-avalanche characteristics in dry climates and the effect of flow into lakes: insights from mid-Tertiary sedimentary breccias near Artillery Peak, Ari-zona. Geol. Soc. Am. Bull. 105, 345 – 360.