April 2010
Consumer Confidence Index (CCI) in April 2010 moved higher
by 3.3 points over previous month to 110.7. Continuing
positive trend on economic condition was reckoned took
apart in upwarding CCI.
Pressures on prices for the next 3 months were predicted to
hardening as indicated by 3.5 points higher on price
expectation index over previous month. The government’s
plan on increasing basic electricity tariff in July 2010 was
deemed triggered the respondent’s expectation over the
prices in the next 3 months. Conversely, pressures on prices
in the next 6 months were believed to drop 1.8 points
considering seasonal factor due to the last of Eid-ul Fitr
celebration.
Consumer Confidence Index
Sustained strengthening trend since March 2010, the CCI in
April 2010 stepped up by 3.3 points.
Based on Bank Indonesia Consumer
Survey in April 2010, CCI elevated by 3.3 points to 110.7 over previous
month.
Graph 1. Consumer Confidence Index
60.0
70.0
80.0
90.0
100.0
110.0
120.0
130.0
140.0
1 2 3 4 5 6 7 8 9 10 11 12 1 2 3 4 5 6 7 8 9 10 11 12 1 2 3 4
2008 2009 2010
(Index)
Current Economic Condition Index
Consumer Expectation Index
Consumer Confidence Index
Optimistic
Pesimistic
CONSUMER SURVEY
Consumer Confidence Index
boosted up
Methodology
The improvement on Consumer’s confidence was endorsed by
favorable consumer’s perception over both current economic condition and
the expectation for the following 6 months. Sustained economic development
as shown by better economic indicators such as stable exchange rate,
moderate inflation, and terracing foreign exchange reserves have endorsed
the CCI to accelerate and eventually raised tendency on household
expenditures.
Consumers concluded that current economic condition is
surpassed the same period in the last year
, as CCI grew 8.2 points to
110.7. The rising CCI was due to respondent’s confidence over current
economic condition and the expectation for the next 6 months. The reading
added by 11.4 and 4.9 points respectively.
Current Economic Condition Index
Current economic condition rated more expansive compared
with the previous month.
Current Economic Condition Index (CECI) in April
2010 stayed at 99.6, or 3.2 points higher from prior period. Respondents
stated that the upwarding index was substantially driven by the increasing on
their income and more prospective on job availability. Respondents also
claimed that current time is appropriate to consume durable goods.
Similar condition also took place on annual Current Economic
Condition Index (CECI)
that
boosted up 11.4 points over last year. The
increasing CECI was related to respondents who become optimistic over the
wider job availability as shown by the index which mounted by 14.8 points.
In
line with improving job availabilities, respondents also stated that their income
rose accordingly the current time is proper to consume durable goods.
Graph 2. Current Economic Condition Index (CECI)
0.0 20.0 40.0 60.0 80.0 100.0 120.0 140.0
1 2 3 4 5 6 7 8 9 10 11 12 1 2 3 4 5 6 7 8 9 10 11 12 1 2 3 4
2008 2009 2010
Current Economic Conditions Index Buying Durable Goods Conditions Job Availability Current Incomes
(Index)
Current economic condition
Consumer Expectation Index
Consumer expectation index grew stronger.
The strengthening
optimism was reflected from 3.2 points of rising index over previous month.
Such advancing index was mainly supported by respondents’ expectations
that economic condition would be more expansive in the next 6 months as
proven by the index which rose 4.5 points. As the economic condition
convicted to more favorable, job prospects and income were also expected to
be higher. The indexes gained each by 3.9 and 1.4 points respectively.
Graph. 3
Consumer Expectation Index (CEI)
0.0 20.0 40.0 60.0 80.0 100.0 120.0 140.0 160.0
1 2 3 4 5 6 7 8 9 10 11 12 1 2 3 4 5 6 7 8 9 10 11 12 1 2 3 4
2008 2009 2010
Index
Consumer Expectation Index Incomes Expectation
Economic Expectation Job Availability Expectation
Compared to the same period over last year, respondents also
showed a brighter optimism.
The height expectations were seen from
better respondent’s appraisement over economic condition, job prospects,
and incomes expectation in the next 6 months. The index rose by 1.5; 7.6,
and 5.8 points respectively.
Income Expectations
Consumers believed that their income would hike in 6 months
ahead.
The expectation was seen from income expectation index which
advanced 1.4 points from previous month. Classified by expenditure,
respondents who spent Rp1 million – Rp3 million have the highest expectation
towards their income among others. In the meantime, based on ages, those
who classified between 20-40 years old have the strongest conviction on their
rising income in the next 6 months ahead.
Consumers are upbeated on
economic condition in the
next 6 months
Price Expectations
Pressure on prices in the next 3 months were predicted to be
moderately higher,
as the price expectation index bounced from 155.1 to
158.6. The government’s plan on hiking electricity tariff in July 2010 was
deemed to drive increasing respondents’ expectations. This period survey also
confirmed that the highest upward on price expectation for the next 3 months
mainly on housing, electricity, gas and fuels group which the index added by
7.2 points.
Conversely, pressures on prices for the next 6 months were
predicted to loose.
Price expectation index in the next 6 months
dropped 1.8
points from preceding month. Clothing group was envisaged will suffered the
most due to seasonal factor post Eid-ul Fitr celebration and the index was 2.8
points lower.
Graph 4.
Price Expectation Index for the next 3 and 6 months
‐1.00 0.00 1.00 2.00 3.00 4.00 5.00 6.00
130.0 140.0 150.0 160.0 170.0 180.0 190.0 200.0
1 2 3 4 5 6 7 8 9 10 11 12 1 2 3 4 5 6 7 8 9 10 11 12 1 2 3 4 5 6 7 8 9 10
2008 2009 2010
Price Expectation Index 3 months ahead Price Expectation Index 6 months ahead Cummulative Inflations in 3 months
Index
Notes
: Index = 100 indicates that consumer expect prices will still be stable, index > 100 indicates
consumer expect prices will increase, and index < 100 indicates consumer expect prices will decrease
Expectations of Savings and Interest Rates
Interest rates in the next 6 months were decelerated, however,
saving expectation index remained advanced.
This month’s survey
showed that interest rates index in the next 6 months laid at 0.8 point lower
than the last survey. On the contrary, saving index achieved 0.8 point against
previous month as the respondents were sanguine that economic condition in
the next 6 months would expand.
Pressure on prices in the
next 3 months will
moderately increase
Graph. 5
Expectation Indexes on Interest Rates and Total Savings in the next 6 months
0 5 10 15 20 25
90 100 110 120 130 140
1 2 3 4 5 6 7 8 9 10 11 12 1 2 3 4 5 6 7 8 9 10 11 12 1 2 3 4 5 6 7 8 9 10
2008 2009 2010
Savings Growth in 6 months
Interest Rates Expectation Index in 6 months ahead Savings Expectation Index in 6 months ahead
Index (%)
Notes
: Index = 100 indicates that consumer expect saving deposit and interest rate will still be
stable, index > 100 indicates consumer expect saving deposit and interest rate will increase, and
index < 100 indicates consumer expect saving deposit and interest rate will decrease
Expectations on Economic Conditions
Respondents were more confidence on better economic condition
in the next 6 months.
Respondent’s expectation on economic condition
persisted to get stronger since March 2010 as the index obtained 4.5 points to
122.2. The upward index was predominantly supported by expectation from
academy graduate.
Economic condition
Table 1. Consumer Confidence, Price Expectations, Consumption Plans, and Economic Indicators (Index)
2008
Dec Jan Feb Mar Apr May Jun Jul Aug Sep Oct Nov Dec Jan Feb Mar Apr
A Consumer Confidence Index (CCI) 90.6 92.8 96.4 98.6 102.5 105.9 109.1 115.4 114.3 110.8 110.0 111.0 108.7 110.5 105.3 107.4 110.7
Present Situation (CECI) 78.4 79.7 82.7 86.2 88.2 91.0 94.5 98.6 100.5 96.6 96.8 97.7 96.7 98.4 94.7 96.4 99.6
Expectations (CEI) 102.9 105.9 110.0 111.0 116.8 120.9 123.7 132.3 128.2 125.1 123.2 124.3 120.7 122.6 115.9 118.5 121.7
Appraisal of Present Situation
Current Incomes 110.8 112.0 114.6 117.6 121.1 123.2 124.2 129.5 127.5 124.0 124.9 124.1 123.1 125.5 118.6 121.7 126.1
Buying durable goods Conditions 64.3 64.8 68.7 73.8 73.0 74.5 78.0 83.7 87.6 81.3 82.2 84.9 81.1 85.2 87.3 85.3 87.5
Employment Conditions 60.2 62.4 64.8 67.2 70.5 75.3 81.2 82.5 86.3 84.5 83.2 84.1 85.8 84.5 78.0 82.1 85.3
(before Oct 2004: Unemployment Condition)
Expectations for 6 Months Hence of
Incomes 128.1 130.3 131.3 131.2 130.9 136.4 135.2 142.9 138.3 138.5 137.3 139.3 136.8 141.1 132.5 135.3 136.7
Economic Conditions 104.1 107.9 113.6 112.6 120.7 126.6 130.5 138.9 135.4 130.4 127.3 128.8 122.1 122.7 114.4 117.7 122.2
Employment Conditions 76.4 79.4 85.2 89.1 98.7 99.7 105.2 115.1 110.7 106.4 105.1 104.8 103.1 103.9 100.8 102.4 106.3
(before Oct 2004: Unemployment Expectation)
B Price Expectations for 3 Months Hence of
Prices 154.7 143.8 140.9 150.9 148.1 150.5 154.5 154.8 163.8 165.2 158.8 159.9 161.0 160.6 160.2 155.1 158.6
Foodstuff 154.3 145.3 144.3 153.1 148.1 152.0 156.5 158.2 168.2 167.0 160.8 160.6 163.0 163.5 163.4 156.0 159.6
Food, beverages, cigarettes and tobacco 151.6 144.4 141.5 150.3 144.3 147.8 151.8 151.3 161.0 161.0 154.9 155.8 157.2 156.4 155.0 149.9 153.5
Housing, electricity, gas and fuel 139.2 126.4 122.4 133.1 136.2 141.0 141.5 141.6 148.8 155.2 156.0 156.6 156.3 152.0 151.5 148.1 155.3
Clothing 136.8 127.7 125.8 132.3 130.7 134.2 139.5 142.5 152.7 150.2 138.6 139.3 138.0 135.5 136.4 131.2 133.7
Health 139.0 131.3 127.9 133.0 132.0 134.0 135.5 132.1 139.6 140.6 135.4 136.6 137.9 135.9 136.1 133.9 133.6
Transportations, communications and financial services 134.2 116.4 108.3 122.4 126.9 132.3 135.5 136.7 145.6 146.9 142.6 142.2 141.4 137.5 137.9 134.3 136.4
Education, recreation, and sports 139.2 133.7 128.6 136.1 133.3 134.8 138.4 135.3 141.1 141.3 137.3 139.0 140.0 138.0 137.2 138.2 141.4
C Price Expectations for 6 Months Hence of
Prices 156.8 147.5 146.7 153.7 152.6 154.0 154.5 152.2 156.5 156.9 156.2 157.9 158.8 161.2 164.3 161.1 159.3
Foodstuff 156.2 146.5 148.9 155.3 151.9 155.9 154.9 154.2 160.0 158.2 158.4 158.4 160.5 162.1 166.0 161.7 160.5
Food, beverages, cigarettes and tobacco 153.3 144.8 145.7 151.7 149.4 152.3 152.1 149.9 155.0 153.4 154.3 154.4 154.9 156.9 158.9 156.7 154.5
Housing, electricity, gas and fuel 142.8 131.8 132.2 140.2 143.0 144.1 144.5 142.0 148.5 150.8 154.3 155.7 155.4 153.2 153.1 148.6 154.1
Clothing 140.6 129.5 130.9 137.9 136.6 140.8 141.9 139.0 144.0 141.7 137.4 140.5 139.9 140.1 144.4 143.1 140.3
Health 141.9 133.9 130.7 136.2 135.4 137.7 136.6 132.5 139.0 140.2 136.7 138.1 138.9 140.0 140.8 136.7 137.2
Transportations, communications and financial services 138.6 123.4 117.9 130.5 133.7 138.0 138.9 136.9 143.2 143.4 143.9 142.6 143.9 142.8 145.5 143.6 144.9
Education, recreation, and sports 145.8 138.7 136.4 141.0 139.0 139.0 139.8 134.9 139.8 141.0 138.6 143.1 144.7 146.2 147.7 145.3 144.2
D Economic Indicator within 6 Months
Avaibility of Goods & Services 118.7 116.1 121.2 120.4 123.7 130.9 134.0 137.2 140.0 138.6 136.4 132.7 133.5 138.3 134.2 135.5 137.6
Interest Rate 114.8 111.5 111.0 113.4 112.3 110.6 114.2 115.8 117.7 115.2 113.3 115.4 116.3 117.9 114.9 117.0 116.2
Current savings 88.6 89.2 93.1 93.1 98.1 101.0 103.0 107.5 107.8 104.4 104.7 106.6 105.9 106.4 105.2 106.9 105.0
Savings for 6 months hence 110.3 112.7 114.4 115.7 118.8 121.0 121.6 129.9 127.6 125.0 125.9 128.2 126.7 129.8 125.6 126.2 127.0
2010
Descriptions 2009
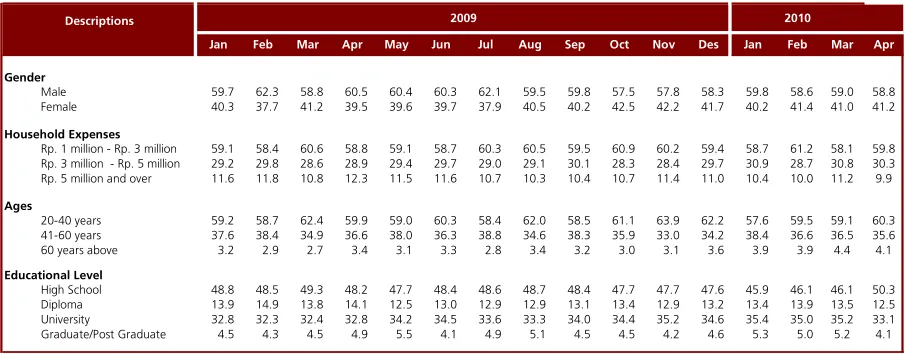
Table 2. Respondent Figures (percentages)
Jan Feb Mar Apr May Jun Jul Aug Sep Oct Nov Des Jan Feb Mar Apr
Gender
Male 59.7 62.3 58.8 60.5 60.4 60.3 62.1 59.5 59.8 57.5 57.8 58.3 59.8 58.6 59.0 58.8 Female 40.3 37.7 41.2 39.5 39.6 39.7 37.9 40.5 40.2 42.5 42.2 41.7 40.2 41.4 41.0 41.2
Household Expenses
Rp. 1 million - Rp. 3 million 59.1 58.4 60.6 58.8 59.1 58.7 60.3 60.5 59.5 60.9 60.2 59.4 58.7 61.2 58.1 59.8 Rp. 3 million - Rp. 5 million 29.2 29.8 28.6 28.9 29.4 29.7 29.0 29.1 30.1 28.3 28.4 29.7 30.9 28.7 30.8 30.3 Rp. 5 million and over 11.6 11.8 10.8 12.3 11.5 11.6 10.7 10.3 10.4 10.7 11.4 11.0 10.4 10.0 11.2 9.9
Ages
20-40 years 59.2 58.7 62.4 59.9 59.0 60.3 58.4 62.0 58.5 61.1 63.9 62.2 57.6 59.5 59.1 60.3 41-60 years 37.6 38.4 34.9 36.6 38.0 36.3 38.8 34.6 38.3 35.9 33.0 34.2 38.4 36.6 36.5 35.6 60 years above 3.2 2.9 2.7 3.4 3.1 3.3 2.8 3.4 3.2 3.0 3.1 3.6 3.9 3.9 4.4 4.1
Educational Level
High School 48.8 48.5 49.3 48.2 47.7 48.4 48.6 48.7 48.4 47.7 47.7 47.6 45.9 46.1 46.1 50.3 Diploma 13.9 14.9 13.8 14.1 12.5 13.0 12.9 12.9 13.1 13.4 12.9 13.2 13.4 13.9 13.5 12.5 University 32.8 32.3 32.4 32.8 34.2 34.5 33.6 33.3 34.0 34.4 35.2 34.6 35.4 35.0 35.2 33.1 Graduate/Post Graduate 4.5 4.3 4.5 4.9 5.5 4.1 4.9 5.1 4.5 4.5 4.2 4.6 5.3 5.0 5.2 4.1
2010
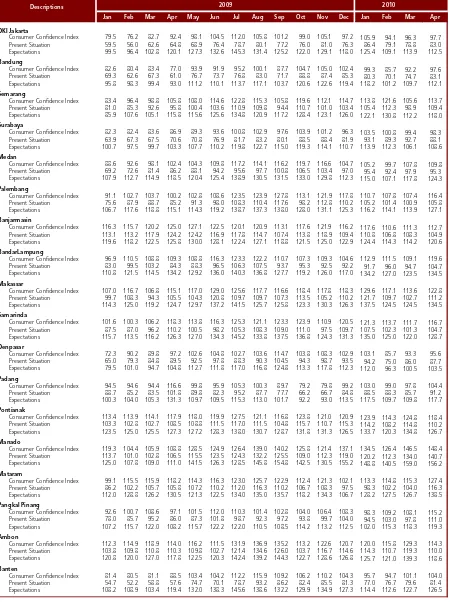
Table 3. Consumer Confidence by Region (Index)
Jan Feb Mar Apr May Jun Jul Aug Sep Oct Nov Dec Jan Feb Mar Apr
DKI Jakarta
Consumer Confidence Index 79.5 76.2 82.7 92.4 98.1 104.5 112.0 105.8 101.2 99.0 105.1 97.2 105.9 94.1 96.3 97.7 Present Situation 59.5 56.0 62.6 64.8 68.9 76.4 78.7 80.1 77.2 76.0 81.0 76.3 86.4 79.1 78.8 83.0 Expectations 99.5 96.4 102.8 120.1 127.3 132.6 145.3 131.4 125.2 122.0 129.1 118.0 125.4 109.1 113.9 112.5
Bandung
Consumer Confidence Index 82.6 80.4 83.4 77.0 93.9 91.9 95.2 100.1 87.7 104.7 105.0 102.4 99.3 85.7 92.2 97.6 Present Situation 69.3 62.6 67.3 61.0 76.7 73.7 76.8 83.0 71.7 88.8 87.4 85.3 80.3 70.1 74.7 83.1 Expectations 95.8 98.3 99.4 93.0 111.2 110.1 113.7 117.1 103.7 120.6 122.6 119.4 118.2 101.2 109.7 112.1
Semarang
Consumer Confidence Index 83.4 96.4 98.8 105.8 108.0 114.6 122.8 115.3 105.8 119.6 112.1 114.7 113.8 121.6 105.6 113.7 Present Situation 81.0 85.3 92.6 95.8 100.4 103.6 110.9 109.8 94.4 110.7 101.0 103.4 105.4 112.3 98.9 109.4 Expectations 85.9 107.6 105.1 115.8 115.6 125.6 134.8 120.9 117.2 128.4 123.1 126.0 122.1 130.8 112.2 118.0
Surabaya
Consumer Confidence Index 82.3 82.4 83.6 86.9 89.3 93.6 100.8 102.9 97.6 103.9 101.2 96.3 103.5 100.8 99.4 98.3 Present Situation 63.9 67.3 67.5 70.6 70.8 76.9 81.7 83.2 80.1 88.5 88.4 81.9 93.1 89.3 92.7 88.1 Expectations 100.7 97.5 99.7 103.3 107.7 110.2 119.8 122.7 115.0 119.3 114.1 110.7 113.9 112.3 106.1 108.6
Medan
Consumer Confidence Index 88.6 92.6 98.1 102.4 104.3 109.8 117.2 114.1 116.2 119.7 116.6 104.7 105.2 99.7 107.8 109.8 Present Situation 69.2 72.6 81.4 86.2 88.1 94.2 95.6 97.7 100.8 106.5 103.4 97.0 95.4 92.4 97.9 95.3 Expectations 107.9 112.7 114.9 118.5 120.4 125.4 138.9 130.5 131.5 133.0 129.8 112.3 115.0 107.1 117.8 124.3
Palembang
Consumer Confidence Index 91.1 102.7 103.7 100.2 102.8 108.6 123.5 123.9 127.8 113.1 121.9 117.8 110.7 107.8 107.4 116.4 Present Situation 75.6 87.9 88.7 85.2 91.3 98.0 108.3 110.4 117.6 98.2 112.8 110.2 105.2 101.4 100.9 105.8 Expectations 106.7 117.6 118.8 115.1 114.3 119.2 138.7 137.3 138.0 128.0 131.1 125.3 116.2 114.1 113.9 127.1
Banjarmasin
Consumer Confidence Index 116.3 115.7 120.2 125.0 127.1 122.5 120.1 120.9 113.1 117.6 121.9 116.2 117.6 110.6 111.3 112.7 Present Situation 113.1 113.2 117.9 124.2 124.2 116.9 117.8 114.7 107.4 113.8 118.9 109.4 110.8 106.8 108.3 104.9 Expectations 119.6 118.2 122.5 125.8 130.0 128.1 122.4 127.1 118.8 121.5 125.0 122.9 124.4 114.3 114.2 120.6
BandarLampung
Consumer Confidence Index 96.9 110.5 108.8 109.3 108.8 116.3 123.3 122.2 110.7 107.3 109.3 104.6 112.9 111.5 109.1 119.6 Present Situation 83.0 99.5 103.2 84.3 88.3 96.5 106.3 107.5 93.7 95.3 92.5 92.2 91.7 96.0 94.7 104.7 Expectations 110.8 121.5 114.5 134.2 129.2 136.0 140.3 136.8 127.7 119.2 126.0 117.0 134.2 127.0 123.5 134.5
Makassar
Consumer Confidence Index 107.0 116.7 106.8 115.1 117.0 129.0 125.6 117.7 116.6 118.4 117.8 118.3 129.6 117.1 113.6 122.8 Present Situation 99.7 108.3 94.3 105.5 104.3 120.8 109.7 109.7 107.3 113.5 105.2 110.2 121.7 109.7 102.7 111.2 Expectations 114.3 125.0 119.2 124.7 129.7 137.2 141.5 125.7 125.8 123.3 130.3 126.3 137.5 124.5 124.5 134.5
Samarinda
Consumer Confidence Index 101.6 100.3 106.2 118.3 113.8 116.3 125.3 121.1 123.3 123.9 110.9 120.5 121.3 113.7 111.7 116.7 Present Situation 87.5 87.0 96.2 110.2 100.5 98.2 105.3 108.3 109.0 111.0 97.5 109.7 107.5 102.3 101.3 104.7 Expectations 115.7 113.5 116.2 126.3 127.0 134.3 145.2 133.8 137.5 136.8 124.3 131.3 135.0 125.0 122.0 128.7
Denpasar
Consumer Confidence Index 72.3 90.2 89.8 97.2 102.6 104.8 102.7 103.6 114.7 103.8 108.3 102.9 103.1 85.7 93.3 95.6 Present Situation 65.0 79.3 84.8 89.5 92.5 97.8 88.3 90.3 104.5 94.3 98.7 93.5 94.2 75.0 86.0 87.7 Expectations 79.5 101.0 94.7 104.8 112.7 111.8 117.0 116.8 124.8 113.3 117.8 112.3 112.0 96.3 100.5 103.5
Padang
Consumer Confidence Index 94.5 94.6 94.4 116.6 99.8 95.9 105.3 100.3 89.7 79.2 79.8 99.2 103.0 99.0 97.8 104.4 Present Situation 88.7 85.2 83.5 101.8 89.8 82.3 95.2 87.7 77.7 66.2 66.7 84.8 88.5 88.3 85.7 91.2 Expectations 100.3 104.0 105.3 131.3 109.7 109.5 115.3 113.0 101.7 92.2 93.0 113.5 117.5 109.7 109.8 117.7
Pontianak
Consumer Confidence Index 113.4 113.9 114.1 117.9 118.0 119.9 127.5 121.1 116.8 123.8 121.0 120.9 123.9 114.3 124.8 118.4 Present Situation 103.3 102.8 102.7 108.5 108.8 111.5 117.0 111.5 104.8 115.7 110.7 115.3 114.2 108.2 114.8 110.2 Expectations 123.5 125.0 125.5 127.3 127.2 128.3 138.0 130.7 128.7 131.8 131.3 126.5 133.7 120.3 134.8 126.7
Manado
Consumer Confidence Index 119.3 104.4 105.9 108.8 128.5 124.9 126.4 139.0 140.2 125.8 121.4 137.1 134.5 126.4 146.5 148.4 Present Situation 113.7 101.0 102.8 106.5 115.5 123.5 124.3 132.2 125.5 109.0 112.3 119.0 120.2 112.3 134.0 140.7 Expectations 125.0 107.8 109.0 111.0 141.5 126.3 128.5 145.8 154.8 142.5 130.5 155.2 148.8 140.5 159.0 156.2
Mataram
Consumer Confidence Index 99.1 115.5 115.9 118.2 114.3 116.3 123.0 125.7 122.9 112.4 121.3 102.1 113.3 114.8 115.3 127.4 Present Situation 86.2 102.2 105.7 105.8 107.2 110.2 112.0 116.3 110.2 106.7 108.3 97.5 98.3 102.2 104.0 116.3 Expectations 112.0 128.8 126.2 130.5 121.3 122.5 134.0 135.0 135.7 118.2 134.3 106.7 128.2 127.5 126.7 138.5
Pangkal Pinang
Consumer Confidence Index 92.6 100.7 108.6 97.1 101.5 112.0 110.3 101.4 102.8 104.0 106.4 108.3 98.3 109.2 108.1 115.2 Present Situation 78.0 85.7 95.2 86.0 87.3 101.8 98.7 92.3 97.2 93.8 99.7 104.0 94.5 103.0 97.8 111.0 Expectations 107.2 115.7 122.0 108.2 115.7 122.2 122.0 110.5 108.5 114.2 113.2 112.5 102.0 115.3 118.3 119.3
Ambon
Consumer Confidence Index 112.3 114.9 118.9 114.0 116.2 111.5 131.9 136.9 135.2 113.2 122.6 120.7 120.0 115.8 129.3 114.3 Present Situation 103.8 109.8 110.8 110.3 109.8 102.7 121.4 134.6 126.0 103.7 116.7 114.6 114.3 110.7 119.3 110.0 Expectations 120.8 120.0 127.0 117.8 122.5 120.3 142.4 139.2 144.3 122.7 128.6 126.8 125.7 121.0 139.3 118.6
Banten
Consumer Confidence Index 81.4 80.5 81.1 88.5 103.4 104.2 112.2 115.9 109.2 106.2 110.2 104.3 95.7 94.7 101.1 104.0 Present Situation 54.7 52.2 58.8 57.6 74.7 70.1 78.7 93.2 86.2 82.4 85.5 81.3 77.0 76.7 79.6 81.4 Expectations 108.2 108.9 103.4 119.4 132.0 138.3 145.6 138.6 132.2 129.9 134.9 127.3 114.4 112.6 122.7 126.5
2010