1
Sivasampu S
National Medical Care Statistics 2014
January 2016©Ministry of Health Malaysia
Published by
The National Healthcare Statistics Initiative (NHSI) National Clinical Research Centre
National Institutes of Health 3rd Floor, MMA House 124, Jalan Pahang 53000 Kuala Lumpur Malaysia
Tel : (603) 4043 9300/9400 Fax : (603) 4043 9500 Email : [email protected]
Website : http://www.crc.gov.my/nhsi
This report is copyrighted. Reproduction and dissemination of this report in part or in whole for research, educational or non-commercial purposes is authorised without any prior written permission from the copyright holders, provided that the source is fully acknowledged.
Suggested citation:
Sivasampu S, Wahab YF, Ong SM, Ismail SA, Goh PP, Jeyaindran S. National Medical Care Statistics (NMCS) 2014. Kuala Lumpur: National Clinical Research Centre, National Healthcare Statistics Initiative; 2016. Report No.: NCRC/HSU/2016.1. NMRR Approval No. NMRR-09-842-4718. Supported by the Ministry of Health Malaysia.
This report is also available electronically on the website of the National Healthcare Statistics Initiative at http://www.crc.gov.my/nhsi
Funding:
The National Healthcare Statistics Initiative was funded by a grant from Ministry of Health Malaysia.
NMRR Approval No. NMRR-09-842-4718
Please note that there is potential for minor corrections of data in this report. Do check the online version at http://www.crc.gov.my/nhsi/ for any amendments. Thank you. ISSN 2289-1811
T
E OF CONTENTS
TABLE OF CONTENTS ... ii
LIST OF TABLES ... v
LIST OF FIG RES ... vii
ACKNOWLEDGEMENTS ... ix
NATIONA L MEDICAL CARE S RVY 2014 PROJECT TEAM ... x
A B BR VIATIONS ... xi
SYMBOLS ... xii
EXEC TIV S MMARY ... 1
CHAPTER 1 INTRO CTION ... 7
1.1 Background ... 8
1.2 Objectives ... 8
1.3 Definitions ... 9
1.4 Research Questions ... 10
CHAPTER 2 METHODOLOGY ... 11
2.1 Sample Size Calculation and Sampling Methods ... 12
2.2 Data Collection and Follow-Up ... 19
2.3 Research Pack and Questionnaire ... 19
2.4 Data Management ... 20
2.5 Data Analysis ... 25
2.6 Ethics Approval ... 27
2.7 Limitations ... 27
CHAPTER 3 RESPONSE RATE ... 29
3.1 Response Rate ... 30
3.2 The Encounters ... 32
CHAPTER 4 THE P RACTICES ... 33
4.1 Primary Care Clinics in Malaysia ... 34
4.2 Attendances ... 35
4.3 Operating Days and Hours ... 35
4.4 Type of Practice ... 36
iii
CHATE5 THE DOCTOS ... 41
5.1 Characteristics of the Doctors ... 42
5.2 Gender ... 44
5.3 Age Distribution ... 45
5.4 Experience ... 45
5.5 Place of Graduation ... 46
5.6 Postgraduate Qualification ... 47
5.7 Working Hours ... 48
CHATE 6 THE ATIENTS ... 49
6.1 Characteristics of the Patients ... 50
6.2 Age-Gender Distribution ... 53
6.3 Nationality and Ethnicity ... 54
6.4 Mode of Payment ... 56
6.5 Individual Income ... 56
6.6 Education Level ... 58
6.7 Medical Certificate and Duration of Sick Leave ... 58
CHATE EASONS FO ENCOUNTE ... 61
7.1 Number of Reasons for Encounter per Visit ... 62
7.2 Reasons for Encounter by ICPC-2 Components ... 63
7.3 Reasons for Encounter by ICPC-2 Chapters ... 65
7.4 Most Common Reasons for Encounter in Public and Private Clinics ... 67
CHATE8 DIAGNOSES ... 69
8.1 Number of Diagnoses per Encounter ... 70
8.2 Diagnoses by ICPC-2 Components ... 71
8.3 Diagnoses by ICPC-2 Chapters ... 72
8.4 Most Common Diagnoses Managed in Public and Private Clinics ... 75
CHATE 9 MEDICATIONS ... 9
9.1 Number of Medications Prescribed per Encounter ... 80
9.2 Types of Medications Prescribed ... 83
CHATE 10 INESTIGATIONS ... 9
10.1 Number of Investigations per Encounter ... 96
10.2 Types of Investigations Ordered ... 96
10.3 Most Frequently Ordered Investigations in Public and Private Clinics ... 99
10.4 Diagnoses with Investigations Ordered ... 100
CHATE 11 ADICE /C NSE ING AND OCE D ES ... 103
11.1 Number of Advice/Counselling and Procedures ... 104
11.2 Types of Advice/Counselling ... 105
11.3 Most Common Advice/Counselling Provided in Public and Private Clinics ... 106
11.4 Types of Procedures ... 108
11.5 Most Common Procedures Performed in Public and Private Clinics ... 109
11.6 Diagnoses with Advice/Counselling and Procedures ... 110
CHATE 12 FO OW-S AND EFEAS ... 113
12.1 Number of Follow-Ups and Referrals ... 114
12.2 Types of Referrals ... 115
12.3 Most Frequently Followed Up Diagnoses ... 116
12.4 Most Frequently Referred Diagnoses ... 117
ENDICES ... 119
Appendix 1: Additional Tables ... 120
Appendix 2: NMCS 2014 Primary Care Provider’s Profile Questionnaire ... 121
Appendix 3: NMCS 2014 Survey Form ... 122
Appendix 4: ICPC-2 and ICPC-2 PLUS groups ... 123
Appendix 5: Participants of NMCS 2014 ... 133
v
IST OF T
ES
Table 2.1.1 Sample size (primary sampling units) for NMCS 2014 ... 13
Table 2.1.2 Inclusion and exclusion criteria for the clinics sampled in the survey ... 14
Table 2.4.1 Data entry error rate for NMCS 2014 ... 22
Table 2.4.2 ICPC-2 chapters ... 23
Table 2.4.3 ICPC-2 components ... 24
Table 2.5.1 Strata according to state/region and sector ... 25
Table 3.1.1 Total number of clinics sampled and responded for NMCS 2014 ... 30
Table 3.1.2 Total number of encounters received for NMCS 2014 ... 31
Table 3.2.1 Observed and weighted dataset for NMCS 2014 ... 32
Table 4.3.1 Operating days and hours of public clinics in 2014 ... 35
Table 4.3.2 Operating days and hours of private clinics in 2014 ... 36
Table 4.4.1 Type of practice for private clinics in 2014 ... 36
Table 4.7.1 Healthcare workforce by sector in primary care clinics in 2014 ... 38
Table 5.1.1 Characteristics of primary care doctors in 2014 ... 43
Table 6.1.1 Characteristics of primary care patients in 2014 ... 51
Table 7.2.1 Reasons for encounter by ICPC-2 components in primary care clinics in 2014 ... 63
Table 7.2.2 Reasons for encounter by ICPC-2 components in public clinics in 2014 ... 64
Table 7.2.3 Reasons for encounter by ICPC-2 components in private clinics in 2014 ... 64
Table 7.3.1 Reasons for encounter by ICPC-2 chapters and the most common individual reasons for encounter within each chapter in primary care clinics in 2014 ... 65
Table 8.2.1 Diagnoses by ICPC-2 components in primary care clinics in 2014 ... 72
Table 8.3.1 Diagnosis by ICPC-2 chapters and the most common individual diagnoses within each chapter in NMCS 2014 ... 73
Table 8.4.1 Thirty most common diagnoses managed in public clinics in 2014 ... 76
Table 8.4.2 Thirty most common diagnoses managed in private clinics in 2014 ... 77
Table 9.1.1 Number of encounters with and without medical prescription in primary care clinics in 2014 ... 80
Table 9.1.2 Number of medications prescribed in primary care clinics in 2014 ... 81
Table 9.2.1 Prescribed medications by ATC levels in primary care clinics in 2014 ... 84
Table 9.2.2 Prescribed medications by ATC level 1 in public clinics in 2014 ... 88
Table 9.2.3 Prescribed medications by ATC level 1 in private clinics in 2014 ... 89
Table 9.3.1 Thirty most frequently prescribed medications in public clinics in 2014 ... 91
Table 9.3.2 Thirty most frequently prescribed medications in private clinics in 2014 ... 92
Table 10.2.1 Types of investigations by ICPC-2 process codes in primary care clinics in
2014 ... 97
Table 10.4.1 Top 10 diagnoses for which investigations were most frequently ordered in primary care clinics in 2014 ... 101
Table 11.1.1 Number of encounters managed with advice and counselling in primary care clinics in 2014 ... 104
Table 11.1.2 Number of encounters managed with procedures in primary care clinics in 2014 ... 104
Table 11.2.1 Types of advice and counselling provided in primary care clinics in 2014 ... 105
Table 11.4.1 Types of procedures provided in primary care clinics in 2014 ... 108
Table 11.6.1 Ten most common diagnoses managed with advice/counselling in primary care clinics in 2014 ... 111
Table 11.6.2 Ten most common diagnoses managed with procedures in primary care clinics in 2014 ... 112
Table 12.1.1 Visit dispositions of primary care patients by sector in 2014 ... 114
Table 12.2.1 Types of referrals in primary care in 2014 ... 115
Table 12.2.2 Types of referrals in public clinics in 2014 ... 116
Table 12.2.3 Types of referrals in private clinics in 2014 ... 116
Table 12.3.1 Top 10 diagnoses for follow-up in primary care in 2014 ... 117
vii
IST OF FIG
ES
Figure 2.1.1 Study design for NMCS 2014 ... 16
Figure 2.1.2 Consort diagram – public primary care clinics 2014 ... 17
Figure 2.1.3 Consort diagram – private primary care clinics 2014 ... 18
Figure 4.1.1 Number of primary care clinics per 10,000 population in 2012 ... 34
Figure 4.6.1 Types of computer use in primary care by sector in 2014 ... 37
Figure 4.7.1 Primary care clinics with family medicine specialists by sector in 2014 ... 39
Figure 5.2.1 Distribution of public and private doctors by gender in 2014 ... 44
Figure 5.3.1 Distribution of public and private doctors by age group in 2014 ... 45
Figure 5.4.1 Distribution of public and private doctors by years of experience in 2014 ... 46
Figure 5.5.1 Distribution of public and private doctors by place of graduation in 2014 ... 47
Figure 5.6.1 Distribution of public and private doctors by postgraduate qualification in 2014 ... 48
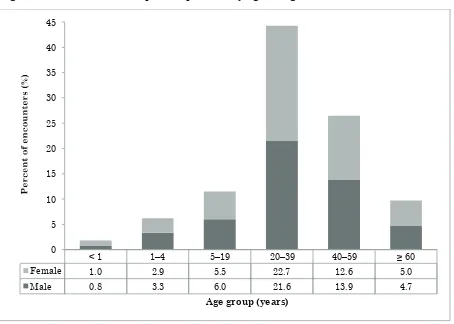
Figure 6.2.1 Distribution of public patients by age and gender in 2014 ... 53
Figure 6.2.2 Distribution of private patients by age and gender in 2014 ... 54
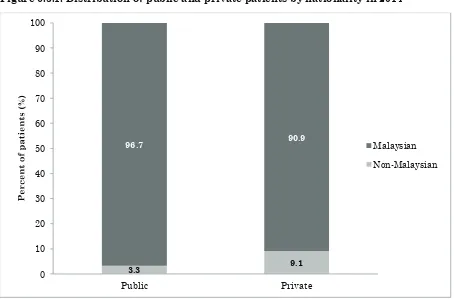
Figure 6.3.1 Distribution of public and private patients by nationality in 2014 ... 55
Figure 6.3.2 Distribution of public and private patients by ethnicity in 2014 ... 55
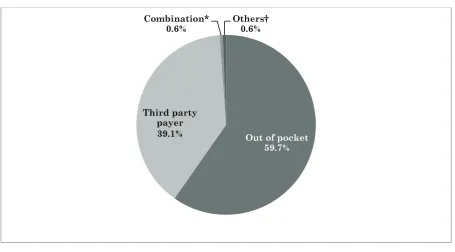
Figure 6.4.1 Distribution of private patients by mode of payment in 2014 ... 56
Figure 6.5.1 Distribution of public and private patients by type of income in 2014 ... 57
Figure 6.5.2 Distribution of primary care patients by income and sector in 2014 ... 57
Figure 6.6.1 Distribution of public and private patients by education level in 2014 ... 58
Figure 6.7.1 Distribution of public and private patients by issuance of medical certificate in 2014 ... 59
Figure 6.7.2 Distribution of public and private patients by duration of sick leave in 2014 ... 59
Figure 7.1.1 Number of reasons for encounter per visit in primary care clinics in 2014 ... 62
Figure 7.4.1 Top 10 reasons for encounter in public clinics in 2014 ... 67
Figure 7.4.2 Top 10 reasons for encounter in private clinics in 2014 ... 68
Figure 8.1.1 Number of diagnoses managed per encounter in primary care clinics in 2014 ... 70
Figure 8.1.2 Age- and gender- specific rates of diagnoses managed per 100 encounters by sector in 2014 ... 71
Figure 9.1.1 Number of medications prescribed per encounter in primary care clinics in 2014 ... 81
Figure 9.1.2 Age- and gender- specific prescription rates per 100 encounters by sector in 2014 ... 82
Figure 10.1.1 Number of investigations ordered per encounter in primary care clinics in 2014 ... 97
Figure 10.3.2 Top 10 investigations ordered in private clinics in 2014 ... 100
Figure 11.3.1 Ten most common advice/counselling provided in public clinics in 2014 ... 107
Figure 11.3.2 Ten most common advice/counselling provided in private clinics in 2014 ... 107
Figure 11.5.1 Ten most common procedures performed in public clinics in 2014 ... 109
Figure 11.5.2 Ten most common procedures performed in private clinics in 2014 ... 110
•
• • • • • • •
•
ix
ACKNOWLEDGEMENTS
National Healthcare Statistics Initiative team would like to thank the Director General of Health Malaysia for his continuous support towards this survey and permission to publish this report.
We would like to express our sincere appreciation to the following contributors for participating, guiding, advising and supporting us in our endeavour:
• Deputy Director-General of Health (Research and Technical Support), Ministry of Health (MOH)
• Deputy Director-General of Health (Medical), MOH
• Deputy Director-General of Health (Public Health), MOH
• Director of the Clinical Research Centre, National Institutes of Health, MOH
• Health Informatics Centre, MOH
• Director of the Family Health Development Division, MOH
• Director of the Planning and Development Division, MOH
• Director of the Private Medical Practice Division, MOH (Cawangan Kawalan Amalan Perubatan Swasta, CKAPS)
• State level Private Medical Practice Control Units (Unit Kawalan Amalan Perubatan Swasta, UKAPS).
• Malaysian Medical Council, Malaysian Medical Association, Academy of Family Physicians Malaysia.
This report would not have been possible without the support and participation of the primary care clinics’ providers and their patients in the National Medical Care Survey 2014. Our sincerest gratitude goes out to them in making this project a success.
Last but not least, we thank Ms. Lim Huy Ming for her contributions in editing this report.
National Healthcare Statistics Initiative (NHSI) Primary Care Team Healthcare Statistics Unit
NATIONAL MEDICAL CA E S
Y 2014
CT TEAM
rincipal Investigator YBhg. Datuk Dr. Jeyaindran Tan Sri Sinnadurai
rincipal Co-Investigator
Dr. Sheamini Sivasampu Dr. Goh Pik Pin
esearch Evaluation Committee
(EC)
Dr. Kamaliah Mohd. Noh Professor Dr. Khoo Ee Ming Professor Dr. Ng Chirk Jenn Professor Dr. Teng Cheong Lieng Dr Baizury Bashah
Ms. Siti Fauziah Abu
roject Managers
Dr. Yasmin Farhana Abdul Wahab Mr. Ong Su Miin
Members ofesearch Team
Dr. Chin May Chien Dr. Kirubashni Mohan Ms. Thilagaa Rajanthren Ms. Pavityra Velayutham
Mr. Amirul Amin Kamaruzzaman Ms. Nur Rafidah Mohd Noor Ms. Juliana Mohd Noor
Survey Coordinator Ms. Siti Aminah Ismail
Data Analysis Mr. Ong Su Miin
Database
DevelopersAdministrators
xi
EVIATIONS
ACE Angiotensin converting enzyme
ATC WHO Anatomical Therapeutic Chemical classification system BEACH Bettering the Evaluation and Care of Health
CI Confidence interval
CKAPS Cawangan Kawalan Amalan Perubatan Swasta (Private Medical Practice Division) FMS Family medicine specialist
FOMEMA Foreign Workers Medical Examination Monitoring Agency
F ACGP Fellowship of the Royal Australian College of General Practitioners F CGP Fellowship of the Royal College of General Practitioners
FTE Full-time-equivalent
GP General practice or practitioner HbA1c Glycated haemoglobin
ICPC International Classification of Primary Care IQ Interquartile range
MAFP Membership of the Academy of Family Physicians of Malaysia MOH Ministry of Health, Malaysia
MGP Membership of the Royal College of General Practitioners
MEC Medical Research and Ethics Committee, Ministry of Health Malaysia MY Malaysian Ringgit
NC National Clinical Research Centre NEC Not elsewhere classified
NHEWS National Healthcare Establishment & Workforce Survey (Primary Care) NHSI National Healthcare Statistics Initiative
NMCS National Medical Care Survey NOS Not otherwise specified PS Primary sampling unit QS Quaternary sampling unit EC Research Evaluation Committee FE Reason for encounter
SOCSO Social Security Organisation
S S Secondary sampling unit TS Tertiary sampling unit
PS Unit Kawalan Amalan Perubatan Swasta (Private Medical Practice Control Units)
WHO World Health Organisation
WONCA World Organization of National Colleges, Academies and Academic Associations of General Practitioners/Family Physicians
SYMBOLS
– Not applicable > More than
≥ More than or equal to < Less than
% Percentage
All error bars in the figures included in this report represent 95% confidence intervals (CIs).
•
•
•
• •
•
•
•
•
1
≥
TI
MM
Y
The National Medical Care Survey (NMCS) is a provider-based survey which aims to study the characteristics and morbidity pattern of patients as well as healthcare activities in terms of investigations, procedures, counselling and visit dispositions provided at primary care level in Malaysia. NMCS 2014 covered public and private clinics from 13 states and three federal territories in Malaysia. The clinics were stratified according to sector and state and selected through random sampling. Healthcare providers from these clinics recorded details of patients they managed on the day of survey, which was randomly allocated between January and May 2014.
Primary care clinics
In NMCS 2014, a total of 129 public clinics out of 139 sampled (92.8%) and 416 private clinics out of 1,002 sampled (41.5%) responded. The survey data were weighted to produce unbiased national estimates for 664 public clinics and 4,810 private clinics in Malaysia which were staffed with medical doctors.
• The median attendance rate in public clinics was 111.5 visits per day, compared to 33.0 per day in private clinics.
• A large majority (82.8%) of public clinics operated five days per week. After-hours services (extended-hours and/or on-call services) were provided in addition to the standard-hour operation in 47.9% of public clinics.
• Most (54.0%) private clinics operated six days per week. Only 5.0% of the private clinics provided 24-hour services.
• Three-quarters (75.3%) of the private clinics were solo practices.
• The median number of patients seen per full time equivalent (FTE) doctor in the private sector was 25.9 patients per day.
• Only 19.4% of public clinics had a functional computer system installed in the practice, compared to 71.6% for private clinics. Computer system was mainly used for registration (83.7%) and medical record keeping (83.3%) purposes in the public sector and for billing purpose (79.6%) in the private sector.
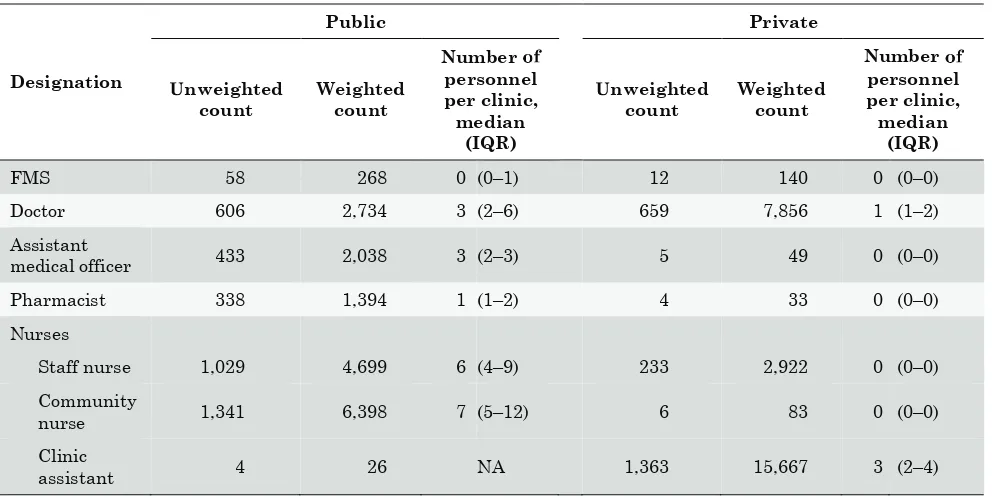
• Public clinics were staffed with 26.4 health professionals on average, with a median of three doctors, six staff nurses, seven community nurses, three assistant medical officers and one pharmacist per clinic. In contrast, private practices had only 5.6 health professionals on average, with a median of one doctor and three clinic assistants in each clinic.
• Family medicine specialists (FMS) were available in 40.1% of public clinics, compared to 2.9% in the private sector.
The doctors
A total of 936 doctors participated in NMCS 2014: 490 (52.4%) from public clinics and 446 (47.6%) from private clinics. The survey responses were weighted to produce national estimates for 10,964 doctors (2,992 public and 7,972 private) working in primary care in Malaysia.
• Female doctors accounted for a higher proportion of the doctor workforce in the public sector compared to the private sector (70.5% versus 39.7%, respectively).
clinics were 45 years or older, while only 6.2% of doctors in public clinics fell in the same age group.
• The majority (62.0%) of the doctors had been working in the primary care setting for 10 years or more (median: 13 years).
• Overseas trained doctors accounted for the greater proportion (51.5%) of the primary care doctor workforce.
• Nearly one-sixth (15.7%) of the doctors had at least one postgraduate qualification. Most of these doctors specialised in family medicine (87.3% in the public sector and 38.9% in the private sector).
Theatients
A total of 27,587 encounters (15,470 in public clinics and 12,117 in private clinics) were captured in NMCS 2014. Post-stratification weighting translated this figure into a total of 325,818 primary care encounters: 131,624 (40.4%) in public clinics and 194,194 (59.6%) in private clinics.
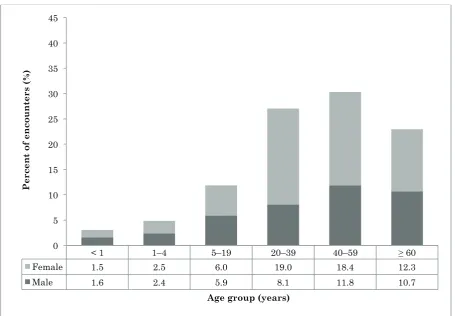
• Females accounted for 53.6% of all primary care encounters. The proportions of male and female patients were similar across all age groups, except among the adult age groups (20– 39 years and 40–59 years) in public clinics, for which significantly higher proportions of females were reported.
• The public clinics were utilised by a relatively older patient population compared to the private clinics. Patients aged 40–59 years accounted for the greatest proportion (30.3%) of public clinic encounters, while most (44.3%) private patients were between 20 and 39 years of age. The elderly patients constituted a significantly higher proportion of the patient population in the public sector than in the private sector (22.9% versus 9.7%, respectively).
• Malays were the largest ethnic group utilising primary care (65.6% of encounters in public clinics and 60.4% in private clinics), followed by Chinese (14.4% in public clinics and 26.1% in private clinics) and Indian patients (11.9% in public clinics and 10.0% in private clinics).
• All patient encounters in the public sector were covered by government subsidies, while most of the encounters in the private sector were paid for through out-of-pocket payments (59.7%) and third-party payments (39.1%).
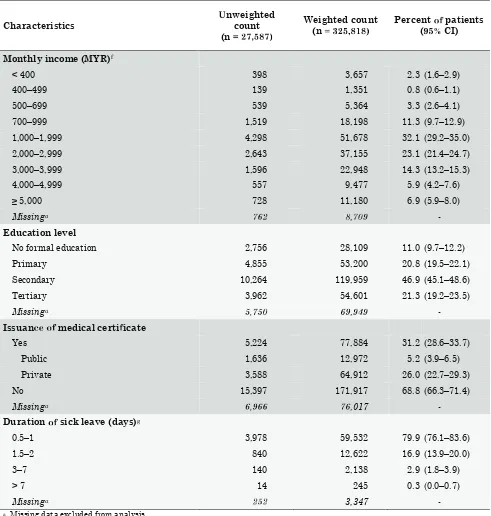
• More than half (55.2%) of the patients had a monthly personal income between MYR 1,000 and MYR 2,999 (parental income excluded). In general, patients who visited private clinics had higher incomes than those who utilised public clinics.
• The vast majority (89.0%) of patients had received some form of formal education (primary to tertiary levels). In general, the level of educational attainment was higher among private patients than among those who presented to public clinics.
• Medical certificates were issued to 31.2% of patients (9.9% of patients in public clinics and 33.4% in private clinics). The duration of sick leave given ranged from 0.5 to 20 days.
easons r seeking treatment
A total of 597,563 patient-reported reasons for encounter (RFEs) were recorded at 325,818 encounters (252,050 RFEs in public clinics and 345,513 in private clinics), translating into an average of 183.4 RFEs per 100 patient encounters (weighted data).
• More than half (53.0%) of the patients presented with two or more RFEs per encounter. Most (61.4%) of the RFEs were expressed in terms of a symptom or complaint.
• The three most commonly recorded RFEs in public clinics were all chronic diseases:
3
• In contrast, in private clinics, patient encounters were mostly for acute complaints: fever (28.3 per 100 encounters), cough (26.5 per 100 encounters) and runny nose/rhinorrhoea (19.4 per 100 encounters).
Diagnoses managed
A total of 436,743 diagnoses were made in primary care clinics, at a rate of 134.0 diagnoses per 100 patient encounters (weighted data).
• More diagnoses were managed overall at encounters in public clinics (154.9 diagnoses per 100 encounters) than in private clinics (119.9 diagnoses per 100 encounters).
• Only a single diagnosis was managed at 75.2% of the encounters (63.0% of encounters in public clinics and 83.5% in private clinics).
• The number of diagnoses increased with patient age for both sectors, with the increase being more pronounced in the public sector, especially for age groups over 40 years.
• More than three-quarters (77.9%) of diagnoses were recorded as diagnoses or diseases; only 16.6% remained undiagnosed symptoms or complaints.
• The three most frequently managed diagnoses in public clinics were non-communicable diseases: hypertension (33.1 per 100 encounters), diabetes (23.4 per 100 encounters) and lipid disorder (22.1 per 100 encounters). These chronic illnesses were managed at much lower rates in private clinics (6.5, 3.0 and 2.9 diagnoses per 100 encounters, respectively).
• By comparison, majority of the cases managed by private primary care providers were acute illnesses. The most common diagnoses in private clinics were upper respiratory tract infections (22.7% of all diagnoses in private clinics and 27.2 per 100 encounters), hypertension (6.5 per 100 encounters) and gastroenteritis (5.4 per 100 encounters).
Medicationsrescribed
A total of 864,552 medications were recorded, at rates of 265.3 medications per 100 encounters and 198.0 medications per 100 diagnoses (weighted data).
• Medications were prescribed for 89.9% of all encounters (86.7% of encounters in public clinics and 92.1% in private clinics).
• The medication prescribing rates were higher in the private sector (276.8 medications per 100 encounters and 230.8 per 100 diagnoses) than in the public sector (248.5 per 100 encounters and 160.4 per 100 diagnoses).
• Nearly 60% of the encounters in private clinics were prescribed with three or more medications, compared to 45.8% in the public sector.
• The prescription rates were higher in the private sector for patients who were less than 40 years old compared to those in the public sector regardless of gender. The trends were reversed for patients aged 40 years and above for both genders.
• The top three classes of medications prescribed in public clinics were cardiovascular agents (34.1%), alimentary tract and metabolism agents (24.7%) and respiratory agents (14.1%), while those most frequently prescribed in private clinics were respiratory agents (27.4%), alimentary tract and metabolism agents (17.4%) and musculoskeletal medications (15.5%).
• In contrast, the 10 most frequently prescribed medications in private clinics were all medications for acute conditions (paracetamol, diclofenac, diphenhydramine, chlorphenamine, mefenamic acid, butylscopolamine, amoxicillin, pseudoephedrine, cetirizine and prednisolone).
Investigations ordered
Of all 325,818 primary care encounters, 22.6% had investigations ordered (39.6% in public clinics and 11.1% in private clinics). A total of 143,758 orders for investigations were recorded, at rates of 44.1 per 100 encounters and 32.9 per 100 diagnoses (weighted data).
• The ordering rates of investigations were much higher in public clinics (82.5 investigations per 100 encounters and 53.2 per 100 diagnoses) than in private clinics (18.1 per 100 encounters and 15.1 per 100 diagnoses).
• Majority (82.0%) of the investigations recorded were pathological/laboratory tests. Diagnostic radiology/imaging test constituted 9.3% of all investigations.
• Chemistry tests accounted for 55.8% of all investigations and 68.0% of all laboratory tests ordered. The most common chemistry tests ordered were glucose tests (7.6 per 100 encounters); tests for electrolytes, urea and creatinine (4.5 per 100 encounters); and lipid tests (4.5 per 100 encounters).
• Glucose and/or glucose tolerance test was the most frequently ordered individual investigation in both public and private sectors (15.1 per 100 encounters in public clinics and 2.5 per 100 encounters in private clinics).
• Diabetes, hypertension and lipid disorder were the most common diagnoses for which investigations were ordered. Together, these three chronic diseases represented half (49.9%) of all diagnoses for which investigations were ordered.
Advice/counselling an ocedures
A total of 111,707 advice/counselling (34.3 per 100 encounters and 25.6 per 100 diagnoses) and 25,001 procedures (7.7 per 100 encounters and 5.7 per 100 diagnoses) were provided by primary care providers (weighted data).
• Out of the 325,818 encounters recorded, 24.5% were managed with at least one form of advice/counselling (37.5% in public clinics and 15.6% in private clinics), and 6.9% had some procedures performed at the time of visit (5.0% in public clinics and 8.2% in private clinics).
• The top three most frequently provided types of advice/counselling were general advice/education, advice/counselling on nutrition or weight management, and advice/counselling on lifestyle. Together, these accounted for 72.9% of all advice and counselling provided in primary care clinics.
• Injection/infiltration was the most common procedure performed and accounted for 27.9% of all procedures performed in primary care clinics, followed by procedure for dressing, pressure or compression of wounds at 21.4%.
• Advice/counselling and procedures were provided as part of the patient management for 23.5% and 5.0% of all diagnoses, respectively. The most common diagnoses managed with advice and counselling were hypertension (20.6% of all diagnoses managed with advice and counselling), diabetes (18.5%) and lipid disorder (13.9%), while asthma (8.5%), musculoskeletal symptoms or complaints (5.4%) and skin laceration/cut (5.4%) were the three diagnoses most frequently managed with a procedure.
5
About one-third (29.7%) of the patients presenting to primary care had a referral or follow-up appointment (weighted data). Follow-up appointments were scheduled for 89,641 patients (27.5 per 100 encounters and 20.5 per 100 diagnoses), while referrals were issued for 11,068 patients (3.4 per 100 encounters and 2.5 per 100 diagnoses).
• Both follow-up rate and referrals rate were higher in the public sector compared to the private sector (49.2% versus 12.9% and 5.8% versus 1.8%, respectively).
• Referrals in public clinics were most often to medical specialists (34.0% of all referrals in public clinics, 2.0 per 100 encounters), followed by referrals within primary care (1.3 per 100 encounters) and those to hospitals (1.3 per 100 encounters).
• Nearly half (47.7%) of all referrals recorded in the private sector were for medical specialists (0.8 per 100 encounters), while hospital referrals constituted most of the other half (41.1%).
• The leading diagnoses for follow-up were hypertension (28.5% of all diagnoses with follow-up appointments), diabetes (20.2%) and lipid disorder (18.5%). These three chronic diseases were also the three most commonly referred diagnoses (diabetes: 11.9%, hypertension: 10.2%, lipid disorder: 5.3%).
Di erences inrimary care activities since NMCS 2012
The data presented in this report are by far the most comprehensive and detailed information on healthcare activities of both public and private primary care clinics in Malaysia. These data confirm and extend the findings of the previous NMCS, which was conducted in three states and two regions in 2012. The findings of both NMCS 2012 and NMCS 2014 are largely similar. The major changes are summarised below. Note that the classification of advice/counselling, procedures, follow-ups and referrals followed different approaches in the two surveys, and direct comparisons could not therefore be made for these primary care activities.
• Antenatal check-up was the fourth most common RFE recorded in public clinics in 2012, accounting for 18.0% of all RFEs in public clinics. In 2014, antenatal examination represented only 9.3% of all RFEs in public clinics, ranking seventh among the top RFEs recorded in the public sector.
• Metformin was the second most frequently prescribed medications (17.1 per 100 encounters) in the public sector in 2012, followed by amlodipine (15.9 per 100 encounters) and lovastatin (14.8 per 100 encounters). In NMCS 2014, higher prescribing rates were recorded for all three medications, but the rates of increment were higher for amlodipine and lovastatin. As a result, amlodipine had become the second most frequently prescribed medication (20.0 per 100 encounters) in public clinics in 2014, followed by lovastatin (17.5 per 100 encounters) and metformin (17.4 per 100 encounters).
• The ordering rate for obstetric ultrasonography in public clinics had dropped from 9.2 per 100 encounters in 2012 to 3.2 per 100 encounters in 2014. This corresponds with the reduced number of antenatal encounters seen in public clinics in 2014.
CHAPTER one
• • • •
CHAPTER 1: INTR
TION
1.1 BACKG!" #$ %
The National Healthcare Statistics Initiative (NHSI) is a family of surveys which aims to support evidence-based health policy-making and research in Malaysia. It was initiated in 2009 by the Healthcare Statistics Unit (HSU) of the National Clinical Research Centre (NCRC) in collaborations with various stakeholders. Over the past six years, the NHSI has grown and managed to gain local and international recognition due to the usefulness of its reliable and timely data, which fill in the gap between research and policy. Annual reports are published for the surveys under NHSI.
As one of the four members of NHSI, the National Medical Care Survey (NMCS) was first launched in 2010 and had its fair share of challenges. After consulting local and international researchers as well as stakeholders, a pilot study was conducted in 2012. The continued support from the Family Medicine Research Centre team at the University of Sydney in Australia, which conducts a series of primary care research under the Bettering the Evaluation and Care of Health (BEACH) program,1 has been a major contributing factor to NMCS. In addition, the revised methodology and an able steering Research Evaluation Committee had ensured the success of NMCS 2012.
The questionnaire for NMCS 2014 was adapted from BEACH and NMCS 2012. &alidation was done before proceeding with the improved forms for the 2014 project. The valuable information and experience gained from NMCS 2012 contributed tremendously to the improvement of methodology, data collection strategies and analysis methods for NMCS 2014.
While the NMCS 2012 was a pilot study that involved only three states and two regions, the NMCS 2014 was conducted at national level. In fact, NMCS 2014 is the first nationwide study on public and private primary care in Malaysia, where public and private clinics were randomly sampled from all 13 states and three federal territories to be included in the survey. At the national level, NMCS 2014 is providing information to the National Strategic Plan for Non-Communicable Disease (NSPNCD) 2010–2014 and the Malaysian Health System Reform (MHSR) research on the clinical management of diseases and utilisation pattern in primary care settings.2,3
1.2 O'(ECTIVES
General ob)ectives
1. To collect reliable and valid data in primary care setting.
2. To examine patient characteristics and utilisation pattern and the relationship these factors have with health service activities.
3. To provide accurate and timely data to various stakeholders, including government bodies, primary care practitioners, consumers, researchers and the pharmaceutical industry.
9
Chapter 1 : IntroductionSpeci *ic ob+ectives
To collect information on clinical activities in primary care setting in Malaysia, including:
• The characteristics of patients seen
• Mode of payment for primary care services
• Reasons people seek medical care
• Problems managed, and for each problem managed:
o Pharmacological treatment prescribed, including the dose and frequency o Non-pharmacological treatment provided, including procedures and counselling o Investigations ordered, including pathology and imaging
o Follow up in primary care and referrals to secondary or tertiary care o Issuance of medical certificate and duration of sick leave
1.3 DEFINITIONS
Definitions of primary care were adapted from the American Association of Family Physicians.4 The few terms that were taken are:
a) Primary care
The care provided by physicians specifically trained for and skilled in comprehensive first contact and continuing care for persons with any undiagnosed sign, symptom, or health concern (the "undifferentiated" patient) not limited by problem origin (biological, behavioural, or social), organ system, or diagnosis.
The care involved includes health promotion, disease prevention, health maintenance, counselling, patient education, diagnosis and treatment of acute and chronic illnesses in a variety of healthcare settings (e.g., office, inpatient, critical care, long-term care, home care, day care, etc.). Primary care is performed and managed by a personal physician, often collaborating with other health professionals and utilising consultation or referral as appropriate.
b) Primary care setting
Primary care setting serves as the patient,s first point of entry into the healthcare system and as the continuing focal point for all needed healthcare services. Primary care practices provide patients with ready access to their own personal physician or to an established back-up physician when the primary physician is not available.
c) Primary care doctors
Medical doctors or family medicine specialists (FMS) who provide primary care in the primary care setting.
1.4 RESEARCH Q ESTIONS
No. Question Answered by
1 What types of patients are seen by primary care practitioners? Demographic characteristics 2 What is the source of payment for primary care services? Mode of payment
3 What motivates patients to seek care in the primary care setting? Patient’s reasons for visit 4 What are the actual diagnoses/problems managed by primary care
practitioner-?
Doctor’s diagnosis/problems managed
5 What are the pharmacological treatments prescribed by primary care practitioners for each diagnosi-?
Pharmacological interventions
6 What are the procedures and imaging ordered by primary care practitioners for the diagnoses/problem-?
Non-pharmacological interventions
7 What types of counselling are offered by primary care practitioners for the diagnoses/problem-?
Non-pharmacological interventions
8 Is there any continuity of care in primary care setting? Referrals/follow-up 9 What is the extent of the loss of productivity for the morbidities in
primary care setting?
Medical certificate (MC) and duration of sick leave
10 What are the characteristics of the primary care providers seeing the patients?
Providers’ characteristics
11 What are the characteristics of the clinics the patients visit in primary care?
Clinic establishments and workforce
All research questions are addressed in this report. While most questions are reported in a chapter of 1.4 RESEARCH Q.ESTIONS
o.
All research questions are addressed in this report. While most questions are reported in a chapter of its own, some related questions are discussed together within relevant chapters.
REFERENCES
1. Bettering the Evaluation and Care of Health (BEACH) [Internet 0. Sydney (Australia): University of Sydney, Family Medicine Research Centre; c2002-213 4 [updated 2015 Sep 15, cited 2015 Oct 320; [about 1 screen0. Available from: http://sydney.edu.au/medicine/fmrc/beach/index.php
2. Ministry of Health Malaysia. National Strategic Plan for Non-Communicable Disease (NSPNCD): medium term strategic plan to further strengthen the cardiovascular diseases & diabetes prevention & control program in Malaysia (2010–2014). Putrajaya (Malaysia): Ministry of Health Malaysia, Disease Control Division; 2010. 40 p.
3. Malaysia Health Systems Research Study [Internet 0. Boston (MA): Harvard T.H. Chan School of Public Health; [cited 2015 Oct 3 20; [about 3 screens0] Available from: http://www.hsph. harvard.edu/global-health-systems-cluster/projects/malaysia-health-systems-reform/
CHAPTER two
Methodology
o.1
2
3 g
4 are d
5 y
6
7
8
9 in n
10 g
11 o.
1 2
3 g
4 are d
5 y
6
7
8
9 in n
10 g
CHAPTER 2: METHODOLOGY
The 2014 National Medical Care Survey (NMCS) is a national cross-sectional study of primary care activities. It utilised a multi-stage stratified cluster sampling design, with the primary care clinics acting as primary sampling units (PSUs). Random sampling of primary care clinics was performed for all states and federal territories in Malaysia, namely, Johor, Kedah, Kelantan, Melaka, Negeri Sembilan, Pahang, Perak, Perlis, Pulau Pinang, Sabah, Sarawak, Selangor, Terengganu and Wilayah Persekutuan (WP) Kuala Lumpur. Two federal territories were combined with the neighbouring states (WP Labuan with Sabah and WP Putrajaya with Selangor) in view of the geographical proximity and demographic similarities.
The data collection lasted 17 weeks, from 7 January 2014 to 15 May 2014. All sampled clinics were randomly allocated one day for data recording in their respective clinics, and all service providers working on that particular day were involved in data collection.
2.1 SAMPLE SIZE CALC69ATION AND SAMPLING METHODS
Ideally, we would like to randomly sample the units of analysis which are the encounters; however this is not feasible in our current system. The reasons being we do not have an exhaustive list of primary care patients and it would not be practical, financially and logistically, to sample patients from all over the country. Hence the sampling could only be done via the clinics which act as a cluster of encounters. The cluster effect of such sampling method will be adjusted in the analysis using statistical programme.
Sample s: ;e calculation
The number of encounters needed for the NMCS 2014 was first determined for each sector based on the formula proposed by Cochran1 by using the proportion of upper respiratory tract infection encounters from NMCS 2010. This number was then adjusted for the design effect (assumed to be 2) and expected response rate from each sector.
Subsequently, the adjusted number of encounters was proportionately distributed to each state and by using the average number of doctors per clinic and the average number of encounters per doctor from NHEWS Primary Care 2010, the number of clinics to be sampled for each stratum was calculated. We expected a minimum of 30 encounters from each clinic.
The final sample consisted of 139 public clinics and 1,002 private clinics (Table 2.1.1). For Melaka and Perlis, all public clinics were sampled because the total number of clinics in these strata was less than 30, the minimum acceptable sample size for each stratum.2
•
13
Chapter 2 : MethodologyTable 2.1.1: Sample siz <=primary sampling units>@ Cr NMCS 2014
State/Eederal territory
Public Private
Population Sample Population Sample
Johor 93 11 709 117
Kedah 56 7 298 55
Kelantan 64 7 192 45
Melaka 29 26 186 31
Negeri Sembilan 46 6 233 40
Pahang 79 6 201 42
Perak 83 11 510 73
Perlis 9 9 30 10
Pulau Pinang 30 5 398 70
Sabah & WP Labuan 92 9 311 65
Sarawak 196 10 225 34
Selangor & WP Putrajaya 76 15 1,520 270
Terengganu 45 5 148 30
WP Kuala Lumpur 13 12 685 120
Total 911 139 H I646 1,002
Sampling methods
The sampling frame of public and private clinics was generated by matching the list of clinics from National Healthcare Establishments and Workforce Survey (NHEWS) 2012 with several sources:
• The list of public clinics (Klinik Kesihatan) from the Family Health Development Division, Ministry of Health (MOH) Malaysia.
• The list of registered private clinics from the Private Medical Practice Division, Ministry of Health Malaysia (often referred to as the Cawangan Kawalan Amalan Perubatan Swasta (CKAPS).
Both lists were updated as of 31st December 2012 and these were regarded as the most recent lists of the public and private clinics at the period of survey.
Table 2.1.2: Inclusion and exclusion criteriaMor the clinics sampled in the survey
Inclusion criteria • MOH Health Clinics (Klinik Kesihatan) which provide primary care services • Private medical clinics registered with CKAPS and provide primary care
services
Exclusion criteria • Outpatient departments within hospital or maternity homes • Public clinics with the following criteria:
Health clinicswithout permanent medical doctors (Klinik Kesihatan) Clinics which provide only maternal and child health services (Klinik
Kesihatan IbNQ TW\nak)
Rural health clinics (Klinik Desa) 1 Malaysia clinics
• Private clinics with the following criteria: Aesthetic clinics
Charity clinics Diagnostic centres Homeopathy clinics
In-house clinics/clinics which are affiliated with specific companies Specialist clinics /clinics which provide specialised care/ e.g. paediatric, cardiology, occupational therapy
Clinics which operate less than 5 days a week Clinics which participated in NMCS 2012
Sample selection was conducted by stratified random cluster sampling, incorporating several stages. The details are described below.
^ _ra_`a`ba_ion
^ _age 1:^_rc_iaibc_ion by seb _or
Each state or federal territory was stratified by either public or private sector.
^ _age 2: ^_rc_iaibc_ion by scdpling regions
Johor, Kedah, Kelantan, Melaka, Negeri Sembilan, Pahang, Perak, Perlis, Pulau Pinang, Sabah & WP Labuan, Sarawak, Selangor & WP Putrajaya, WP Kuala Lumpur and Terengganu.
Clug_er sadpling
^ _age 1:^cdpling oablinibs (pridary scdpling uni_)
Random sampling of clinics was based on random numbers generated using Microsoft Excel 2007. If a selected clinic was discovered to not fulfill the inclusion and exclusion criteria when contacted, the clinic was omitted and another clinic was randomly selected to replace it.
15
Chapter 2 : Methodology• s
•
• •
•
h kage 2:h lmpling oo surveyqlke (sewondary slmpling unik)
Each sampled clinic was randomly assigned a date for data collection within the study period. The following days were excluded:
o public holidays
o weekends, including Friday, Saturday and Sunday
o Monday (Mondays are usually the busiest for public primary care clinics) o a week before and during the festive season (Chinese New Year)
If the clinic was closed on the date of survey, the doctor had the option to change the survey date to the next available working day, given that the research team was informed of the new survey date.
h kage 3: h lmpling oo dow kors (ixwluding assisk lxk mediwal oo oiwers & krained nurses ix khe pub{ |wwlin|ws
}
~krk|lry sampling un|k}
All doctors (including assistant medical officers and some trained nurses in public clinics) in the sampled clinics who were on-duty on the day of survey were included.
Locum doctors were included.
As for doctors who are trained in clinical specialities, only family medicine specialists were included.
h lmpling oo exwoxkers
Record of all patient encounters seen by each health care personnel mentioned above on the survey date.
16
The encounters (all or minimum of 30) from each working on that
date were
Each clinic was assigned a
Public 14 States Clinics
Private 14 States Clinics
17
Figure 2.1.2: Consort diagram public primary care clinics 2014
Total number o public primary care
clinics in 13 states and 3 ederal territories
N 911
Sampled clinics
n 139
WP Kuala Lumpur
n 12
Clinic sampling rame
19
Chapter 2 : Methodology2.2 DATA COLLECTION AND FOLLOW-± ²
The sampled clinics were each sent an invitation letter to attend a briefing in major towns in each state. Briefings for doctors in the public clinics were held on weekdays, whereas briefings for private doctors were conducted between October and December 2013 according to the convenience of the private doctors for maximum attendances. A research pack which contained the survey forms and instructions were distributed during the briefings.
To encourage further participation, representatives of clinics that did not attend the briefing were later contacted by telephone. If the doctor refused to participate, the team did not pursue further. However, if they agreed to participate the research pack was sent either by:
• courier service (Poslaju) followed by telephone call to ensure that the research kit is received. Briefing would be done over the phone to explain about the survey form
• personal visit to the clinics (within the vicinity of Klang valley), where a short private briefing would be given by the research team to the doctor/nurse in-charge
A telephone call-reminder was made to the clinic about the project and to answer any questions pertaining to the survey at two weeks and one day before the survey date. Instructions would be repeated when necessary. After the survey date, follow-up phone call(s) were made if the research pack was not returned after three weeks, and subsequently at five weeks.
³arious approaches were also taken to increase the acceptance and response rates of private clinics in particular, including:
a) Approaching the top management of the chain clinics/group practices.
b) Obtaining a written endorsement from the Malaysian Medical Association (MMA).
c) Getting support and assistance from Malaysian Medical Association (MMA) at the state level. d) Presentation of the NMCS 2012 results through general practitioners’ seminar and a series of
articles in MMA bulletin.
e) Organising private (individual) briefings alongside Medical Practice Division’s enforcement activities.
Data was collected using a self-administered questionnaire. The details of the patients managed on the date assigned to each clinic were filled by the health providers. Upon completion of data collection, participants were given certificates, which they would later use to claim for continuing professional education (CPD) points. A clinic-specific feedback, a satisfaction survey on the prescribers, and a copy of the National Medical Care Statistics 2014 report will also be sent to all participants.
2.3 RESEARCH PACK AN´
µ±ESTIONNAIRE
Each research pack contained:
• Survey pads 40 forms
One set of instructions One case study
One example of a completed form
• NMCS 2014 summary in¶ormation Objectives of the NMCS 2014
Brief description of project and project team Individual survey date of the clinics
• Public notice
Notice to be displayed in the participating clinic to inform patients that the clinic is currently undertaking the NMCS survey
• ICPC-2-code list ICPC-2-Code list
Also included in the research pack:
• Call letter
Letter signed by the Director of the State Health Departments to inform the participating clinics of the survey
• Prepaid envelope
One envelope for every two survey pads
2.4 DATA MANAGEMENT
Data entry
Prior to the start of data entry, all data entry personnel were given reference materials containing a description of the study, examples of the questionnaire, classification and coding systems, data entry rules and regulations. This was followed by two sessions of data entry training of at least 2 hours each session. Data is then transferred from paper to an electronic format through a data entry web application by trained data entry personnel.
Session 1:·emons¸r¹¸ion and pr¹º¸iºal session • Slide presentation on data entry module
• Live demonstration of data entry module
• Live demonstration of coding systems
• Discussion on data entry and coding systems
• Practical session – practice data entry and coding of 20 test questionnaires per data entry personnel
21
Chapter 2 : Methodology•
• Feedback was provided to data entry personnel on data entry and coding issues from the 20 test questionnaires
Standardisations to the data entry rules and coding systems were also periodically updated and conveyed to all data entry personnel.
Dat¾¿uality assurance
The data entry application was loaded with previous coding history from NMCS 2012 and also current coding entry to ease the coding process and to ensure consistency of coding.
Software based quality assurance measures were also built into the data entry applications either as a quality measure or to facilitate the data entry process. For example warnings prompt when there was a duplication of identification card number being entered, warnings prompt of missing mandatory fields, auto-generation of date of birth and age through identification card number when available etc.
Àalidity checks were put in place during data entry to minimise entry of illogical data and warnings would pop-up if extreme values were entered to prompt the data entry personnel to re-check the data. These include validation on the date of birth entered, gender counter check via identification card number when available, unable to enter the same diagnosis within the same encounter etc.
In addition to the aforementioned measures, double data entry was also incorporated as part of the quality assurance of the data. This form of quality check has been recommended and known to correct data entry errors from the original entry.5
Double data entry was done for more than 10% of the total entries (2,894 out of 27,808 forms) in six batches, where Batch 1 was completed in June 2014 and Batch 6 in October 2014. Questionnaires that were to be entered a second time were identified by random selection of clinics. The data entry personnel were blinded to the assignment of clinics for double data entry.
Diagnosis not specified for which
medical certificated was issued 6.2 2.1 0.0 1.3 0.2 0.5
The three variables for the non-coding section were the variables with the highest data entry error rate Table 2.4.1: Data entry error ratÅÆor NMCS 2014
1 2 3 4 5 6
The three variables for the non-coding section were the variables with the highest data entry error rate for batch 1. There was marked improvement in error rate for these variables from batches 1 to 5. Increase of data entry error rate for the coded variables can be attributed to recruitment of new data entry personnel, resulting in more variations in coding. While many of the errors were random errors but coding errors were largely occurring in a systematic manner; where a data entry personnel with a misconception of the correct codes for certain diseases/medications, makes a consistent error throughout all forms entered.
There does not appear to have a general consensus of acceptable data entry error rate worldwide. Previous study shown that error rates detected by double-entry method for clinical databases ranged from 2.3 to 5.2% for demographic data while for treatment data, it ranged from 10.0 to 26.9%6. Similarly, Fontaine P et. al reported an overall rate of 7.3% for data entry strategies used in clinical trial.7
Double entry has been recognised as the gold standard in transferring of data into an electronic database but it substantially increases the amount of time and costs of data entry. Costs of resources have been reported to be increased by up to 2.5 times with double data entry compared to single entry5. Also, additional software solutions and manual checking mechanisms are required when performing checks on discrepancies and putting in corrections.
An alternative recommendation is a trade-off between acceptable data accuracy and cost-effectiveness using single data entry with concurrent quality control measures, exploratory data analysis and post-entry logic checks.5,6 It is also recognised that double entry detects errors where exploratory analysis misses while on the other hand not all discrepancies found by exploratory data analysis is identified by double entry.8 Hence, suggests that double data entry alone may not necessarily be sufficient as a sole data quality checking method.
23
Chapter 2 : MethodologyClassiÇication oÇ data (data coding)
ÈnÉernaÉÊ Ënal ClassÊÌÊÍaÉÊ Ën oÌÎrimary CareÏÈCPC)
The International Classification of Primary Care Second Edition (ICPC-2) was used to classify the following data elements:
• Reasons for encounter
• Diagnoses
• Investigations
• Procedures
• Advice/counselling
The ICPC-2 is accepted by the World Health Organization (WHO) as a member of the WHO Family of International Classifications.9 It was published in 1987 by the World Organisation of Family Doctors (WONCA) and used in more than 45 countries as the standard for data classification in primary care. The ICPC-2 has a bi-axial structure, with 17 chapters based on body systems (Table 2.4.2) and seven components (Table 2.4.3) with rubrics bearing a letter and two-digit numeric code.
The data were entered and coded using ICPC-2 PLUS, an extended clinical terminology classified according to ICPC-2. ICPC-2 PLUS coding system contains extended terms commonly used in general practice that are more specific, and helps to ensure accurate classification to ICPC-2 during data entry. ICPC-2 PLUS was developed in 1995, and is maintained and regularly updated by the Family Medicine Research Centre (FMRC) of the University of Sydney.10 Also known as BEACH coding system, ICPC-2 PLUS is primarily used in Australia especially for the national study of general practice activity, the BEACH program.4
Table 2.4.2: ICPC-2 chapters
• • • • •
Table 2.4.2: ICPC-2 chapters
Code ICPC-2 chapter Code ICPC-2 chapter
A General B Blood, immune system
D Digestive F Eye
H Ear K Circulatory
L Musculoskeletal N Neurological
P Psychological R Respiratory
S Skin T Endocrine, nutritional & metabolic
Ð Urological W Women’s health, pregnancy, family planning
Ñ Female genital Y Male genital
Z Social problems
Table 2.4.3: ICPC-2 components
ICPC-2 components Code
1. Complaints and symptoms 01–29
2. Diagnostics, screening and preventive 30–49
3. Medication, treatment, procedures 50–59
4. Test results 60–61
5. Administrative 62
6. RÒ Óerrals 63–69
7. Diagnoses, diseases 70–99
inÓÒctious neoplastic
inÔ Õries
congenital anomalies
others
The National Clinical Research Centre has been granted a free research licence from WONCA for the usage of ICPC-2 codes in the NHSI project which is valid from February 2011 till end of 2014 whereas the ICPC-2 PLUS was obtained under a free licence from the University of Sydney.
Results were reported at the ICPC-2 classification level. Some of the diagnoses were grouped together by combining several ICPC-2 or ICPC-2 PLUS codes (Appendix 4). Classification of pathology and imaging test according to ICPC-2 can be very broad (e.g. HbA1c test is classified under T34 - Blood test endo/metabolic). Hence, results for Chapter 10 were presented as ICPC-2 PLUS.
Öna× ØmÙ ÚaÛÜherapeu×Ù Ú ChemÙ ÚaÛÝÖÜCÞÚlassÙßÙ Úa×ÙØn
Medications were coded and classified using the Anatomical Therapeutic Chemical (ATC) classification system. ATC has been recommended by the WHO and used in many countries including Malaysia, as a global standard for classifying medications for drug utilisation research, evaluating trend of drug consumption and for international comparisons.11,12 Medications are classified into groups at five different levels, with the following example:
• Level 1: C - Cardiovascular system
• Level 2: C10 - Serum lipid reducing agents
• Level 3: C10A - Cholesterol of triglyceride reducers
• Level 4: C10AA - HMG CoA reductase inhibitors
• Level 5: C10AA01 – Simvastatin
25
Chapter 2 : Methodology• • • • •
2.5 DATA ANALYSIS
Weighting
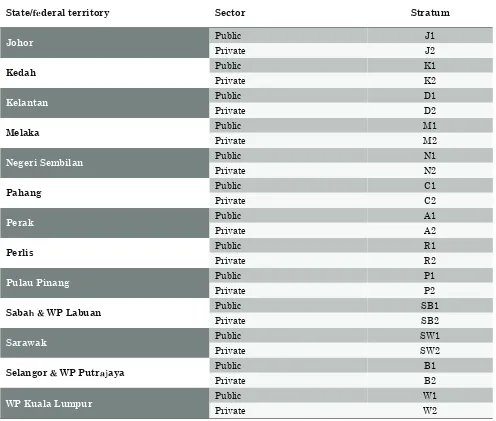
The data presented in this report were weighted to adjust for over and under representativeness of any strata in the sample as well as to account for non-respondents. Table 2.5.1 shows the 28 weighting strata that were defined for the study population, by state/region and sector. The components incorporated in the estimation of total weights are described below.
Table 2.5.1: Strata according to state/region and sector
State/à áderal territory Sector Stratum
Johor Public J1
Private J2
Kedah Public K1
Private K2
Kelantan Public D1
Private D2
Melaka Public M1
Private M2
Negeri Sembilan Public N1
Private N2
Pahang Public C1
Private C2
Perak Public A1
Private A2
Perlis Public R1
Private R2
Pulau Pinang Public P1
Private P2
Sabaâã WP Labuan
Public SB1
Private SB2
Sarawak Public SW1
Private SW2
Selangorã WP Puträ åaya
Public B1
Private B2
WP Kuala Lumpur Public W1
Samplingæeigç è
Sampling weight is the inverse of the probability of selecting a unit.13 The sampling weight of each stratum calculated as follow14:
���= � ��
�.��� + ��.��� + ��.���
where Mj is the total number of primary care clinics that can be sampled in the jth strata (population), méêë ì íis the number of primary care clinics responded for strata j, mjênon is the number of primary care clinics who did not respond in the jth strata, and m
éêì îc is the number of clinics excluded after being sampled for strata ïð
ñ ò èó ô óèõæeighè
The activity weight for each clinic was calculated to account for the different level of activities of each clinic. It was calculated as follows:
���� = ������
where Njk is the expected patients’ visits per day of the kth clinic in the jth strata while njk is the number of encounters we received from the kth clinic in the jth strata.
ñdö ÷sèøenèù úr nonûresponse
To account for less than 100% response rate, adjustment for the non-response is required.12 The non-response adjustment weight was calculated as follows:
�� = ��.���� + ��.��� �.���
where méêëì í is the number of primary care clinics responded for strata j and mjênon is the number of primary care clinics who did not respond in the jth strata.
üoèýþæeighè
The final weight for each stratum was calculated as the multiplication of the sampling weight, activity weight and adjustment for non-response.
��!"=��!��!"�!
The weighted estimates were generated using the survey package in R.
27
Chapter 2 : Methodology���= � ��
�.��� + ��.��� + ��.���
���� = ������
�� = ��.���� + ��.��� �.���
��!"=��!��!"�!
Statistical analysis
Analysis was done in R15 with an R package called "survey: analysis of complex survey samples".16 Results are presented as number of unweighted counts, weighted counts, proportions and rate per 100 encounters along with 95% confidence interval (CI). Rate per 100 diagnoses are reported for management that can occur at more than once per diagnosis.
2.6 ETHICS APPROVAL
The study was approved by the Medical Research and Ethics Committee (MREC) (Approval Number: NMRR-09-842-4718). As per previous study, a public notice was placed at each participating clinic to inform patients that their prescription data would be collected for research purposes. Patients had the right to decline to participate at any point of time throughout the study period.
2.7 LIMITATIONS
1. The survey is self-administered and therefore precision of data depends largely on the completeness of recording by respondents, hence may not accurately reflect true practice.
2. The survey is encounter-based and reflects the morbidity pattern observed in the primary care setting rather than the prevalence of disease in the community.
3. The morbidity patterns reflect only those morbidities managed during the recorded encounters. There may be co-morbidity in the same patient which was not expected to be managed during the encounter and hence was not recorded.
4. This is a cross-sectional study. Therefore, no conclusions may be generated on the outcomes of management of acute and chronic diseases in the primary care setting. Prescriptions, procedures, imaging and referrals reported were those provided at the present point of encounter and did not necessarily indicate that the patient has not already received them in a previous encounter.
5. Maternal child health encounters in public clinics were mostly attended by trained nurses. NMCS 2014 might miss those cases as not all the trained nurses were involved in the study.
6. The sampling of public clinics can be improved by incorporating the classification of the type of clinics, which is based on the workload of the clinic.
7. ÿerification of data received via audit process was not done. All data received were presumed to be accurate and precise.
8. Benchmarking the sample against population data cannot be performed as there is no readily available primary care population data, be it the providers or the patients.