Genetic diversity in the mitochondrial DNA D-loop region of global
swine (
Sus scrofa
) populations
Junxia Zhang
a,c, Ting Jiao
b, Shengguo Zhao
a,*aFaculty of Animal Science&Technology, Gansu Agricultural University, Lanzhou 730070, Gansu, PR China bFaculty of Grassland, Gansu Agricultural University, Lanzhou 730070, Gansu, PR China
cFaculty of Agriculture and Animal Husbandy, Qinghai University, Xining 810016, Qinghai, PR China
a r t i c l e
i n f o
Article history: Received 9 March 2016 Accepted 26 March 2016 Available online 6 April 2016
Keywords: Mitochondrial DNA Genetic diversity Indigenous pig Commercial pig
a b s t r a c t
Increased global use of highly productive commercial breeds has reduced genetic diversity in indigenous breeds. It is necessary to protect local porcine breeds. We therefore assessed the level of genetic diversity in global swine populations. In this study, the mitochondrial DNA D-loop region was examined in 1010 sequences from indigenous pigs and commercial swine as well as 3424 publicly available sequences We identified 334 haplotypes and 136 polymorphic sites. Genetic diversity was analyzed based on basic parameters, including haplotype diversity, nucleotide diversity and the average number of nucleotide differences, and also assessed by principal component analysis. A comparison of nucleotide diversity and the average number of nucleotide differences between indigenous breeds and commercial breeds showed that indigenous pigs had a lower level of diversity than commercial breeds. The principle component analysis result also showed the genetic diversity of the indigenous breeds was lower than that of commercial breeds. Collectively, our results reveal the Southeast Asian porcine population exhibited the higher nucleotide diversity, whereas Chinese population appeared consistently lower level in Asia. European, American and Oceanian pigs had a relatively higher degree of genetic diversity compared with that of Asian pigs. In conclusion, ourfindings indicated that the introgression of com-mercial into indigenous breeds decreased indigenous breeds' genetic diversity.
©2016 Elsevier Inc. All rights reserved.
1. Introduction
Animal production has significantly increased during the last couple of decades. However, the downside is that increased global use of highly productive breeds has been coupled to loss of genetic diversity in most species of farm animals[1]. Indigenous breeds are often replaced by globally used highly productive breeds [2]. Indigenous pig populations are an important genetic resource worldwide. The development and distribution of the populations is shaped by environmental factors, resulting from extremes of climate and geography, leaving many populations with special and unique characteristics. Unfortunately, these populations are under increasing pressure from integration or replacement with com-mercial breeds with fast growth rates and a very high lean content. In fact, many of the indigenous pig breeds are at risk for extinction
[3]. The genetic diversity of the commercial breeds may be quite
small, because a small number of sires are selected to have a multitude of progeny[1]. The decline in the genetic diversity of pig population is an serious problem. It is, therefore, important to study the genetic diversity of both indigenous and commercial breeds.
Porcine mtDNA is a 16 kb circular molecule. It contains a non-coding region, the displacement (D)-loop, which contains regula-tory sequences controlling both replication and transcription of mtDNA[4,5]. Analysis of mtDNA sequence diversity has provided important insights into the origin and diversification of modern pig populations. Previous studies of porcine mtDNA have revealed that domestic pigs (Sus scrofa domesticus) originated from wild boars (Sus scrofa scrofa) and the independent domestication of pigs in Asia and Europe[4,6e8]. Other studies have examined mtDNA
di-versity in European and Asian pigs[9e11]. In the present study, we
examined sequence variation in mtDNA from global pig pop-ulations, specifically focusing on nucleotide polymorphisms in the D-loop region. We also assessed the relative impact of commercial pigs on indigenous pig populations. This study will acquire the information of the porcine genetic diversity worldwide. Thefi nd-ings will be helpful for conservation and sustainable use of these
*Corresponding author.
E-mail address:[email protected](S. Zhao).
Contents lists available atScienceDirect
Biochemical and Biophysical Research Communications
j o u r n a l h o m e p a g e :w w w . e l s e v i e r . c o m / l o c a t e / y b b r c
resources.
2. Materials and methods
2.1. Sampling and DNA extraction
A total of 11breeds, including 1010 individuals distributed in Sichuan province, Tibetan highlands, Gansu province, Yunnan province, Shandong province and Qinghai Province of China, were collected (Information on collected samples provided inTable S1). Blood samples were collected from the jugular vein into ACD-containing vacuum tubes and preserved at20 C. And 10 mL blood were collected from each pig. Ear tissues were collected into 1.5 mL microcentrifuge tubes containing 75% ethanol, and pre-served at 80 C until DNA extraction. Animals were released immediately following treatment of the wounds with antiseptic.
DNA was extracted and purified using the phenol-chloroform extraction method[12].
2.2. PCR and sequencing
A fragment of the D-loop region was amplified using the primers: Forward strand 50-CCAAAAACAAAGCAGAGTGTAC-30and
Reverse strand 50-CGTTATGAGCTACCGTTATA-30. PCR reactions
were performed in afinal volume of 60
m
L with the following: 30m
L2 Eco Taq PCR Supermix containing 1 U Taq polymerase, 500 mМdNTPs, and 10✕Taq buffer (Beijing TransGen Biotech Co., Ltd, China), 0.2
m
g template DNA, 0.5m
L 10 pmol/mL of each primerand 28
m
L ddH2O. PCR conditions included an initial denaturation at94C for 5 min, followed by 34 cycles of 94C for 20 s, 58C for 60 s
and 72 C for 60 s, and a final extension for 10 min at 72 C.
Amplified DNA fragments were purified following agarose gel electrophoresis and sequenced using the ABI 3130 DNA sequencer (Applied Biosystems, Foster City, CA, USA).
2.3. Data analysis
A total of 4434 mtDNA D-Loop sequences were analyzed in this study. Sampling provided 1010 sequences, including 905 sequences from indigenous pigs and 105 sequences from commercial pigs. Considering the quantitative limitation of testing sequences, an additional 3424 sequences were downloaded from GenBank to provide a more comprehensive analysis of the genetic diversity of global pig populations. The downloaded sequences included 3070 sequences from indigenous pigs and 354 sequences from com-mercial pigs. Distribution, sampling size on all downloaded se-quences is provided in Table S2, Fig. S1 and Fig. S2. GenBank accession numbers and other detailed information of all sequences in this study are listed inTable S3.
Original sequence data obtained using the 3130 ABI PRISM DNA sequencer. software. DNASTAR was used to align sequences, MEGA 5.0 was used to collect sequences[13]. ClustalX 1.81 was utilized to align D-Loop sequences[14]. All sequences were expected to be approximately 435 bp in length. Thus, sequences that were significantly shorter than 435 bp were excluded from further study. In addition, DnaSP 5.0 software was used to analyze the haplotypes of all sequences and genetic diversity[15]. Spss16.0 was used to conduct correlation analysis and principal component analysis (PCA).
Based on the distribution, source and characteristics of the global populations, 4434 individuals from 128 local breeds were divided into 80 population for statistical analysis to further illus-trate the distribution of pig breeds worldwide and to examine ge-netic diversity.
3. Results
3.1. Single nucleotide polymorphism (SNP) analysis
We examined 1010 D-loop fragment sequences isolated from pigs, in addition to 3424 mtDNA sequences previously deposited in GenBank. A total of 435 bp were analyzed for single nucleotide polymorphisms (SNPs). No insertion/deletions (indels) were detected in our 1010 novel sequences, whereas the downloaded 3424 sequences had several indels compared with our novel se-quences, and these indels were excluded for the alignment step and subsequent analyses. We identified a total of 136 polymorphic sites, representing 31.7% of the total sites analyzed, including 55 single variable sites and 81 parsimony informative sites. The four types of nucleotide mutations identified were transitions, transversions, insertions and deletions. Except for eight of the 136 variable sites representing insertions/deletions of single base pairs. In the remaining 128 variable sites, 89.59% were single nucleotide tran-sitions and 10.41% were transversions. The transition:transversion ratio R (Ts/Tv) was 8.61:1, indicating a strong transitional bias that is common in mammalian mitochondrial evolution [16]. We detected that there were no nucleotide mutations from site 1 to 50, and represented that this was a relatively conservative region, and the variable region was found between sites 51 and 400. The highly variable region ranged from sites 30to 330.
3.2. Haplotype analysis
In total, 334 haplotypes were identified from the 4434 samples according to the characters of variable sites distribution (Table S4). Distribution frequencies of haplotypes indicated no equilibrium. The highest frequency haplotype was Hap226 which was shared by 658 sequences. The lowest frequency haplotypes were 168 which harbored a sequence respectively. And other haplotypes 166 hap-lotypes were shared by two or more sequences. Hap8, Hap3, Hap78, Hap181, Hap24, Hap251, Hap268 and Hap226 were advantageous haplotypes which were present in more than 100 sequences. 47 haplotypes were identified in commercial pigs, and 287 haplotypes were found in indigenous pigs. The indigenous porcine population with the most haplotypes was in Indonesia, which shared sixty haplotypes. The population with a haplotype showed in Croatia, Denmark, Iceland, Iran, Macedonia, Mexico, Morocco, the Netherlands, Pakistan, Turkey and Shanxi Province in China.
3.3. Genetic diversity analysis
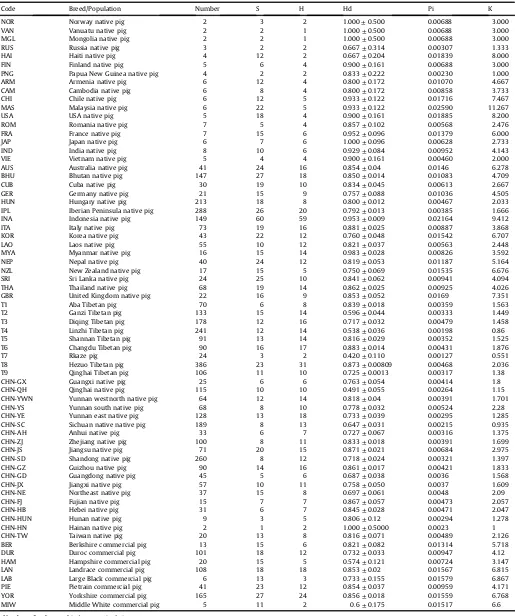
The basic parameters that were used to assess genetic diversity in the global pig population included haplotype diversity (Hd), nucleotide diversity (Pi) and average number of nucleotide differ-ences (K;Table 1). Hd is a measure of the uniqueness of a particular haplotype in a given population (Masatoshi Nei), which reflects haplotype abundance in a population. Pi measures the degree of polymorphism within a population [17]. Pi and K represent the degree of haplotype mutation intrapopulation. Hd of the global pig populations was between 0.491 and 1.000; Pi was between 0.00127 and 0.02590; K ranged from 0.551 to 11.267. Hd of the commercial pigs were higher than that of indegious pigs. Hd distributed in 0.674e0.856. Yorkshire had the highest Hd (0.856), while
Hamp-shire had the lowest Hd. Hd of indigenous pigs had a highly variable range (0.491e1.000). Norway, Vanuatu, Mongolia, Japan and
Table 1
Parameters for determination of genetic diversity of global pig populations.
Code Breed/Population Number S H Hd Pi K
NOR Norway native pig 2 3 2 1.000±0.500 0.00688 3.000
VAN Vanuatu native pig 2 2 1 1.000±0.500 0.00688 3.000
MGL Mongolia native pig 2 2 1 1.000±0.500 0.00688 3.000
RUS Russia native pig 3 2 2 0.667±0.314 0.00307 1.333
HAI Haiti native pig 4 12 2 0.667±0.204 0.01839 8.000
FIN Finland native pig 5 6 4 0.900±0.161 0.00688 3.000
PNG Papua New Guinea native pig 4 2 2 0.833±0.222 0.00230 1.000
ARM Armenia native pig 6 12 4 0.800±0.172 0.01070 4.667
CAM Cambodia native pig 6 8 4 0.800±0.172 0.00858 3.733
CHI Chile native pig 6 12 5 0.933±0.122 0.01716 7.467
MAS Malaysia native pig 6 22 5 0.933±0.122 0.02590 11.267
USA USA native pig 5 18 4 0.900±0.161 0.01885 8.200
ROM Romania native pig 7 5 4 0.857±0.102 0.00568 2.476
FRA France native pig 7 15 6 0.952±0.096 0.01379 6.000
JAP Japan native pig 6 7 6 1.000±0.096 0.00628 2.733
IND India native pig 8 10 6 0.929±0.084 0.00952 4.143
VIE Vietnam native pig 5 4 4 0.900±0.161 0.00460 2.000
AUS Australia native pig 41 24 16 0.854±0.04 0.0146 6.278
BHU Bhutan native pig 147 27 18 0.850±0.014 0.01083 4.709
CUB Cuba native pig 30 19 10 0.834±0.045 0.00613 2.667
GER Germany native pig 21 15 9 0.757±0.088 0.01036 4.505
HUN Hungary native pig 213 18 8 0.800±0.012 0.00467 2.033
IPL Iberian Peninsula native pig 288 26 20 0.792±0.013 0.00385 1.666
INA Indonesia native pig 149 60 59 0.953±0.009 0.02164 9.412
ITA Italy native pig 73 19 16 0.881±0.025 0.00887 3.868
KOR Korea native pig 43 22 12 0.760±0.048 0.01542 6.707
LAO Laos native pig 55 10 12 0.821±0.037 0.00563 2.448
MYA Myanmar native pig 16 15 14 0.983±0.028 0.00826 3.592
NEP Nepal native pig 40 24 12 0.819±0.053 0.01187 5.164
NZL New Zealand native pig 17 15 5 0.750±0.069 0.01535 6.676
SRI Sri Lanka native pig 24 25 10 0.841±0.062 0.00941 4.094
THA Thailand native pig 68 19 14 0.862±0.025 0.00925 4.026
GBR United Kingdom native pig 22 16 9 0.853±0.052 0.0169 7.351
T1 Aba Tibetan pig 70 6 8 0.839±0.018 0.00359 1.563
T2 Ganzi Tibetan pig 133 15 14 0.596±0.044 0.00333 1.449
T3 Diqing Tibetan pig 178 12 16 0.717±0.032 0.00479 1.458
T4 Linzhi Tibetan pig 241 12 14 0.538±0.036 0.00198 0.86
T5 Shannan Tibetan pig 91 13 14 0.816±0.029 0.00352 1.525
T6 Changdu Tibetan pig 90 16 17 0.883±0.014 0.00431 1.876
T7 Rkaze pig 24 3 2 0.420±0.110 0.00127 0.551
T8 Hezuo Tibetan pig 386 23 31 0.873±0.00809 0.00468 2.036
T9 Qinghai Tibetan pig 106 11 10 0.725±0.0013 0.00317 1.38
CHN-GX Guangxi native pig 25 6 6 0.763±0.054 0.00414 1.8
CHN-QH Qinghai native pig 115 10 10 0.491±0.055 0.00264 1.15
CHN-YWN Yunnan westnorth native pig 64 12 14 0.818±0.04 0.00391 1.701
CHN-YS Yunnan south native pig 68 8 10 0.778±0.032 0.00524 2.28
CHN-YE Yunnan east native pig 128 13 18 0.733±0.039 0.00295 1.285
CHN-SC Sichuan native native pig 189 8 13 0.647±0.031 0.00215 0.935
CHN-AH Anhui native pig 33 6 7 0.727±0.067 0.00316 1.375
CHN-ZJ Zhejiang native pig 100 8 11 0.833±0.018 0.00391 1.699
CHN-JS Jiangsu native pig 71 20 15 0.871±0.021 0.00684 2.975
CHN-SD Shandong native pig 260 8 12 0.718±0.024 0.00321 1.397
CHN-GZ Guizhou native pig 90 14 16 0.861±0.017 0.00421 1.833
CHN-GD Guangdong native pig 45 5 6 0.687±0.038 0.0036 1.568
CHN-JX Jiangxi native pig 57 10 11 0.758±0.050 0.0037 1.609
CHN-NE Northeast native pig 37 15 8 0.697±0.061 0.0048 2.09
CHN-FJ Fujian native pig 15 7 7 0.867±0.057 0.00473 2.057
CHN-HB Hebei native pig 31 6 7 0.845±0.028 0.00471 2.047
CHN-HUN Hunan native pig 9 3 5 0.806±0.12 0.00294 1.278
CHN-HN Hainan native pig 2 1 2 1.000±0.5000 0.0023 1
CHN-TW Taiwan native pig 20 13 8 0.816±0.071 0.00489 2.126
BER Berkshire commercial pig 13 15 6 0.821±0.082 0.01314 5.718
DUR Duroc commercial pig 101 18 12 0.732±0.033 0.00947 4.12
HAM Hampshire commercial pig 20 15 5 0.574±0.121 0.00724 3.147
LAN Landrace commercial pig 108 18 18 0.853±0.02 0.01567 6.815
LAB Large Black commercial pig 6 13 3 0.733±0.155 0.01579 6.867
PIE Pietrain commercial pig 41 23 12 0.854±0.037 0.00959 4.171
YOR Yorkshire commercial pig 165 27 24 0.856±0.018 0.01559 6.768
MIW Middle White commercial pig 5 11 2 0.6±0.175 0.01517 6.6
S: Number of polymorphic (segregating) sites.
Pi: Nucleotide diversity, Nei 1987, equations 10.5 or 10.6 (Masatoshi Nei). K: Average number of nucleotide differences; Tajima 1983, equation A3 (Tajima).
and K (6.867), while Hampshire had the lowest Pi(0.00724) and K (3.147). In indigeous pigs, Malaysia had the highest Pi (0.02590) and K (11.267). Sequences from pigs in Rkaze of China had the lowest Pi (0.00127) and K (0.551). The number of domestic pigs from Croatia,
Denmark, Iceland, Iran, Macedonia, Mexico, Morocco, Netherland, Pakistan, Turkey and the Chinese province of Shanxi sampled in this study was small, therefore, the genetic diversity in these re-gions was not examined.
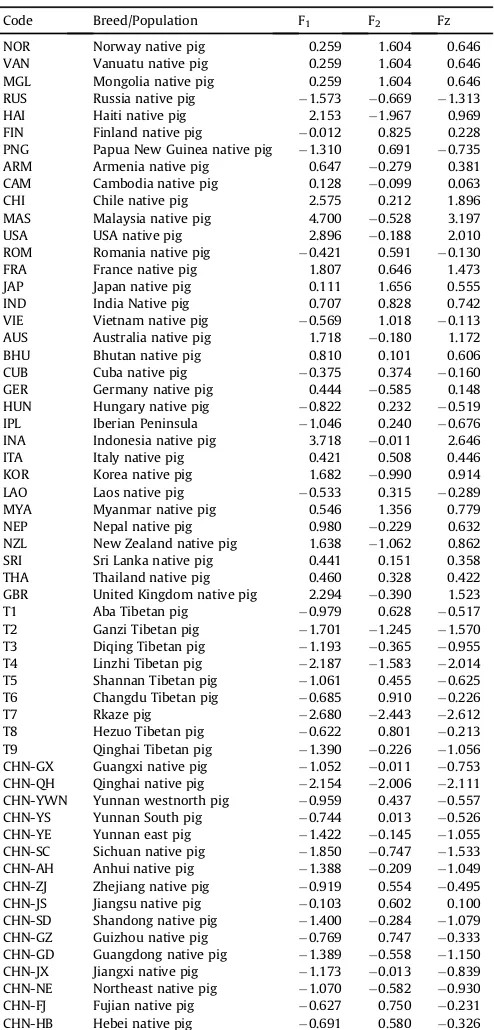
Principal component analysis (PCA) is a statistical procedure to reduce the dimensionality of a data set by transforming to a new set of variables (the principal components) to summarize the features of the data [18]. In order to assess porcine diversity worldwide, we analyzed Hd, Pi and K using correlation analysis and PCA. Table 2 presents the correlation analysis results from indigenous pigs. All three parameters were positively correlated, and the correlation degree of Pi and K was 0.999. This reflects the degree of mtDNA diversity in the hypervariable segment 1 (HVS1) region.
Genetic diversity was analyzed by the PCA and the results were showed atTable 3. It shows the score of the porcine breeds/pop-ulation defined by principal component factor scores based on a components matrix (Table 4) from Hd, Pi and K. We extracted two principal components (F1 and F2). F1 reflects the variation in Pi and K, and F2 shows variation in Hd. Based on the PCA pattern, we obtained an synthesized assessment score (Fz). The Fz score indicated higher genetic diversity in Malaysian native pig relative to other breeds worldwide and lower genetic diversity for Rkaze Tibetan pigs of China and most Chinese populations/breeds (Fig. 1).
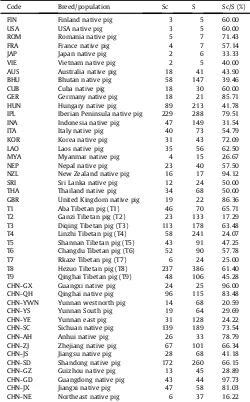
3.4. Shared haplotypes between commercial and indigenous breeds
Haplotypes in 3975 individuals from 72 native breeds/pop-ulations and 459 individuals from eight commercial breeds were identified. Three hundred and fourteen haplotypes were identified in indigenous pigs and 47 haplotypes were identified in commer-cial pigs. Twenty-seven shared haplotypes were identified between indigenous and commercial pigs distributed among 2132 indige-nous and 425 commercial pigs. Shared haplotype between indi-geous and commercial pigs were be counted in our study. The ratio of the number of indigenous pigs with shared haplotypes and total of indigenous pigs (Sc/S) showed the degree of indigeous pigs affected by commercial pigs. The average percentage of Sc/S was 53.64% and ranged from 0 to 97.73% (Table 5). Our data showed that
Table 4
Scores and general PCA scores of different populations.
Code Breed/Population F1 F2 Fz
NOR Norway native pig 0.259 1.604 0.646 VAN Vanuatu native pig 0.259 1.604 0.646 MGL Mongolia native pig 0.259 1.604 0.646 RUS Russia native pig 1.573 0.669 1.313 HAI Haiti native pig 2.153 1.967 0.969 FIN Finland native pig 0.012 0.825 0.228 PNG Papua New Guinea native pig 1.310 0.691 0.735 ARM Armenia native pig 0.647 0.279 0.381 CAM Cambodia native pig 0.128 0.099 0.063 CHI Chile native pig 2.575 0.212 1.896 MAS Malaysia native pig 4.700 0.528 3.197 USA USA native pig 2.896 0.188 2.010 ROM Romania native pig 0.421 0.591 0.130 FRA France native pig 1.807 0.646 1.473 JAP Japan native pig 0.111 1.656 0.555 IND India Native pig 0.707 0.828 0.742 VIE Vietnam native pig 0.569 1.018 0.113 AUS Australia native pig 1.718 0.180 1.172 BHU Bhutan native pig 0.810 0.101 0.606 CUB Cuba native pig 0.375 0.374 0.160 GER Germany native pig 0.444 0.585 0.148 HUN Hungary native pig 0.822 0.232 0.519 IPL Iberian Peninsula 1.046 0.240 0.676 INA Indonesia native pig 3.718 0.011 2.646 ITA Italy native pig 0.421 0.508 0.446 KOR Korea native pig 1.682 0.990 0.914 LAO Laos native pig 0.533 0.315 0.289 MYA Myanmar native pig 0.546 1.356 0.779 NEP Nepal native pig 0.980 0.229 0.632 NZL New Zealand native pig 1.638 1.062 0.862 SRI Sri Lanka native pig 0.441 0.151 0.358 THA Thailand native pig 0.460 0.328 0.422 GBR United Kingdom native pig 2.294 0.390 1.523 T1 Aba Tibetan pig 0.979 0.628 0.517 T2 Ganzi Tibetan pig 1.701 1.245 1.570 T3 Diqing Tibetan pig 1.193 0.365 0.955 T4 Linzhi Tibetan pig 2.187 1.583 2.014 T5 Shannan Tibetan pig 1.061 0.455 0.625 T6 Changdu Tibetan pig 0.685 0.910 0.226
T7 Rkaze pig 2.680 2.443 2.612
T8 Hezuo Tibetan pig 0.622 0.801 0.213 T9 Qinghai Tibetan pig 1.390 0.226 1.056 CHN-GX Guangxi native pig 1.052 0.011 0.753 CHN-QH Qinghai native pig 2.154 2.006 2.111 CHN-YWN Yunnan westnorth pig 0.959 0.437 0.557 CHN-YS Yunnan South pig 0.744 0.013 0.526 CHN-YE Yunnan east pig 1.422 0.145 1.055 CHN-SC Sichuan native pig 1.850 0.747 1.533 CHN-AH Anhui native pig 1.388 0.209 1.049 CHN-ZJ Zhejiang native pig 0.919 0.554 0.495 CHN-JS Jiangsu native pig 0.103 0.602 0.100 CHN-SD Shandong native pig 1.400 0.284 1.079 CHN-GZ Guizhou native pig 0.769 0.747 0.333 CHN-GD Guangdong native pig 1.389 0.558 1.150 CHN-JX Jiangxi native pig 1.173 0.013 0.839 CHN-NE Northeast native pig 1.070 0.582 0.930 CHN-FJ Fujian native pig 0.627 0.750 0.231 CHN-HB Hebei native pig 0.691 0.580 0.326
Table 3(continued)
Code Breed/Population F1 F2 Fz
CHN-HUN Hunan native pig 1.227 0.426 0.752 CHN-HN Hainan native pig 0.857 1.993 0.038 CHN-TW Taiwan native pig 0.726 0.339 0.420
BER Berkshire 1.294 0.321 0.830
DUR DUR
Duroc 0.160 0.704 0.088
HAM Hampshire 0.811 1.748 1.080
LAN Landrace 1.995 0.286 1.340
LAB Large Black 1.699 1.232 0.857
PIE Pietrain 0.520 0.237 0.438
YOR Yorkshire 1.980 0.254 1.338
indigenous pigs were impacted by commercial pigs. If the number of sequences from a breed/population was less thanfive, Sc/S was not calculated due to the small sample size.
4. Discussion
4.1. Genetic diversity of the global pig population
The genetic diversity of global livestock populations is declining
[2]. Our study examined this trend in global pig populations. We analyzed the mtDNA D-Loop for haplotypes in 4434 samples, and found 334 haplotypes, including 166 shared haplotypes found in all sequences. We also analyzed genetic diversity by basic parameters (Hd, Pi and K), and principal component analysis. Previous studies established that the level of genetic variation among Asian pigs was lower than that among European domestic pigs[7,11], and the re-sults of this study are consistent with thosefindings. The global pig population is approximately one billion, two thirds of this popu-lation is found in Asia, with the majority found in China[2]. Genetic diversity is low in these pigs, due to commercial hybridization. Chinese indigenous pigs show some unfavorable traits such as slow growth, small body weight, low dressing percentage and high back fat thickness. To improve production, these populations are crossed with commercial pigs (Duro, Landrace and Yorkshire) [19]. Di-versity of indigenous porcine populations is, therefore, impacted by commercial breeds. There are a considerable number of pigs in Vietnam and India [2], and most of them were indigenous pigs. Genetic diversity in these countries was high. Europe and the Caucasus have approximately onefifth of the global pig population, while America has an additional 15%[2]. Genetic diversity is rela-tively high in these populations. No analysis was done for African pig populations due to a lack of data. Based on principle component analysis, Fz ranged from3.200e3.200, indicating that European,
American and Oceanian pigs had a similar level of diversity which was slightly higher than the Asian pig population. This is consistent with the analysis of the parameters Pi and K. The majority of populations/breeds focused in1.200e1.200, indicating a low level
of genetic diversity in pig populations globally. In conclusion, the mtDNA diversity observed underscores the significance of the indigenous breeds/populations as an important genetic resource.
A summary comparison of Pi and K between indigenous breeds
Table 5
Analysis of native pigs haplotypes shared with commercial pigs.
Code Breed/population Sc S Sc/S (%)
FIN Finland native pig 3 5 60.00
USA USA native pig 3 5 60.00
ROM Romania native pig 5 7 71.43
FRA France native pig 4 7 57.14
JAP Japan native pig 2 6 33.33
VIE Vietnam native pig 2 5 40.00 AUS Australia native pig 18 41 43.90 BHU Bhutan native pig 58 147 39.46
CUB Cuba native pig 18 30 60.00
GER Germany native pig 18 21 85.71 HUN Hungary native pig 89 213 41.78 IPL Iberian Peninsula native pig 229 288 79.51 INA Indonesia native pig 47 149 31.54 ITA Italy native pig 40 73 54.79 KOR Korea native pig 31 43 72.09
LAO Laos native pig 35 56 62.50
and commercial breeds showed that indigenous pigs have a lower level of diversity than commercial breeds. Principle component analysis results also showed the indigenous breeds had lower di-versity. Previous studies revealed a loss of porcine genetic diversity
[20,21]. Domestic pigs have a lower level of genetic diversity than wild boars as a general consequence of domestication [21] and indigenous pigs similarly have a lower level of genetic diversity
[20,22,23]. Genetic diversity is essential for continued breeding. This is especially true in the situation where future breeding goals differ from current goals [1]. Porcine genetic diversity could be useful for sourcing future breeds for livestock production, and supplements biodiversity databases being accumulated on pop-ulations and breeds throughout the world[23].
4.2. Introgression between commercial breeds and indigenous breeds
Shared haplotypes were identified in 53.64% of indigenous pigs.
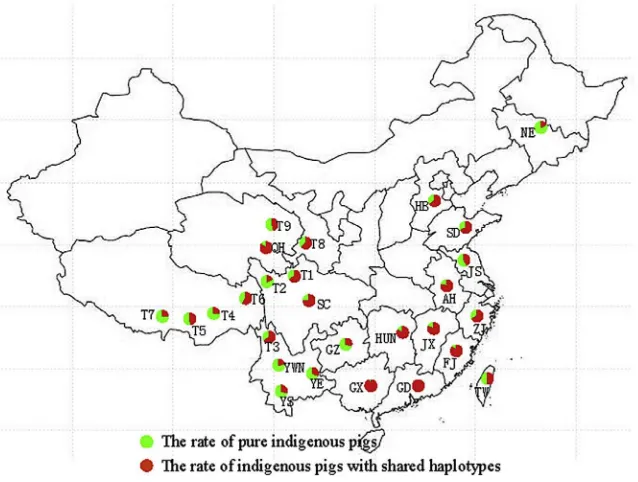
Fig. 2. Comparison of shared haplotype frequency between indigenous pig populations and commercial pigs (TIFF). Each pie chart showed the ratio of indigenous pigs shared haplotypes with commercial pigs and the ratio of pure indigenous pig. Figure showed that introgression of commercial pigs into indigenous in different regions.
Table 5(continued)
Code Breed/population Sc S Sc/S (%)
CHN-FJ Fujian native pig 13 15 86.67 CHN-HB Hebei native pig 20 31 64.52 CHN-HUN Hunan native pig 9 11 81.82
CHN-HN Hainan native pig 2 2 e
CHN-TW Taiwan native pig 10 20 50.00
Sc: Number of indigenous pigs sharing haplotypes with commercial pigs. S: Number of indigenous pigs.
Twenty-seven haplotypes that were shared with commercial pigs were identified in 2132 indigenous pigs. The frequency of shared haplotypes between indigenous and commercial pigs showed an unequal global distribution (Fig. 2). Frequency of shared haplotypes was low in Southeast Asia, where the native pig population was seldom affected by commercial pigs. In contrast, there was a high frequency of shared haplotypes in China, especially in Southeast China (Fig. 3). European, American and Oceanian pig populations also had a relatively high shared haplotype frequency. The reason for a higher shared haplotypes frequency in these indigenous populations was the introgression of Asian pigs into Europe, pri-marily during the eighteenth and nineteenth centuries [6,9]and crossbreeding with commercial lines. Some reports, however, show that the frequency of Asian haplotypes is low or absent in Duroc and Hampshire lines. Landrace lines were less affected by Asian introgression than Large White lines and Pietrains[9]. In addition, current commercial lines were introduced and crossed with indigenous breeds, increasing the lineage of commercial lines.
The indigenous pig population has been recognized as an important genetic resource, despite their potentially economically unfavorable characteristics, such as slow growth, small body weight, and black coat, amongst other unfavorable traits. Previ-ously, breeders improved indigenous porcine production by crossbreeding or breeding commercial lines directly [20,24]. In many regions, including Europe, the Caucasus, Africa and North America, relatively few indigenous pig populations exist. Conversely, there are many indigenous pig populations in Eastern Asia [2], although indigenous populations face the threat of extinction due to the introgression of commercial pigs. Increasing use of commercial lines threatens indigenous breeds and decreases genetic diversity. Recently, many countries have recognized the indigenous pig population as an important genetic resource due to specific traits (indigenous adaptation, strong adversity resistance, high meat quality and so on). The small number of the indigenous pigs could be used as founders to maintain the genetic character-istics of the indigenous population. The founder effect also results in a reduction in genetic variation, which may explain the low ge-netic diversity between indigenous pigs worldwide.
5. Author contributions
Conceived and designed the experiments: JXZ SGZ. Performed the experiments: JXZ SGZ TJ. Analyzed the data: JXZ SGZ. Contrib-uted reagents/materials/analysis tools: JXZ SGZ TJ. Wrote the paper: JXZ SGZ.
Acknowledgments
We thank for the financial support of the Natural Science Foundation of China (31101682). We thank Wenqiang Wang for help with experiments. We are grateful to Wenshan Zhen and Yongbo Qi for assistance with sample collections. We thank Dr. Megan Powdrill, and one of the highly qualified native English speaking editors at Elixigen Corporation (Huntington Beach, Cali-fornia, USA) for helping in proofreading and editing the English of final manuscript.
Appendix A. Supplementary data
Supplementary data related to this article can be found athttp://
dx.doi.org/10.1016/j.bbrc.2016.03.125.
Transparency document
Transparency document related to this article can be found online at10.1016/j.bbrc.2016.03.125.
References
[1] H. Woelders, C.A. Zuidberg, S.J. Hiemstra, Animal genetic resources conser-vation in The Netherlands and Europe: poultry perspective, in: The Poultry Science Association Ancillary Scientists Symposium, 2005, pp. 216e222. [2] FAO, in: B. Rischkowsky, D. Pilling (Eds.), The State of the World's Animal
Genetic Resources for Food and Agriculture, FAO, Rome, 2007. Available at: http://www.fao.org/docrep/010/a1250e/a1250e00.htm.
[3] S.D. Mackay, P.D. Olivo, P.J. Laipis, W.W. Hauswirth, Template-directed arrest of mammalian mitochondrial DNA synthesis, Mol. Cell. Biol. (1986) 1261e1267.
[4] K.I. Kim, J.H. Lee, K. Li, et al., Phylogenetic relationships of Asian and European pig breeds determined by mitochondrial DNA D-loop sequence poly-morphism, Anim. Genet. 33 (2002) 19e25.
[5] M.A. Toro, J.J. Rodriga~nez, L. Silio, M.C. Rod rıguez, Genealogical analysis of a closed herd of black hairless Iberian pigs, Cons. Biol. 14 (2000) 1843e1851. [6] E. Giuffra, J.M. Kijas, V. Amarger, O. Carlborg, J.T. Jeon, et al., The origin of the
domestic pig: independent domestication and subsequent introgression, Ge-netics 154 (2000) 1785e1791.
[7] N. Okumura, Y. Kurosawa, E. Kobayashi, Genetic relationship amongst the major non-coding regions of mitochondrial DNAs in wild boars and several breeds of domesticated pigs, Anim. Genet. 32 (2001) 139e147.
[8] G. Larson, Worldwide phylogeography of wild boar reveals multiple centres of pig domestication, Science 307 (2005) 1618e1621.
[9] M. Fang, L. Andersson, Mitochondrial diversity in European and Chinese pigs is consistent with population expansions that occurred prior to domestication, Proc. R. Soc. B 273 (2006) 1803e1810.
[10] C. Alex, A. Marcel, N. Jose Luís, Estimating the frequency of Asian cytochrome B haplotypes in standard European and local Spanish pig breeds, Genet. Sel. Evol. 36 (2004) 97e104.
[11] J. YANG, J. WANG, J. KIJAS, Genetic diversity present within the near-complete mtDNA genome of 17 breeds of indigenous Chinese pigs, J. Hered. 94 (5) (2003) 381e385.
[12] J. Sambrook, E.F. Frietsch, T. Maniatis, Molecular Cloning: a Laboratory Manual, third ed., Cold Spring Harbor Laboratory, Cold Spring Harbor, NY, USA., 2001.
[13] K. Tamura, D. Peterson, N. Peterson, G. Stecher, M. Nei, et al., MEGA5:mo-lecular evolutionary genetics analysis using maximum likelihood, evolu-tionary distance, and maximum parsimony methods, Mol. Biol. Evol. 28 (2011) 2731e2739.
[14] J.D. Thompson, T.J. Gibson, F. Plewniak, F. Jeanmougin, D.G. Higgins, The CLUSTAL_X windows interface: flexible strategies for multiple sequence alignment aided by quality analysis tools, Nucleic Acids Res. 25 (1997) 4876e4882.
[15] P. Librado, J. Rozas, DnaSP v5: a software for comprehensive analysis of DNA polymorphism data, Bioinformatics 25 (11) (2009) 1451e1452.
[16] K.I. Kim, Y.H. Yang, S.S. Lee, Phylogenetic relationships of Cheju horses to other breeds as determined by mtDNA D-loop sequence polymorphism, Anim. Genet. 30 (1989) 102e108.
[17] Nei Masatoshi, Tajima Fumio, DNA polymorphism detectable by restriction endonucleases, Genetics 97 (1981) 145.
[18] Jolliffe, Principal Component Analysis, Springer, New York, 1986.
[19] China national commission of animal genetic resources, Animal Genetic Re-sources in China Pigs, Chinese Agriculture Press, 2011.
[20] T.H. Kim, K.S. Kim, B.H. Choi, Genetic structure of pig breeds from Korea and China using microsatellite loci analysis, J. Animal Sci. 83 (2005) 2255e2263. [21] Y.Q. Ji, D.D. Wu, G.S. Wu, Multi-locus analysis reveals a different pattern of
genetic diversity for mitochondrial and nuclear DNA between wild and do-mestic pigs in East Asia, PLOS ONE 6 (2011) 1e12.
[22] K.S. Kim, J.S. Yeo, J.W. Kim, Assessment of genetic diversity of Korean native pig (Sus scrofa) using AFLP markers, Gen. Genet. Syst. 77 (2002) 361e368. [23] K.Y. Li, C. Chen, S. Zhao, Z. Peng, B.F. Moran, Analysis of diversity and genetic
relationships between four Chinese indigenous pig breeds and one Australian commercial pig breed, Anim. Genet. 31 (2000) 322e325.