A PRELIMINARY INVESTIGATION ON CHANGING TEMPERATURE MAXIMA-MINIMA DEVIATION (TMIN-MAX DEVIATION)
IN INDONESIA
Djoko Harmantyo [email protected]
Departement of Geography Faculty of Matematic and Natural Science University of Indonesia
ABSTRACT
While the immediate impacts of climate change have been widely discussed, there are only few researches on climate change revealing its effect to temperature amplitude. Changing temperature amplitude will hamper metabolism process, which in turn will decrease productivity and, even, cause the extinction of certain
organism species. This research will expose the changing temperature amplitude (T
min-max) including its trend pattern in Indonesia. The adoption of trend analysis method
and comparison analysis to the values of temperature amplitude in 60 AWS station from 1980-2007 indicates upward trend of annual mean temperature with shorter temperature amplitude. This shorter temperature amplitude is characterized by annual mean temperature maxima increase less than the rise of annual mean temperature minima. Data analysis finds indication, i.e. the more eastward direction, the
greater difference of average Tmin-max deviation. Yet, this research fails to show what
factors contributing to the changing temperature amplitude. More in-depth research of these factors at ecological scale will be necessary as crucial part in determining adaptation programs to this on-going climate change phenomenon.
Key words: climate change, temperature amplitude, Tmin-max
INTRODUCTION
The most glaring environmental issue in early 21st century undoubtedly concerns about the warming surface temperature of Earth resulting in climate change. According to IPCC (2007) the average surface temperature of earth was warmer by 0.74 0C from 1906-2005. By end of 21st century, this temperature will constantly rise at 1.1 – 6.4 0C. As for Indonesia, for the last 100 years, the surface temperature has been increasing at 0.10 – 0.20 0C range.
Indonesian Journal of Geography, Vol 43, No.1, June 2011 : 91 - 106
The rise of atmospheric temperature on Earth has changed climate process including more intensive evaporation process generating more vapors forming clouds and rain. This causes extreme rainfalls consisting of downpours in relatively longer period. This phenomenon is potential for floods, landslides that may claim enormous material loss and fatalities.
Warmer temperature also affects atmospheric pressure and air (wind) mass movement potential to incite storms and typhoons. These natural phenomena may devastate settlement infrastructure and facilities and claim lives. Recently, flood, landslide, storm and typhoon have been routine catastrophes in many regions around the world including Indonesia despite variation of frequency and severity.
Long draught compounded with extreme temperature will incite grave forest fires since more CO2 gas is concentrated in air. The fire indeed causes a lot of material and immaterial loss.
The obvious impact of temperature rise packed into global climate change issue becomes the focus of all countries worldwide. It is worried that this impact will disrupt the life on earth. Numerous initiatives have been taken to cope with the impacts of climate change including maximizing the consumption of non-fossil energy as alternatives such as bio-fuel, wind and tidal powered energy, geothermal and nuclear energy. In addition, REDD ++ (Reduction Emission for Deforestation and Degradation) program has been introduced particularly in the countries with vast forest areas.
n
X
X
r=
∑
iBased on the assumption that the widespread meteorologist disasters in Indonesia are more attributed to the constantly warming temperature, it raises a question. How is the characteristic of this warming temperature reviewed from the changing maximum and minimum temperature amplitude range? This aspect is interesting to investigate since any change of temperature amplitude range will affect metabolism process and disturb organism growth and development. In relatively long term, it will decrease productivity. Unless this condition is appropriately dealt with, the living balance on earth will be disrupted and very likely that the entire life in this planet will go to extinction.
In its preliminary stage, this research aims to identify the trend pattern of average temperature and temperature amplitude changes (Tmin-max) in Indonesia. The finding of this study can be used as information in investigating the adaptation capacity of living creatures such as plants, animals and human beings as the result of temperature rise and temperature amplitude range change (Tmin-max range) as tole-rable limit for the survival of organism.
THE METHODS
For this study, regional approach coupled with spatial analysis method (geographic analysis) and statistic analysis support have been adopted.
Temperature data of this study is based on direct measurement using Automatic Weather Station (AWS) performed by Meteorology Climatology and Geophysics Agency (BMKG) in 60 basic stations from 1980 to 2007. The base data is that of daily minimum and maximum temperatures.
Base data is processed to get average maximum temperature (average Tmax) and average minimum temperature (average Tmin). As to Tmin-max range, it is derived from the difference of average Tmin and average Tmax. The monthly range value of Tmin-max is used to compute the average monthly range value of Tmin-max for 28 years (1980-2007). Data of average Tmin, average Tmax and average range Tmin-max for 28 years is then processed into graphs. The trend is tested to measure its significance based on a time series data.
The adopted testing statistic is Pearson’s correlation coefficient in view of slope and significance level.
Temperature data is processed using formula:
Indonesian Journal of Geography, Vol 43, No.1, June 2011 : 91 - 106 Where:
xr = arithmetic mean of data n = number of data
xi = data to i
A simple regression formula, in which y is average temperature and x denotes year.
a is initial constant and b is regression coefficient.
To identify the change of T min-max range it is conducted by dividing data into 3 (three) periods of period I (1980-1989), period II (1990-1990) and period III (2000-2007). The position of average distribution of each period to the other periods will be used to identify the changing trend of T min-max range. Identification in AWS station with extreme value is to identify the effects of latitude position, distance to coast line, elevation and slope. The distribution of AWS stations used in this research is presented below.
Figure1. Map of AWS distribution in Indonesia [BMKG, 2007]
Theory Appreciation
“Climates are not indefinitely stable”. This statement on climate by experts
The phenomenon of climate change in short cycle is shown with the changing surface temperature of earth according to temperature data recording in UK from 1680 to 1970 (Fig. 1).
Figure 2. Annual mean temperature from 1680-1970 in central regions of London
[Haggett, 2001].
Fig. 2 shows regularity in temperature change cycle pattern every 50 years. The lowest temperature was recorded in around year 1700 and year 1900. As to the highest temperature, it was recorded around year 1730 and 1930.
Climate cycle change patterns every 200,000 years as illustrated in Figure 3 show Allerod, Boreal and Subboreal as sinklin and Dryas, Atlantic and Sub-Atlantic as anticline. Cycle of 2,000,000 years is indicated by primary interglacial cycle (ice age), i.e. Gunz, Mindel, Riss and Wurm, where between these ice ages climate with the collets and hottest temperatures were formed.
Indonesian Journal of Geography, Vol 43, No.1, June 2011 : 91 - 106
Further perusal to Fig. 3 will raise question. Does the on-going warming temperature on earth constitute the beginning of the fifth interglacial period? Equator regions receive averagely more intensified sun radiation than regions situated in higher latitude, i.e. some 900 Gm.cal.per cm2 [Trewarta, 1954]. Accordingly, these equatorial areas will have longer sun exposure time, i.e. around 12 hours per day and more warm days in a year. In the global views, heating through ‘radiative forcing’ raises the temperature of the atmosphere until radiation to space increases sufficiently to bring the planet back into thermal equilibrium. According to Camilleri (2009, p. 258), the Earth’s average surface temperature had increased by about 0.76 +/- 0.19 degree C and some 70% of that increase had occurred since 1950 and was attributable to human intervention.
Solar radiation falling in the surface of earth consists of short wave radiation, which part of it will be reflected back to atmosphere by earth in the form of long wave radiation. This long wave radiation produces sensible heat and can be measured as temperature parameter in 0C scale Linacre in [Harmantyo, 2009] using thermometer. The energy of sensible heat is not classified as chemical energy of photosynthesis process in plants or radiation energy or evaporation energy.
In troposphere (0 – 10,000 m above sea level), the higher place from earth surface, the lower temperature. At air pressure 1,000 mb and temperature 20 0C, the temperature will decrease by 4.4 0C for every 1,000 m higher, meanwhile at air pressure 600 mb and temperature 20 0C the surface temperature will drop by 3.6 0C for every 1,000 m higher [Bruce, 1966]. According to [Sandy, 1987] surface tem-perature in Indonesia will decrease by 0.6 0C for every 100 m higher.
According to [Strahler, 2003], temperature change is subject to insulation, elevation, earth surface type, coast and land location, slope and greenhouse effect in atmosphere, aerosol of volcanoes, changing land use and aerosol of troposphere.
At micro scale, the changing temperature will affect metabolism reaction of organism body. Metabolism increase to temperature is measured with temperature coefficient value (Q10) to identify the effect of changing temperature to organism development and growth [Mackenzie, 2001].
Metabolic rate at body temperature T degree C Q10 = --- Metabolic rate at body temperature (T-10) degree C
The value of the coefficient indicates the increase in reaction rate caused by a 10 degree C rise in temperature, and is commonly about 2.0, althought Q10 is not constant across all temperatures, showing deviations towards the upper and lower thermal limits of an organism.
Within the nonlethal temperature range for an ectotherm, the most important effect of temperature is likely to be its effect on the rate of development and growth of the organism [Mackenzie, 2001. p. 47].
RESULTS AND DISCUSSION
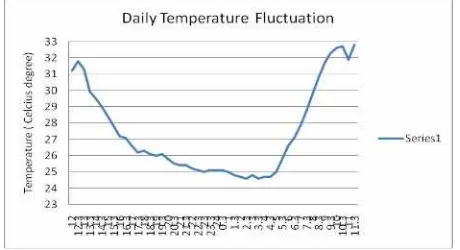
Indonesia is situated in equator region. As such the entire territories of Indonesia receive sun radiation for 12 hours per day with maximum temperature at 12.00 am – 14.00 pm and minimum temperature at 03.00 am – 05.00 am. For the daily temperature fluctuation pattern, see Fig. 4.
Figure.4. Daily temperature on 6 – 7 May 2010 at UI Depok Station.
Fig. 4 shows that on day-to-day basis, temperature may change dynami-cally. Its change caused by wind speed, humidity and clouds.
Indonesian Journal of Geography, Vol 43, No.1, June 2011 : 91 - 106
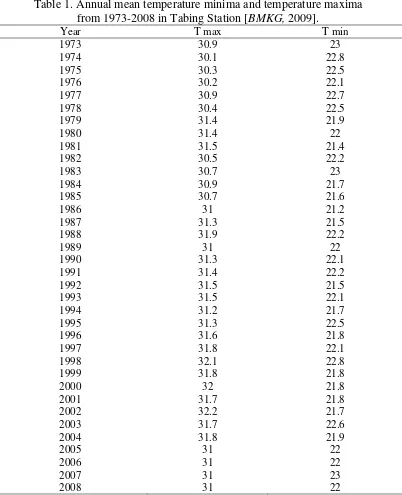
Table 1. Annual mean temperature minima and temperature maxima from 1973-2008 in Tabing Station [BMKG, 2009].
Figure 5. Annual mean temperature maxima from 1973-2008 in Tabing station.
Irregularities in temporary pattern of average maximum temperature change in Fig. 5 indicate various factors affecting temperature in Tabing Station.
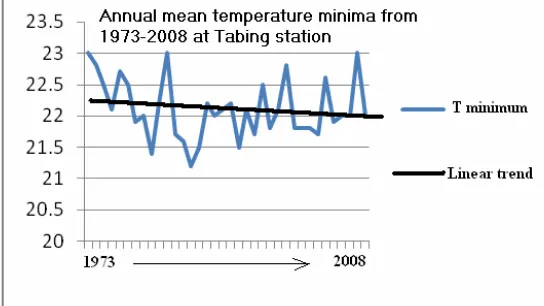
Figure 6. Annual mean temperature minima from 1973-2008 in Tabing Station
Indonesian Journal of Geography, Vol 43, No.1, June 2011 : 91 - 106
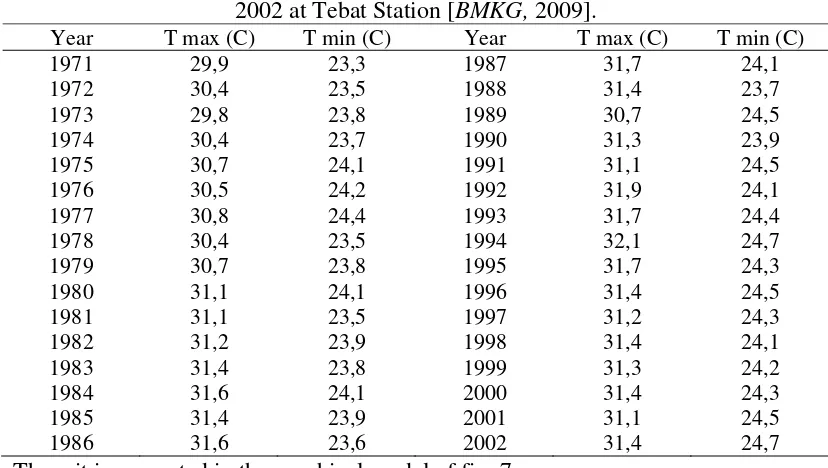
Table 2. Annual mean temperature maxima and temperature minima from 1971-2002 at Tebat Station [BMKG, 2009].
Then, it is presented in the graphical model of fig. 7.
Figure 7. Annual mean temperature maxima and minima from 1971- 2002 at Tebat Station
Graph illustrating upward trend of annual mean temperature maxima and minima in Table 2, as in Fig. 7 shows that Tmin – Tmax deviation in Tebat station of South Sumatra tends unchanged from 1973-2003. This is different from condition at Tabing station of West Sumatra.
Temperature min-max Deviation
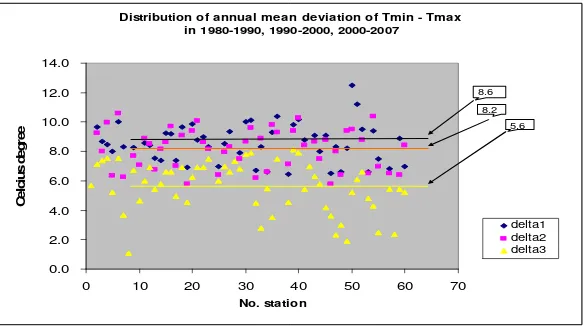
The distribution pattern of Tmin-max deviation in 3 (three) periods is presented in Fig. 8 that follows:
Figure 8. Distribution of mean deviation of Tmin-max at period I (1980-1990), Period II (1990-2000) and period III (2000-2007).
The distribution of T min-max deviation at the period I (blue) is shown in the upper part and then followed by respectively distribution of deviation at the period II (red) and period III (yellow) indicating downward deviation changes.
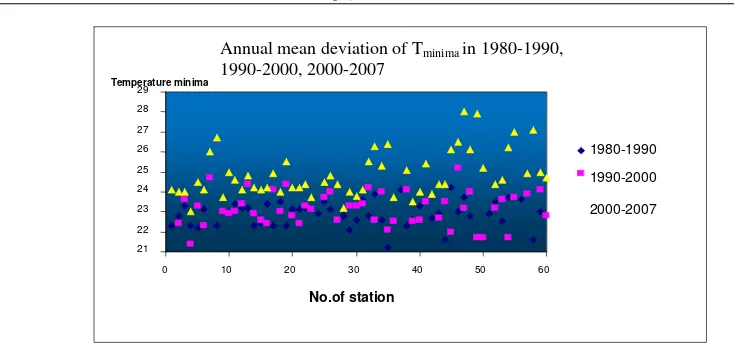
From the position of deviation distribution during the three periods as illus-trated in Fig. 8, it can be concluded that in general the deviation range of annual mean temperature maxima and minima in Indonesia tends to shorten. It implies that despite upward trends, the rise of minimum temperature is higher than that of maximum temperature increase. This is evident from the distribution patterns of annual mean deviation of temperature maxima and minima as depicted respectively in Fig. 9 and Fig.10 that follow.
Indonesian Journal of Geography, Vol 43, No.1, June 2011 : 91 - 106
Annual mean deviation of Tminima in 1980-1990,
1990-2000, 2000-2007
21 22 23 24 25 26 27 28 29
0 10 20 30 40 50 60
No.of station
Temperature minima
1980-1990
1990-2000
2000-2007
Figure 9. Distribution of annual mean deviation of temperature minima in period I, II, III.
Figure10. Distribution of annual mean deviation of temperature maxima in period I, II, III
Fig. 9 shows average maximum temperature deviation for period I distri-buting in the upper layer because of their larger values. Then, respectively followed by deviation values for period II and period III distributed in lower layers due to their smaller values. In contrast, average maximum temperature deviation is illustrated in Fig. 10.
Figure11. Graphical model of annual mean temperature minima-maxima from 1980-2007 in Indonesia
Graphically, Tmin and Tmax range and Tmin-max (D) difference is indicated in Fig. 11 with the value of D1>D2.
According to data analysis, it is obvious that to eastward the rise of average minimum temperature tends to be higher. Accordingly, the difference of Tmin-max deviation gets greater toward eastward (see fig.12).
Figure12. General pattern of the difference of T min-max deviation from the west to the eastern part.
From ecology wise, this changing temperature amplitude will affect the metabolism process of living organism due to the changing tolerable limits to external temperature change. The troubled metabolism process will generate effect to productivity.
Indonesian Journal of Geography, Vol 43, No.1, June 2011 : 91 - 106 CONCLUSION
The calculation produces increase of annual mean temperature in Indonesia is around 0.01 – 0.20C from 1980-2007. It is still at the lowest level since at global scale temperature is predicted to rise at 0.76 +/- 0.190C range after 1950.
Temperature amplitude range between T min and T max from 1980-2007 is diminishing because of minimum temperature change rate outpacing the rate of maximum temperature change. Owing to various climate control factors, this study fails to reveal what atmosphere dynamics causing the lowering of such amplitude range. This research fails to show what factors contributing to the changing temperature amplitude.
More in-depth research of these factors at ecological scale will be necessary as crucial part in determining adaptation programs to this on-going climate change phenomenon.
In light of foregoing, in-depth research on temperature change including comprehensive observation and data analysis should be carried out in more continual and accurate basis. It is therefore deemed necessary to add climate measuring tools in automatic systems (AWS) throughout Indonesia.
ACKNOWLEDGEMENT
The author would like to acknowledge to Prof. Kees Stigter, Ph.D.-<Professor in Agrometeorology, Wageningen University Netherland, TTMI/-African Network & Asian Picnic Model Project, Founding President INSAM and Visiting Professor in Asia and Africa – Agromet Vision > for his constructive reviews of this manuscript especially on information that’s this results is not differ with the same research results in China region.
REFERENCES
BMKG, (2004). Pemutahiran Daerah Prakiraan Musim di Indonesia. Badan Meteorologi dan Geofisika, Jakarta
Bary, R.G. and Chorley, R.G. (1998). Atmosphere, Weather & Climate. Tenth Edition Routledge, London.
Bruce. J.P & R.H.Clark, (1966). Introduction to Hydrometeorology. Pergamon Press. New York.
Camilleri, JA, Jim Falk, (2009). Worlds in Transition. Evolving Governance Across
Carlson. T.N. (1981). Tropical Meteorology. Pennsylvania State University, USA. Gunawan. B. Kenaikan Muka Air Laut Dan Adaptasi Masyarakat.
Prosiding Seminar Indonesia – Jepang tentang Dampak Pembangunan Kota dan Lingkungan Global.Bandung. 2001.
Hagget, P. (2001). Geography, A Global Synthesis. Prentice Hall, Pearson Education Limited, Edinburgh Gate, Harlow, Essex CM20 2JE England. Harmantyo, D. (2008). Skenario Alih Teknologi Dalam menghadapi Dampak
perubahan Iklim. Prosiding Seminar Nasional tentang Peranan Geografi
Dalam Menghadapi Dampak Perubahan Iklim. Padang Sumatra Barat.
Harmantyo, D. (2009). A Preliminary Investigation on Climate Change in
Indonesia. International Workshop on Vulnerabilty to Climate Change:
Adaptation, Conservation And Livelihoods in Indonesia. Conservation Internasional Indonesia–UI. Depok.
Harmantyo, D. (2009). Climate Role in Changing the Face of the Earths.
International Workshop on Climate Information Services in Supporting Mitigation and Adaptation to Climate Change. BMKG. Jakarta.
Harmantyo, D. (2009). Dinamika Iklim Indonesia. Buku Teks. Universitas Indonesia. Depok (unpublished).
Haryoko, U, dkk. (2008). Analisis Trend Suhu Udara dan Curah Hujan untuk
Deteksi Perubahan Iklim. Seminar Hari Meteorologi Dunia 2008. Jakarta
IPCC (Intergovenrmental Panel on Climate Change), Climate Change (2007). The
Physical Science Basis. Summary for Policy Makers, Contribution of Working
Group I to the Fourth Assessment Report of the Intergovenrmental Panel on Climate Change. Paris, February 2007. http://www.ipcc.ch/, 2007.
Houghton, J. T., Meira Filho, L. G., Cailander, B. A., Harris, N., Kattenberg, A. & Maskell, K. IPCC (Intergovernmental Panel on Climate Change), 1996. Climate Change (1995): The Science of Climate Change. Contribution of WGI to the Second Assessment Report of the Intergovernmental Panel on Climate Change. Cambridge University Press, Cambridge, U.K., 572 pp.
Linacre, E. and Bart Geerts. (1997). Climates & Weather Explained. Routledge. London.
Olmos. S. (2001). Vulnerability and Adaptation to Climate Change.Concepts,
Issues and Assessment Methods. www.cckn.net. 2001.
Radziejewski, M., Bardossy, A., Kundzewicz, Z. W., (2000). Phase randomization
for change detection in hydrological data. In: Detecting trend and other
Indonesian Journal of Geography, Vol 43, No.1, June 2011 : 91 - 106
Sandy, I.M. (1987). Iklim Regional Indonesia. Jurusan Geografi. FMIPA, Universitas Indonesia. Jakarta.
Sandy. I.M. (1996). Geografi Regional Republik Indonesia. Jurusan Geografi. FMIPA, Universitas Indonesia. Jakarta.
Southwick. C.H. (1976). Ecology and the Quality of our Environment.. D.Van Nostrand Co. London.
Strahler, A. (2003). Physical Geography. John Wiley & Son. NY.
Susandi, A. (2004). The impact of international greenhouse gas emissions reduction
on Indonesia. Report on Earth System Science, Max Planck Institute for
Meteorology, Jerman.
Trewartha. Glenn. T. (1954). An Introduction to Climate. McGraw Hill Book Co. Inc. NY.
WMO, (1988). Analyzing long time series of hydrological data with respect to
climate variability. Project description, WCAP-3, WMOTFD-No. 224,
![Figure 2. Annual mean temperature from 1680-1970 in central regions of London [Haggett, 2001]](https://thumb-ap.123doks.com/thumbv2/123dok/853778.815456/5.612.173.447.112.215/figure-annual-mean-temperature-central-regions-london-haggett.webp)