Gadjah Mada International Journal of Business Vol. 17, No. 2 (May-August 2015): 125-137
The Javanese Lunar Calendar’s Effect
on Indonesian Stock Returns
Robiyanto
*and
Siti Puryandani
Faculty of Economics, Universitas Diponegoro, Indonesia
Abstract: It is very possible for an investor to take a decision based on superstitions and common beliefs. Actually, Indonesia has a specific calendar system called the Javanese lunar calendar. The Javanese calendar contains several special days because of their sacred characteristics such as “Kamis Wage” (Thursday Wage) and “Jum’at Kliwon” (Friday Kliwon). The day of Friday Kliwon is often considered to be the most frighten-ing which is similar to Friday the Thirteenth in Western culture. This study tried to scrutinize the impact of those sacred days on Indonesian stock returns. By applying GARCH-M, the finding shows that the Javanese lunar calendar does not have any impact on the Indonesian stock returns, but does affect the investors’ risk aversion level. This study has proven that, in terms of risk aversion, investors’ behavior in Indonesia is influenced by superstition.
Abstrak: Dalam pengambilan keputusan, seorang investor sangat mungkin berdasarkan takhayul dan keyakinan umum. Sebenarnya, Indonesia memiliki sistem kalender khusus yang disebut kalender lunar Jawa. Kalender Jawa berisi beberapa hari khusus karena kesakralannya seperti “Kamis Wage” dan “Jum’at
Kliwon”. Jumat Kliwon sering dianggap sebagai yang paling seram, sama dengan dengan Friday the 13th yang ada dalam budaya Barat. Penelitian ini berupaya mengkaji dampak dari hari-hari yang sacral tersebut terhadap return saham. Dengan menerapkan GARCH-M, temuan menunjukkan bahwa kalender lunar Jawa tidak memiliki dampak pada return saham Indonesia, tetapi berpengaruh pada tingkat penghindaran risiko investor. Penelitian ini telah membuktikan bahwa, dalam hal penghindaran risiko, perilaku investor di Indonesia dipengaruhi oleh takhayul.
Keywords:calendar anomaly; capital market efficiency; GARCH-M; Javanese lunar
calendar; seasonality
Introduction
A seasonal pattern (seasonality) is a type of calendar anomaly in financial markets which has attracted the attention of many researchers. Various studies have been con-ducted to explain this phenomenon and they include include research conducted by Lean and Tan (2010); Hmaied et al. (2006); Brockman and Chung (1999); Brockman and Michayluk (1998); Brooks (1997); Sias and Starks (1995); Dickinson and Peterson (1995); Lakonishok and Maberly (1990). They dealt with the Day of Week Effect and its impact on many capital markets in the world.
Related to this type of calendar anomaly, some researchers have tried to study the effect of investors’ beliefs and supersti-tions on their behavior in financial markets. Kolb and Rodriguez (1987) found that the returns for Friday the Thirteenth were signifi-cantly lower that the returns for all the other Fridays over a long period in the NYSE. This evidence was the first documentation of the Friday the Thirteenth Effect. Chamberlain, Cheung, and Kwan (1991) supported the ex-istence of the Friday the Thirteenth Effect by studying the return of S&P 500 compos-ite index. Many researches have also at-tempted to prove that the Friday the Thir-teenth Effect still exists in the financial mar-kets. Lucey (2000) obtained different results from his study in FTSE when he found that returns on Friday the Thirteenth was much higher than the other Fridays in FTSE. In his later study, Lucey (2001) also found the same results in eleven different financial markets.
Still related to calendar anomalies, some researchers have documented higher stock returns from November through April than from the rest of the year. According to Hag-gard and Witte (2010), this anomaly is known
as the “Halloween effect”. Lean (2011) found that the “Halloween effect” existed in some Asian stock markets. Non-secular calendar anomalies were also documented by Al-Ississ (2010) who found that the Muslim holy days of Ramadhan and Asyura tended to yield positive returns in seventeen different Mus-lim financial markets. Meanwhile, Frieder and Subrahmanyam (2004) found that the Jewish High Holy Days of Rosh Hashanah and St. Patrick’s Day had a positive impact on stock returns, however, Jewish High Holy Days of Yom Kippur contributed negatively to stock returns in the United States.
These various pieces of empirical evi-dence indicate that the capital markets are not efficient in weak form. Those findings also indicate the urgency of theoretical ap-proaches in addition to the assumption of efficient capital markets and investor ratio-nality. In reality, many investors tend to use approaches or ways that can generate profits for them, regardless of whether they are ra-tional or irrara-tional. In fact, it is very possible for an investor to perform an action based on superstition and common beliefs. This has also been proposed by Liu (2010) who stated that cultural considerations and superstition could affect the process of behavior forma-tion in financial markets as an expression of social psychology.
decisions. Liu (2010) concluded that the Chi-nese farmer calendar had an important role in predicting stock returns.
Actually, there are indigenous cultures in Indonesia which are similar to Oriental cultures. The Javanese lunar calendar system has close similarities to the Chinese farmer calendar with its lunar system. For instance, the Javanese community considers “Kamis Wage” (Thursday Wage) and “Jum’at Kliwon” (Friday Kliwon) to be very special days com-pared to the others based on their sacred char-acteristics. In addition, particularly for the Javanese community but also acknowledged by Indonesian people in general, Friday Kliwon
is often considered as the most frightening day in a similar way to how Friday the Thir-teenth is seen in Western culture. It is said that on Friday Kliwon night, ghosts and evil spirits gain their optimum power to kill hu-mans. In fact, they believe that the ghosts will kill as many people as possible before the dawn comes. When the dawn comes, it is the time for God to punish them all and send them back to hell. This story is closely re-lated to the tradition of Muslim people who worship on Fridays (called Good Friday), and it also evolved from local myth. Hence, Fri-day Kliwon is considered to be a dangerous day. Besides that day, Thursday Wage is also considered to be a dangerous day which may bring bad luck. Instead of being influenced by the myth, Muhaimin (1995) argued that the importance of Friday Kliwon for the Javanese community is mostly influenced by both Islamic tradition and Javanese tradition. Unfortunately, research on the influence of the Javanese calendar on stock returns in Indonesia has not been conducted widely. According to the 2010 National Census car-ried out by Statistics Indonesia, there were 1,340 ethnic groups in this country and the Javanese were the largest one. They numbered
just over 95,000,000 people or around 40 percent of the Indonesian population, i.e. al-most 237,000,000 people. This indicates that research into finance affected by seasonality through the Javanese lunar calendar urgently needs to be conducted. Therefore, this study has tried to examine the influence of the days in the Javanese lunar calendar which were considered to be sacred on stock market re-turns at the Indonesia Stock Exchange.
Behavioral Finance and
Superstitions
lucky number because the pronunciation in-dicates the meaning of “luck” (Brown and Mitchell 2004).
Kolb and Rodriguez (1987) are pioneers in superstition-related anomalies as they raised the issue of whether Friday the Thir-teenth effect existed in capital markets. This study then motivated Chamberlain et al. (1991); Lucey (2000, 2001) to do the same research in different settings. However, those studies are barely suitable for generalizing to different countries with different cultures which have their own beliefs and do not adopt the Judeo-Christian beliefs. The same condi-tion is also relevant to the study of the Chi-nese Lunar Calendar Effect. It is more ap-propriate for this effect to be observed in countries which are dominated by Chinese culture. Hence, superstition-related season-alities must be scrutinized carefully with cul-tural background as a consideration.
The Javanese Lunar Calendar
System
There are two categories of calendar system, namely theological calendar systems (e.g. Gregorian calendar system, Hijriah
/Is-lamic calendar system, and Caka/Hindhu calendar system), and cultural calendar sys-tems (e.g. Chinese lunar calendar system and Javanese lunar calendar system). The Javanese lunar calendar system is unique since it com-bines the Islamic, the Javanese Hindu-Bud-dha and a little mixture of Western cultural elements. There are some separate measure-ments of times in the Javanese Lunar Calen-dar. They are: a weekly cycle (consisting of seven days as found on the Gregorian calen-dar system such as Sunday, Monday Tuesday, Wednesday, Thursday, Friday and Saturday); the Pancawara cycle or Pasaran, which liter-ally means market place (consisting of five days such as Legi (sweet), Pahing (bitter), Pon
(partition), Wage (ugly or dirty) and Kliwon
(love); the monthly cycle of Mangsa and
Wulan; the yearly cycle called Tahun; and the eight year cycle called Windu. An academic study which accurately described the Javanese lunar calendar system was done by Damais (1955) who provided the calculation of those cycles. The simplest way to explain the combination of the weekly cycle and the
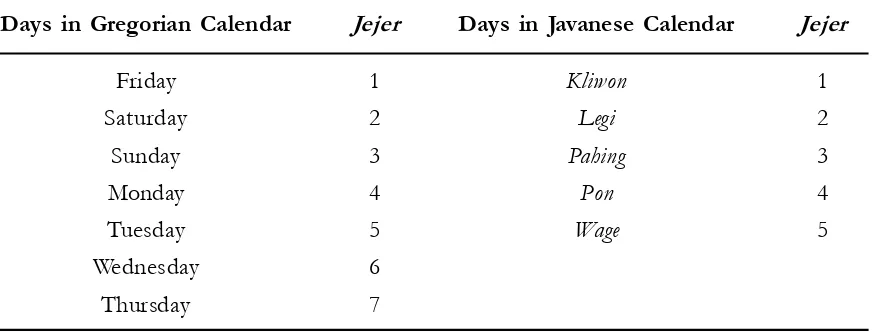
Pancawara cycle, and also its jejer, is illustrated in Table 1. There are 35 days based on the weekly cycle and Pancawara cycle combina-tion.
Table 1. The Jejer of Weekly Cycle (Gregorian Calendar) and Pancawara Cycle Days in Gregorian Calendar Jejer Days in Javanese Calendar Jejer
Friday 1 Kliwon 1
Saturday 2 Legi 2
Sunday 3 Pahing 3
Monday 4 Pon 4
Tuesday 5 Wage 5
Wednesday 6
The term Pasaran is generated from the regular time for villagers to gather in the lo-cal market to meet socially and to buy and sell wares, products, foods, etc. Muhaimin (1995) has elaborated that Friday is the most important day of the week since it is put at the first ordinal standing (jejer). Meanwhile,
Kliwon is considered also to be the most im-portant day and is put at the first jejer. Friday
Kliwon occurs only once in the thirty-five days and is considered to be the most significant moment for the first jejer of the seven-day week (Friday) and meets the first jejer of the five-day Pasaran week (Kliwon). The impor-tance of Friday seems to be generated from the Islamic tradition that regards Friday as the master of the all days (Sayidul Ayyam) for conducting religious services. It remains un-clear why Kliwon is considered to be signifi-cant though it must be due to the Javanese tradition and the evolvement of a local myth about Friday Kliwon. Similarly, Thursday Wage
is also considered to be a sacred day since Thursday and Wage belong to the last jejer of both the seven-day week and the five-day
Pasaran week respectively.
Through time, what was considered as myth in the past turned out into beliefs. People believe that ghosts and evil spirits re-ally appear at those times. To make the leg-end even more terrifying, some people with strong beliefs in supernatural power will usu-ally select those sacred days to practice their rituals. Many spiritual ceremonies are mostly held in Friday Kliwon (Muhaimin 1995; Damais 1955). Even some fanatical believ-ers choose not to do anything within those days and prefer to postpone or cancel almost all the activities.
Data
The data which were analyzed in this study were the daily closing Jakarta Compos-ite Index (JCI) in Indonesia Stock Exchange from July 1, 1997 to June 3, 2014 retrieved from Yahoo Finance. There were 4,107 trad-ing days durtrad-ing that period which consisted of 162 days of Friday Kliwon, 641 days of non-Friday Kliwon, 163 days of Thursday
Wage, and 648 days of non-Thursday Wage. The Wednesday Pon was also analysed because that day was the last day before those sacred days. During the research period there were 169 days of Wednesday Pon and 678 days of non-Wednesday Pon.
Stock market returns were calculated through the formula of:
Return JCIt=(JCIt - JCIt-1) / JCIt-1 JCIt= daily closing JCI on day t
JCIt-1=daily closing JCI on day t-1
Methods
Engle et al. (1987) with final preferred model estimated parameterized the conditional mean as a function of log(2
t). Nyberg (2010)
stated that the general idea of the GARCH-M model is that the conditional variance’s coefficient in the conditional mean equation is interpreted as to measure the strength of risk aversion.
Thus, to test the influence of Thursday
Wage, Friday Kliwon and Wednesday Pon on stock market returns, the models applied were:
Return JCIt = Trading Day + 2 t + t
with
t = tt-1 + ... + t t-p + t t = tt
2
t =2t-1 + ... + 2t-p + 12t-1 + ... + ... q2t-q
and t were independent and identical dis-tributed N (0,1) and did not depend on the past condition of t-p.
Return JCIt = Return daily JCI on Thursday or Friday or all trading day Trading Day = Dummy variable, 1 if it was
Thursday Wage and 0 if not,
or 1 if it was a Friday Kliwon
0 if not, or 1 if it was Wednesday Pon and 0 if not. Prior to the analysis of GARCH-M data stationarity test with the Augmented Dickey-Fuller Test and heteroscedasticity test, the ARCH-LM test were performed first.
Results
Descriptive Statistics
Descriptive statistics are presented in Table 2 and Table 3. The daily average re-turn of the stock market on non-Thursday
Wage was 0.060 percent. It was less than the daily average return of the stock market on Thursday Wage at 0.229 percent. The daily average return of the stock market on Thurs-day Wage was the highest when compared to the daily average return of the stock market on the other trading days and the other spe-cific trading days studied. The risk of the stock market on Thursday Wage that was re-flected in 1.581 percent standard deviation is the lowest when compared to standard de-viation of non-Thursday Wage and the other trading days except other than non-Friday
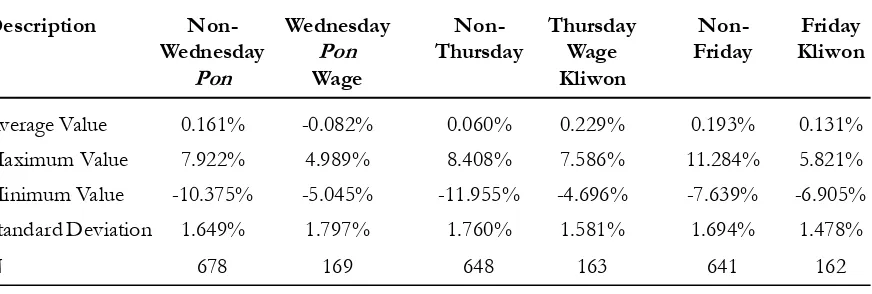
Table 2.The JCIReturn’s DescriptiveStatistics Based on Non-Wednesday Pon, Wednes-day Pon, Non-Thursday Wage, Thursday Wage, Non-Friday Kliwon and Friday
Kliwon
Description Non- Wednesday Non- Thursday Non- Friday
Wednesday Pon Thursday Wage Friday Kliwon
Pon Wage Kliwon
Average Value 0.161% -0.082% 0.060% 0.229% 0.193% 0.131% Maximum Value 7.922% 4.989% 8.408% 7.586% 11.284% 5.821% Minimum Value -10.375% -5.045% -11.955% -4.696% -7.639% -6.905% Standard Deviation 1.649% 1.797% 1.760% 1.581% 1.694% 1.478%
Kliwon. Since these findings show that Thurs-day Wage have a higher average daily return with lower standard deviation compared to that of non-Thursday Wage, so it seems that Thursday Wage which is considered as a sa-cred day since Thurday and Wage belong to the last jejer of both the seven-day week and the five-day Pasar week, and do not have any negative impact on return.
The daily average return of the stock market on non-Friday Kliwon was 0.193 per-cent and it was bigger than the daily average return of the stock market on Friday Kliwon
at 0.131 percent. This study also found that the daily average return of the stock market on non-Friday Kliwon was the second highest when compared to daily average return on the other trading days and the other specific days studied. Meanwhile, the risk of the stock market on non-Friday Kliwon was reflected by the standard deviation of 1.694 percent. It was greater than the risk of the stock mar-ket on Friday Kliwon that was reflected by the standard deviation of 1.478 percent. The risk of the stock market on Friday Kliwon was the lowest when compared to daily average re-turn on the other trading days and the other specific trading days studied. These findings are relatively similar to those for Thursday
Wage. Friday and Kliwon belong to the first
jejer of both the seven-day week and the
five-day Pasar week, and do not have any nega-tive impact on return.
In order to explore an additional expla-nation, this study add more day to be scrunitized, which is Rabu Pon (Wednesday
Pon). This specific day need to be explored since the term of frightening (scary) for In-donesian people also was occured for a day/ night before sacred days (a day/night before Thurday Wage which is Wednesday pon and a day/night before Friday Kliwon which is Thursday Wage). They tend to takes a pre-cautionary actions on a day before those sa-cred days occured consecutively.
The Wednesday Pon’s daily average re-turn was -0.082 percent, in contrast to the non-Wednesday Pon’s daily average return was 0.161 percent which is higher. Surprisingly, the risk of stock market on Wednesday Pon
that was reflected in 1.797 percent standard deviation is the highest when compared to standard deviation of Thursday Wage, Friday
Kliwon and other trading days which were scrunitized specifically. These findings show that Wednesday Pon is the riskiest and inves-tors tend to avoid it. This phenomenon is similar to the so called Monday Effect which tends to produce a negative daily average re-turn with high risk, which was also found in this study.
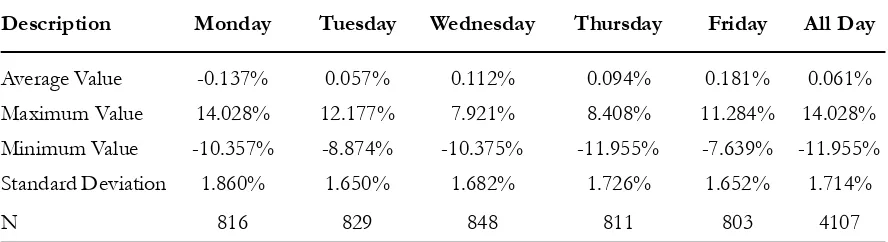
Table 3. The JCI Return’s Descriptive Statistics Based on Trading Days
Description Monday Tuesday Wednesday Thursday Friday All Day
Average Value -0.137% 0.057% 0.112% 0.094% 0.181% 0.061% Maximum Value 14.028% 12.177% 7.921% 8.408% 11.284% 14.028% Minimum Value -10.357% -8.874% -10.375% -11.955% -7.639% -11.955% Standard Deviation 1.860% 1.650% 1.682% 1.726% 1.652% 1.714%
These descriptive statistics also lead to the conclusion that investors take precaution-ary actions by selling their stocks on Wednes-day Pon in order to secure their portfolio since they are risk averse. Then they could take a buy position on the days after Wednesday Pon
if there was no bad things that happened which affected the buy momentum. That is the possible reason why Thurday Wage’s av-erage daily returns and Friday Kliwon’s aver-age daily returns were positive and have lower standard deviation as risk measurement.
Based on the average value of week-days’ stocks market returns, it seems that the Day of the Week Effect, especially the Mon-day Effect and FriMon-day Effect, still exists in Indonesia Stock Exchange since Monday’s average stock market return was the lowest and Friday’s average stock market return was the highest. So, it is not surprising that both Friday Kliwon and non-Friday Kliwon still pro-duce positive stock market returns. Similarly, this also happened with Thursday though the stock market returns on this day were not the highest but when Thursday was divided into Thursday Wage and non-Thursday Wage, this study found that Thursday Wage produced the highest stock market returns.
In summary, the descriptive statistics show that Thursday Wage and Friday Kliwon, as sacred days, do not have a negative effect on average daily returns, but Wednesday Pon
as a day before those sacred days, tend to produce negative daily average returns as a result of investors’ precautionary actions.
Data Stationarity Test Results
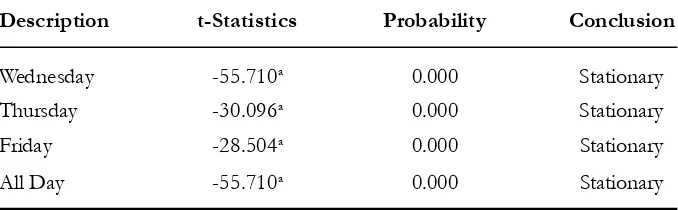
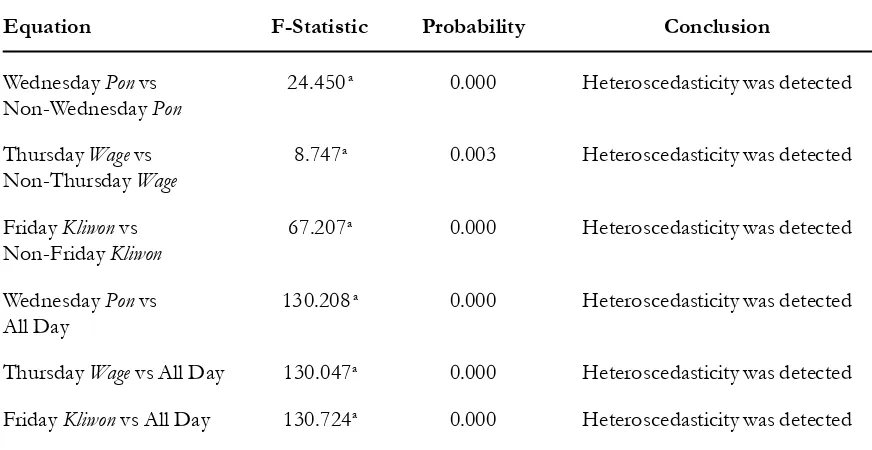
Data stationarity test results through Augmented Dickey-Fuller are displayed in Table 4. Based on the table, it can be con-cluded that heteroscedasticity is detected. The GARCH model can be applied by accommo-dating the heteroscedasticity effect. These results also indicate that the previous day’s (t-1) volatility has an impact on the returns in day t. So it is indispensable to include the variance equation on the model. In such in-stances, it needs to specify a ARCH- or GARCH-in-mean model and consider inter-actions of this sort in the conditional mean (level) equation. According to Bollerslev, Engle, and Nelson (1994), the ARCH-in-mean (ARCH-M)/GARCH-M model adds a heteroscedasticity term to the mean equation. In brief, it is concluded that the LM diagnos-tic tests have revealed the robustness of GARCH-M model.Table 4. Data Stationarity Test Results
Description t-Statistics Probability Conclusion
Wednesday -55.710a 0.000 Stationary
Thursday -30.096a 0.000 Stationary
Friday -28.504a 0.000 Stationary
All Day -55.710a 0.000 Stationary
GARCH-M Analysis Results
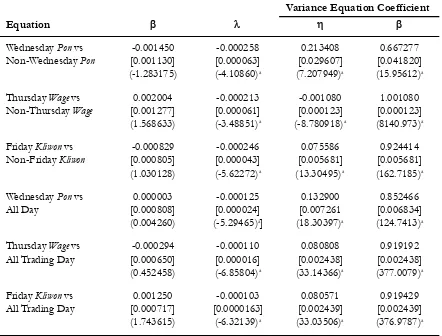
Based on the GARCH-M analysis re-sults presented in Table 6, it can be concluded that Thursday Wage did not have any influ-ence on the daily returns the Indonesia Stock Exchange. The sign of regression coefficient showed that Thursday Wage tended to have positive impact on daily stock market returns in the Thursday Wage vs non-Thursday Wage
equation. These findings were supported by evidence found in descriptive statistics which are shown in Table 2 and Table 3. Meanwhile, daily stock market returns on Thursday Wage
were higher than non-Thursday Wage. The volatility depicted in the Thursday Wage vs non-Thursday Wage equation had a negative impact on stock returns on Thursday at 1 percent level of significance which means the higher volatility on Thursday leads to the lower returns. A different result was found for the Thursday Wage vs all trading days equation whereas the regression coefficient’s
sign was negative but it does not have a sig-nificant impact on stock returns. Meanwhile, the volatility coefficient had a negative im-pact on stock returns and significant at 1 per-cent significance level. It means that the higher the volatility, the lower the stock re-turns.
The regression coefficient’s sign of dummy variables representing Friday Kliwon
in the Friday Kliwon vs non-Friday Kliwon
equation was negative yet did not have any significant impact on stock returns. This sign was supported by descriptive statistics as shown in Table 2, where the Friday Kliwon’s average returns were lower than non-Friday
Kliwon’s average returns. Friday Kliwon also did not have any positive impact on daily stock market returns in Friday Kliwon vs all trading day. This finding was also supported by the evidence revealed in descriptive sta-tistics. Volatility’s regression coefficients in both equations contributed negative and sig-Table 5. ARCH-LM Test Results
Equation F-Statistic Probability Conclusion
Wednesday Pon vs 24.450 a 0.000 Heteroscedasticity was detected
Non-Wednesday Pon
Thursday Wage vs 8.747a 0.003 Heteroscedasticity was detected
Non-Thursday Wage
Friday Kliwon vs 67.207a 0.000 Heteroscedasticity was detected
Non-Friday Kliwon
Wednesday Pon vs 130.208 a 0.000 Heteroscedasticity was detected
All Day
Thursday Wage vs All Day 130.047a 0.000 Heteroscedasticity was detected
Friday Kliwon vs All Day 130.724a 0.000 Heteroscedasticity was detected
nificant impacts on stock returns at 1 per-cent level of significance, which means the higher volatility leads to the lower stock re-turns.
Meanwhile by elaborating the condi-tional variance included in the condicondi-tional mean equation, this study found that there is higher and significant risk aversion on the sacred days studied at 1 percent significance level. The strength of risk aversion on Fri-day Kliwon is higher than non-Friday Kliwon, and this condition also applied to Thursday
Wage and even to Wednesday Pon as the day before those sacred days.
The strength of risk aversion on Wednesday Pon is the highest (-0.000258), since investors tend to take precautionary actions before those sacred days, followed by the strength of risk version on Friday Kliwon
(-0.000246) and Thurday Wage (-0.000213).
Conclusions and
Recommendations
Based on descriptive statistics, this study found a phenomenon which is similar to the Monday Effect on “Wednesday Pon” as the day before the sacred day being stud-Table 6. GARCH-M Analysis Results
Variance Equation Coefficient
Equation
Wednesday Pon vs -0.001450 -0.000258 0.213408 0.667277 Non-Wednesday Pon [0.001130] [0.000063] [0.029607] [0.041820]
(-1.283175) (-4.10860)a (7.207949)a (15.95612)a
Thursday Wage vs 0.002004 -0.000213 -0.001080 1.001080 Non-Thursday Wage [0.001277] [0.000061] [0.000123] [0.000123]
(1.568633) (-3.48851)a (-8.780918)a (8140.973)a
Friday Kliwon vs -0.000829 -0.000246 0.075586 0.924414 Non-Friday Kliwon [0.000805] [0.000043] [0.005681] [0.005681]
(1.030128) (-5.62272)a (13.30495) a (162.7185)a
Wednesday Pon vs 0.000003 -0.000125 0.132900 0.852466
All Day [0.000808] [0.000024] [0.007261 [0.006834]
(0.004260) (-5.29465)a] (18.30397)a (124.7413)a
Thursday Wage vs -0.000294 -0.000110 0.080808 0.919192 All Trading Day [0.000650] [0.000016] [0.002438] [0.002438]
(0.452458) (-6.85804)a (33.14366)a (377.0079)a
Friday Kliwon vs 0.001250 -0.000103 0.080571 0.919429 All Trading Day [0.000717] [0.0000163] [0.002439] [0.002439]
(1.743615) (-6.32139)a (33.03506)a (376.9787)a
Numbers in the brackets are standard errors Numbers in the parentheses are z-Statistics
ied with higher negative return and higher risk. This study concludes that “Thursday Wage” and “Friday Kliwon” do not have any signifi-cant impact on daily stock market returns. The same finding also applies to “Wednes-day Pon” as the day before those sacred days. Interestingly, this study found significant risk aversion strength on those days and the strength of risk aversion on “Wednesday Pon” as the last day to take precautionary actions is at its highest, followed by “Friday Kliwon” and “Thurday Kliwon”.
These findings show us that the Javanese lunar calendar effect doesn’t exist in the Indonesia Stock Exchange but the in-vestors’ level of risk aversion is affected by it. Hence, in terms of risk aversion, the be-havior of many investors is also influenced by superstition based on local culture.
Limitations and Future
Research Agenda
This study focused only on Thursday
Wage and Friday Kliwon as being the most
sa-cred in Javanese culture, and Wednesday Pon
as the day before those days; meanwhile there are the other remaining twenty two trading days according to the Lunar Javanese Calen-dar, therefore, it is recommended future that research investigates the influence of the Javanese calendar system on those remain-ing tradremain-ing days. The application of a sophis-ticated approach is also welcome since this study was pioneering in this subject. It is also recommended that future research studies the month based on Javanese calendar system due to the existence of local beliefs and wisdom, such as the Month of Muharram which is con-sidered more sacred than other months.
Finally, since different cultures tend to have different superstitions and beliefs, the future research should explore whether other dominant, country-specific differences in su-perstitions and beliefs found in other parts of the world may affect investor’s behavior in financial markets.
References
Al-Ississ, M. 2010. The impact of religious experience on financial markets. Working Paper.
Albaity, M., and R. Mahfuz. 2012. Behavioural finance and Malaysian culture. International Business Research
5 (11): 65-76.
Beckmann, D., L. Menkhoff, and M. Suto. 2007. “Does Culture Influence Assets Managers’ Views and Behavior.” Journal of Economic Behavior & Organization 67 (3-4):624–643.
Bollerslev, T. 1986. Generalized autoregressive conditional heteroscedasticity. Journal of Econometrics 31: 307-327.
Bollerslev, T., R. F. Engle, and D. B. Nelson. 1994. ARCH models. In R. F. Engle and D. L. McFaedden (edt.), Handbook of Econometrics. Elsevier Science B.V.
Brockman, P., and D. Y. Chung. 1999. Cross-listing and firm liquidity on the stock exchange of Hongkong.
Managerial Finance 25 (1): 64-88.
Brockman, P., and D. Michayluk. 1998. Individual versus institutional investors and the weekend effect.
Brooks, R. M. 1997. The individual investor and the weekend effect: A reexamination with intraday data.
Quarterly Review of Economics and Finance 37 (7): 725-737.
Brown, P., and J. Mitchell. 2004. Culture and stock price clustering: Evidence from the Peoples’ Republic of China. Working Paper.
Chamberlain, T. W., C. S. Cheung, and C. C. Y. Kwan. 1991. The Friday the Thirteenth effect: Myth or reality? Quarterly Journal of Business and Economics 30 (2): 111-117.
Chion, S. J., C. Veliz, and N. Carlos. 2008. On the normality of stock return distributions: Latin American markets 2000-2007. Journal of CENTRUM Cathedra 1 (2): 90-108.
Corhay, A., and A. T. Rad. 1994. Statistical properties of daily stock returns: Evidence from European Stock Markets. Journal of Business Finance and Accounting 21 (2): 271–282.
Damais, L-C. 1955. Études d’epigraphie Indonésienne IV. Bulletin de l’Ecole Française d’Extrême-Orient 47 (1): 7-190.
Dickinson, A., and D. R. Peterson. 1995. Expectations of weekend and turn-of-the-month mean return shifts implicit in index call option prices. Journal Of Financial and Strategic Decisions 8 (3): 69-76. Engle, R. F., D. M. Lilien, and R. P. Robins. 1987. Estimating time varying risk premia in the term structure:
The Arch-M model. Econometrica 55 (2): 391-407.
Frieder, L., and A. Subrahmanyam. 2004. Nonsecular regularities in returns and volume. Financial Analysts Journal 60 (4): 29-34.
Haggard, K. S., and H. D. Witte. 2010. The halloween effect: Trick or treat? International Review of Financial Analysis 19 (5): 379-387.
Hmaied, D. M., O. B. Sioud, and A. Grar. 2006. Intradaily and weekly patterns of bid-ask spreads, trading volume and volatility on the Tunisian Stock Exchange. Banque and Marchés 84 (September-October): 35-44.
Kamath, R. R., R. Chakornpipat, and A. Chatrath. 1998. Return distributions and the day-of-the-week effects in the Stock Exchange of Thailand. Journal of Economics and Finance 22 (2-3): 97-106. Kolb, R. W., and R. J. Rodriguez. 1987. Friday the thirteenth: ‘Part VII’—a note. Journal of Finance 42 (5):
1385-1387.
Lakonishok, J., and E. Maberly. 1990. The weekend effect: Trading pattern of individual and institutional investors. Journal of Finance 45 (1): 231-224.
Lean, H. H. 2011. The halloween puzzle in selected Asian Stock Markets. International Journal of Economics and Management 5 (1): 216-225.
Lean, H. H., and V. K. Min Tan. 2010. Existence of the day of the week effect in FTSE Bursa Malaysia.
Jurnal Pengurusan 31: 3-11.
Liu, W. 2010. Lunar calendar effect: Evidence of the chinese farmer’s calendar on the equity markets in East Asia. Working Paper.
Lucey, B. M. 2000. Friday the 13th and the philosophical basis of financial economics. Journal of Economics and Finance 24 (3): 294-301.
Lucey, B. M. 2001. Friday the 13th: International evidence. Applied Economics Letters 8 (9): 577-579. Muhaimin, Abd. G. 1995. The Islamic Traditions of Cirebon: Ibadat and Adat Among Javanese Muslims. Canberra:
Nyberg, H. 2010. “QR-GARCH-M model for risk-return tradeoff in U.S. stock returns and business cycles. Discussion Papers (294). Helsinki Center of Economic Research.
Richardson, M., and T. Smith. 1993. A test for multivariate normality in stock returns. Journal of Business 66 (2): 295-321.
Sias, R. W., and L. T. Starks. 1995. The day-of-the-week anomaly: The role of institutional investors.
Financial Analysts Journal (May/June): 58-67.
Sowinski, M., O. Schnusenberg, and S. Materne. 2011. Sprechen sie bias? An investigation of cultural differences in behavioral finance biases between germany and the United States. Journal of Behavioral Studies in Business 3 (4): 53-76.
Statman, M. 2008. Countries and culture in behavioral finance. CFA Institute Conference Proceedings Quarterly