Identification of Risk Factors for Osteoporotic Fracture Using Fracture
Risk Assessment Tool in Dr. Hasan Sadikin General Hospital, Bandung,
Indonesia from June to December 2013
Nik Fatin Farhana Binti Mohd Rahhim,1 Bambang Tiksnadi,2 Eppy Buchori3
1Faculty of Medicine, Universitas Padjadjaran, 2Department of Orthopaedic & Traumatology,
Faculty of Medicine Universitas Padjadjaran/Dr. Hasan Sadikin General Hospital Bandung,
3Department of Radiology Faculty of Medicine Universitas Padjadjaran/Dr. Hasan Sadikin
General Hospital Bandung
Abstract
Background: Osteoporosis has become a growing public health problem in Indonesia. A definite estimation
of osteoporosis prevalence in Indonesia is not available due to the limited access of dual energy X ray absorptiometry (DXA) facilities. In 2008, the World Health Organization has developed a tool called Fracture Risk Assessment Tool to identify fracture risk based on the clinical risk factors. The study aimed to identify the risk factors of osteoporotic fracture using Fracture Risk Assessment Tool in Dr. Hasan Sadikin General Hospital, Bandung, Indonesia.
Methods: This descriptive study was conducted from June–December 2013 in Orthopedic & Traumatology, Internal Medicine, Geriatric and Surgery polyclinics Dr. Hasan Sadikin General Hospital, Bandung to 77 respondents, aged 40–90 years, using the random sampling method. Fracture risks were calculated online, and the data obtained were analyzed and presented using frequency distribution in tables.
Results: Most of the respondents had low risk for osteoporotic fracture, and only 5.19% of them had moderate risk. The main risk factors were rheumatoid arthritis (57.14%), followed by current smoking (27.27%) and prolonged glucocorticoids consumption (25.98%). The moderate risk group was females, above 60 years old and with normal BMI or underweight with risks of previous fracture, parent’s previous hip fracture, rheumatoid arthritis and prolonged glucocorticoids exposure.
Conclusions: Majority of the respondents have low risk for osteoporotic fracture. It must be taken into consideration that increasing age, rheumatoid arthritis, current smoking, prolonged glucocorticoids consumption, previous fracture and parent’s previous hip fracture can cause increased risk.
[AMJ.2015;2(3):423–28]
Keywords: Fracture, fracture probability, fracture risk assessment, osteoporosis
Correspondence: Nik Fatin Farhana Binti Mohd Rahhim, Faculty of Medicine, Universitas Padjadjaran, Jalan Raya Bandung-Sumedang Km.21, Jatinangor, Sumedang, Indonesia, Phone: +62 85624820691 Email: kin_frhan@yahoo.com
Introduction
Osteoporosis is a systemic skeletal disease characterized by low bone density and micro architectural deterioration of bone tissue with a consequent increase in bone fragility.1
Osteoporosis has become a growing public health concern in Asia. More than 50% of all osteoporosis-related fractures are estimated to occur in Asia by 2050.2 In 2005, 2 out of
5 Indonesians were reported to be at risk of
osteoporosis. However, a definite estimation
of osteoporosis prevalence in Indonesia is not available due to the limited access of dual
energy X ray absorptiometry (DXA) facilities; it makes this disease be considered as an under diagnosed disease.2
Measurement of bone mineral density (BMD) using the DXA technology can identify individuals with low bone mass, which is a major characteristic of osteoporosis, yet, this technology is relatively expensive and widely unavailable in most developing Asian countries. 2,3
Osteoporosis is a silent disease. The occurrence of low trauma or fragility fracture
has been identified as the outcome of
osteoporosis based on BMD. This indicates
that the identification of other risk factors is
required in order to identify individuals that are at highest risk for fracture.4 The WHO5
has developed a computer-based algorithm program called the Fracture Risk Assessment (FRAX) tool which integrates the weight of clinical risk factors with or without the BMD results to predict the absolute percentage of risk for major osteoporotic fracture and hip fracture over the next 10 years.6-8
Major osteoporotic fracture is defined as
any osteoporosis related fractures such as clinical spine, wrist, proximal humerus and hip fracture.9 The FRAX tool is validated globally,
applicable to both men and women from 40 to 90 years of age, cost-effective and
country-specific.3
This study was conducted to identify the distribution of risks for major osteoporotic fracture using FRAX tool among patients from 40 to 90 years of age in the polyclinics of Dr. Hasan Sadikin General Hospital, and could provide an overview of a rough estimation of the risk for osteoporotic fracture in Bandung.
Methods
A descriptive study was conducted from June–December 2013 in several polyclinics of Dr. Hasan Sadikin General Hospital. Among selected polyclinics were the Polyclinic of Orthopedic & Traumatology, Polyclinic of Internal Medicine, Polyclinic of Geriatric and Polyclinic of Surgery. This study was conducted under a permission letter (No.: LB.02.01/C02/12526/Xl/2013) approved by the Health Research Ethics Committee of Dr. Hasan Sadikin General Hospital.
A total of 77 respondents from 40 to 90 years of age in the selected polyclinics were included using the random sampling method and all of them were informed of the objectives
and benefits of the study before the interview.
Written informed consent was obtained prior to the interview. Those refusing to be interviewed were excluded from this study.
The interview was conducted based on the questions provided in the FRAX Tool.5
Questions included age, gender, weight, height, smoking status, three or more alcoholic units per day, parent with a hip fracture, previous fracture, rheumatoid arthritis, prolonged glucocorticoid consumption, secondary osteoporosis and bone mass density score (BMD). Next, online calculation was conducted to calculate the respondent's percentage risk for major osteoporotic fracture over the next 10 years based on the integration of the clinical risk factors with or without the bone mass density (BMD) score.
Furthermore, fracture risks were classified
into three groups: low risk (FRAX score of less than 10% of osteoporotic fracture), moderate risk (FRAX score between 10-19% of osteoporotic fracture) and high risk (FRAX score of 20% or more for osteoporotic fracture).10 Percentage of fracture risks
obtained from the online calculation was then informed to the respondents.
Additionally, education on prevention of osteoporosis and fracture associated was also given after the interview to raise the awareness of the respondents on osteoporosis itself. The respondents were given education on lifestyle
and dietary modifications as well as preventive
measures such as fall preventions. Apart from that, the respondents with moderate fracture risk were given recommendation to perform bone mass density (BMD) testing for further evaluation of their risk of osteopenia and osteoporosis.
Data obtained from all the respondents were recorded and analyzed descriptively using Microsoft Excel. Results were then
classified into risk groups, age specific, gender specific and body mass index related and
presented using frequency distribution in the form of tables and chart.
Results
Most of the respondents had never performed any BMD testing before and only a few had done
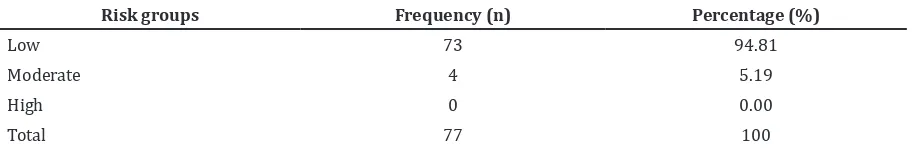
Table 1 Distribution of Risk Groups for Major Osteoporotic Fracture*
Risk groups Frequency (n) Percentage (%)
Low 73 94.81
Moderate 4 5.19
High 0 0.00
Total 77 100
it, but failed to remember the score. Therefore, the answers for the question on BMD were recorded as a 'no' for all respondents.
The percentage of fracture risks calculated
online using the FRAX Tool was classified into
3 groups: low risk, moderate risk and high risk according to the standardized fracture risk categorization. The study showed that from all
of the respondents, only 2 classifications were identified: low risk and moderate risk. Low risk covered 94.81% of the two classifications.
(Table 1)
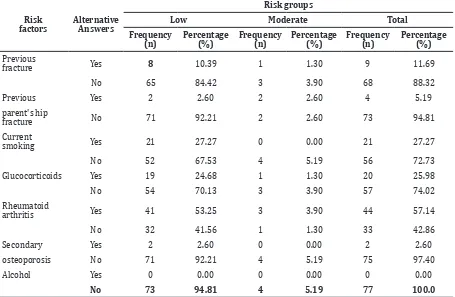
In Table 2, it is shown that all of the respondents had one or more risk factors of osteoporotic fracture although most of them
were included in low risk group. The main risk factors occurred were rheumatoid arthritis (57.14%), followed by current smoking and prolonged glucocorticoids consumption (27.27% and 25.98%, respectively). Four risk factors in the moderate risk group were
identified: previous fracture, parent’s previous
hip fracture, rheumatoid arthritis and prolonged glucocorticoids consumption.
Neither gender has high risk for major osteoporotic fracture based on FRAX Tool. In addition, none of the male respondents have moderate risk for major osteoporotic fracture as all four of the respondents with moderate risk are females. (Table 3).
Table 2 Distribution of Osteoporotic Fracture Risk Factors
Risk
factors AlternativeAnswers
Risk groups
Low Moderate Total
Frequency
(n) Percentage (%) Frequency (n) Percentage (%) Frequency (n) Percentage (%) Previous
fracture Yes 8 10.39 1 1.30 9 11.69
No 65 84.42 3 3.90 68 88.32
Previous Yes 2 2.60 2 2.60 4 5.19
parent's hip
fracture No 71 92.21 2 2.60 73 94.81
Current
smoking Yes 21 27.27 0 0.00 21 27.27
No 52 67.53 4 5.19 56 72.73
Glucocorticoids Yes 19 24.68 1 1.30 20 25.98
No 54 70.13 3 3.90 57 74.02
Rheumatoid
arthritis Yes 41 53.25 3 3.90 44 57.14
No 32 41.56 1 1.30 33 42.86
Secondary Yes 2 2.60 0 0.00 2 2.60
osteoporosis No 71 92.21 4 5.19 75 97.40
Alcohol Yes 0 0.00 0 0.00 0 0.00
No 73 94.81 4 5.19 77 100.0
Table 3 Distribution of Risk Groups Based on Gender
Gender
Risk groups
Total
Low Moderate
Frequency
(n) Percentage (%) Frequency (n) Percentage (%) Frequency (n) Percentage (%)
Male 34 44.16 0 0.00 34 44.16
Female 39 50.65 4 5.19 43 55.84
The study focused on population with age range from 40 to 90 years old in which FRAX Tool is only applicable. Age was further subdivided into 5 groups. The age group of 60–69 years has the most number of respondents with moderate risk whereas for age group of 70–79 and 80–89 years, each has one respondent with moderate risk for major osteoporotic fracture.
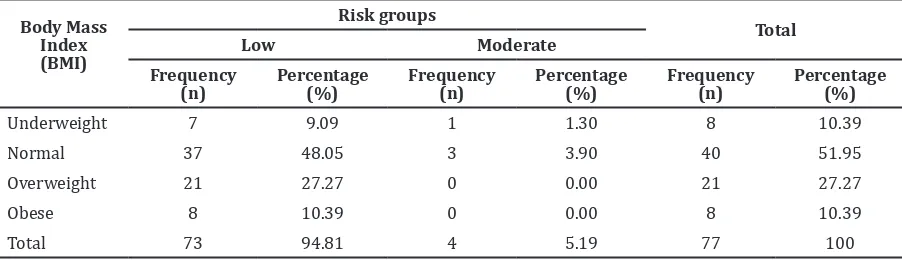
Distribution of risk groups related to the body mass index (BMI) of respondents is shown in Table 5. Respondents with moderate risk for major osteoporotic fracture were found to have underweight and normal weight status.
Discussion
In the present study, the FRAX Tool provided the assessment of fracture probability in both genders, and has been calibrated to the epidemiology of Indonesia which is available online.5 Interaction of each of the clinical risk
factors with or without the presence of bone mass density (BMD) score improved the accuracy for the fracture risk to be computed.
Some of the respondents with presence
of two risk factors such as previous fracture, parent’s previous hip fracture, prolonged glucocorticoid exposure and rheumatoid arthritis had moderate risk for 10-year fracture probability. These four risk factors were considered as strong risk factors in which
each of them had their significance for major
osteoporotic fracture probability. A previous study also showed that individuals especially women with presence of one of these four risk factors without BMD score had moderate risk of 10-year major osteoporotic fracture probability.7
The distribution of risks for major
osteoporotic fracture has been identified for all
the respondents using the online calculation of FRAX Tool. All the clinical risk factors on the FRAX Tool such as age, BMI, previous fracture, parent’s previous hip fracture and prolonged glucocorticoid exposure have been integrated in order to calculate the fracture risk
percentage. In the present study, it is identified
that presence of more than one risk factor will subsequently cause an increment in the ten-year major osteoporotic fracture probability. For example, 3 out of 4 respondents with moderate risk for major osteoporotic fracture
Table 4 Distribution of Risk Groups Based on Age
Age groups
Risk groups
Total
Low Moderate
Frequency
(n) Percentage (%) Frequency (n) Percentage (%) Frequency (n) Percentage (%)
40–49 20 25.97 0 0.00 20 25.97
50–59 26 33.77 0 0.00 26 33.77
60–69 21 27.27 2 2.60 23 29.87
70–79 4 5.19 1 1.30 5 6.49
80–89 2 2.60 1 1.30 3 3.90
Total 73 94.81 4 5.19 77 100
Table 5 Distribution of Risk Groups Based on Body Mass Index (BMI)
Body Mass Index (BMI)
Risk groups
Total
Low Moderate
Frequency
(n) Percentage (%) Frequency (n) Percentage (%) Frequency (n) Percentage (%)
Underweight 7 9.09 1 1.30 8 10.39
Normal 37 48.05 3 3.90 40 51.95
Overweight 21 27.27 0 0.00 21 27.27
Obese 8 10.39 0 0.00 8 10.39
had two risk factors present in which the ten-year fracture probability ranged from 11–12%. In a previous study, it showed the presence of more than one risk factor increased fracture probability in an incremental manner.7
All of the respondents with moderate risk for major osteoporotic fracture were female suggesting that women had higher risk of 10-year fracture probability compared to men. A study reported that the probabilities for a major osteoporotic fracture ranged from 3.5% to 31% in women, and from 2.8% to 15% in men.7 Another study showed, the 10-year
probability of major osteoporotic fracture risk for all women was 12.0% and 10.7% for men.11
Two of the respondents with moderate risk for major osteoporotic fracture within age range of 60 to 69 years old had fracture risk of 11%. The present study observed that as age increases, the 10-year fracture risk probability will also increase. Age is indeed a strong risk
factor that brings significance to the computed
fracture risk. The result from a previous study conducted in United Kingdom has reported that respondents with moderate risk for major osteoporotic fracture within age range of 60-69 years old have fracture risk of 11%.7
The BMI of respondents were classified
according to the Center for Disease Control and Prevention (CDC) into 4 categories: Underweight (BMI below 18.5), Normal weight (BMI 18.5–24.9), Overweight (BMI 25.0–29.9) and Obese (BMI of 30.0 and above). Findings from the present study showed that respondents with lower BMI had higher fracture risk compared to those with higher BMI. Fracture results from increased skeletal fragility that can be due to loss of bone mass. Individuals with higher BMI tended to have higher BMD. Hence, low bone mass and low body weight increased the risk for osteoporosis and fracture of an individual.2
Despite the fact that majority of the respondents had low risk for major osteoporotic fracture based on the FRAX Tool, education on lifestyle and preventive measures for osteoporosis was given to each one of them. These individuals did not require pharmacologic therapy but rather the knowledge on how to prevent fracture that is due to osteoporosis such as increasing the amount of daily calcium intake, doing physical activities and smoking cessation. As for respondents with moderate risk, it is recommended to have their BMD and additional clinical risk factors evaluated to prevent fracture and to decide whether or not pharmacologic therapy is required.10,12
Several limitations were identified during
the course of this study. Although FRAX Tool is well validated, there are several other risk factors that may be important in assessing individuals for 10-year fracture probability such as exercise and nutritional status. Apart from that, time constraint had also been recognized as one of the study limitations as there was lack of time for data collection and analysis. The sample population of the study was imbalance in terms of the distribution between age groups and genders. Since this study was conducted in the polyclinics of Dr. Hasan Sadikin General Hospital, the results of this study could not be generalized to the population of Indonesia.
In brief, this study identified that 95%
of the respondents had low risk for major osteoporotic fracture and the remaining 5% had moderate risk of major osteoporotic fracture for the next ten years to come. The
respondents identified with moderate risk
were all females. Apart from that, fracture risk probability increased as the age increased. This could be seen as all of the respondents with moderate risk for major osteoporotic fracture were above 60 years old. Majority of the respondents with moderate risk were either underweight or with normal BMI. Four strong risk factors in the moderate risk
group were identified whereby each one of them brought significance in calculating the
fracture risk probability. The risk factors were previous fracture, parent’s previous hip fracture, rheumatoid arthritis and prolonged glucocorticoids exposure.
References
1. WHO. Prevention and management of osteoporosis. Geneva: WHO
Technical Report Series. 2003
2. Mithal A, Dhingra V, Lau E. The Asian audit epidemiology, costs and burden of osteoporosis in Asia 2009. Switzerland: Arch Osteoporos. 2009
3. Watts NB, Bilezikian JP, Camacho RM, Greenspan SL, Harris ST, Hodgson SF, et al. American Association of Clinical Endocrinologists medical guidelines for clinical practice for the diagnosis and treatment of p o s t m e n o p a u s a l osteoporosis. Endocr Pract. 2010;16(3):1– 37.
fracture intervention trial. J Bone Miner Res. 2009;24(11):1793–9.
5. Kanis JA. FRAX ® WHO fracture risk assessment tool. United Kingdom: W o r l d Health Organization Collaborating Centre for Metabolic Bone Diseases. 2008. 6. Noor Z, Sumitro SB, Hidayat M,
Rahim AH, Taufiq A. Assessment
of microarchitecture and c r y s t a l structure of hydroxyapatite in osteoporosis. Univ Med. 2011;30(1):29–35.
7. Kanis JA, Johnell O, Oden A, Johansson H, McCloskey E. FRAX and the
assessment of fracture probability in men and women from the UK. Osteoporosis Int. 2008;19(4):385–97.
8. Horikawa A, Miyakoshi N, Shimada Y, Kodama H. FRAX and exercise : should exercise be categorized as a risk factor in osteoporotic patients. Open Journal of Orthopedics. 2013;3(2):133–36.
9. McCloskey E. FRAX ® Identifying people at high risk of fracture. WHO fracture risk assessment tool, a new clinical tool for informed treatment d e c i s i o n s . Switzerland: Arch Osteoporos. 2009
10. Papaioannou A, Morin S, Cheung AM, Atkinson S, Brown JP, Feldman S, et al. 2010 clinical practice guidelines for the
diagnosis and management o f
osteoporosis in Canada: summary. CMAJ. 2010;182(17):1864–73.
11. Leslie WD, Lix LM, Johansson H, Oden A, McCloskey E, Kanis JA. I n d e p e n d e n t clinical validation of a Canadian FRAX
tool: fracture prediction and
model calibration. J Bone Miner Res. 2010;25(11):2350–8.