Cigarette Tax Hikes
The Case of Maternal Smoking and Infant
Birth Weight
Diana S. Lien
William N. Evans
A B S T R A C T
Using a statistical matching procedure to choose control groups, we find that four states that adopted large cigarette tax hikes had corresponding decreases in smoking participation of pregnant women. Using the tax hike as an instrument for smoking in birth-weight equations and pooling data across experiments, we find that smoking during pregnancy doubles the chance an infant is born with a low birth weight. Our estimates are similar to single-equation estimates where maternal smoking is treated as exogenous.
I. Introduction
Since the release of the 1964 Surgeon General’s report, private and public health officials have waged an aggressive campaign against tobacco use. This campaign has included policies as diverse as restrictions on advertising, antismoking public service announcements, education programs, youth-access restrictions, and smoking bans in public places. In aggregate, these policies appear to have achieved some measure of success. Over the past 20 years, per capita cigarette consumption and the fraction of adult smokers have declined considerably.
Diana S. Lien is an economist at the CNA Corporation. William N. Evans is a professor of economics, University of Maryland, a Faculty Associate of the Maryland Population Research Center, and a Research Associate of the National Bureau of Economic Research. Preparation of this article was assisted by a grant from the Robert Wood Johnson Foundation Substance Abuse Policy Research Program. The authors are grateful to seminar participants at the University of Maryland, Brown University, Columbia University, Trinity College, CNA Corporation, Congressional Budget Office, U.S. Treasury Department and U.S. Census Bureau for helpful input. The data used in this article can be obtained beginning October 2005 through September 2008 from William N. Evans, Department of Economics, University of Maryland, College Park, MD 20742, evans@econ.umd.edu.
[Submitted May 2002; accepted August 2004]
ISSN 022-166X E-ISSN 1548-8004 © 2005 by the Board of Regents of the University of Wisconsin System
One policy instrument that has received a considerable amount of attention in the past few years is higher excise taxes on cigarettes. As Reducing Tobacco Use: A Report of the Surgeon Generalstates (p. 19-20), “raising tobacco excise taxes is widely regarded as one of the most effective tobacco prevention and control strate-gies.” For a variety of reasons, states are finding it increasingly easier to raise taxes on smokers. Between 1990 and 2003, there have been 113 increases in state excise taxes on cigarettes. Over that time, the average state tax (nominal) on cigarettes has increased from 23 to 73 cents/pack. A number of these tax increases have been incred-ibly large including 45 hikes of a quarter or more per pack and 15 hikes of 50 cents per pack or more.
The interest in trying to reduce smoking through higher taxes is spurred on in part by a large body of economic research showing that cigarette consumption falls after price or tax hikes. Chaloupka and Warner’s (2000) extensive review of the literature suggests the consensus price elasticity of demand is around −0.40. A typical study correlates changes in cigarette consumption over time within a state (either at the indi-vidual or aggregate level) to changes in price or tax rates. Given the time-span in most of these studies, demand elasticities are usually identified by small year-to-year changes in nominal tax rates.
There have been some efforts to examine differences across age, race, sex, or income groups in the estimated elasticity of demand, but there have been few efforts to examine the impact of tax hikes on an important group of smokers: pregnant women. Preterm labor and intrautarine growth retardation, which result in low birth weight, are related to smoking (Kramer 1987). The Surgeon General (U.S. D.H.H.S. 2000) concludes that smoking doubles the risk of a low-weight birth and according to Chomitz, Cheung, and Lieberman (1995), if all women stopped smoking when they became pregnant, at least 20 percent of all low birth-weight infants could be avoided.1 Evans and Ringel (1999) were the first to examine the relationship between ciga-rette excise taxes and smoking among pregnant women. Using Natality Detail data from 1989–92, they use a within-group estimator and calculate a smoking participa-tion elasticity of −0.5. Given the time frame considered, most of the year-to-year changes in state tax rates they examine were very small. Gruber and Köszegi (2001) using a rational addiction framework, calculate an effective price elasticity of smok-ing participation among pregnant women of −0.35. Gruber and Zinman (2001) find a price elasticity of smoking participation for older pregnant teens of −0.38, but much less of an impact of price on the smoking participation of younger pregnant teens. Finally, Coleman, Grossman, and Joyce (2002) use a longitudinal data set to track the smoking of women before, during, and after their pregnancy. They find that higher cigarette excise taxes increase smoking quit rates during pregnancy and reduce smok-ing relapse rates after birth. Their estimates suggest the price elasticity of prenatal quitting and postpartum relapse are both about one in absolute value.
The Journal of Human Resources 374
In this paper, we also examine the impact of higher taxes on maternal smoking and birth outcomes, but we look at this issue using a different methodology. We examine the smoking rates among pregnant women in four states before and after large, one-time tax hikes. There are four reasons we are interested in using these experiments in this context. First, since previous estimates of demand elasticities are based only on marginal price or tax changes, these estimates may not accu-rately predict the likely consequences of recent large tax hikes. Second, by focus-ing on one state at a time, we can use a more scientific method to choose a control group. Third, by focusing on these large tax hikes and pregnant women, we can potentially identify the health benefits of tax hikes. Fourth, as we document in the conclusion, large tax hikes are becoming more frequent.
Data for this project is taken from the 1990–97 Natality Detail files that contain a census of births in the United States and include measures of self-reported smok-ing for births in most states. We find that increassmok-ing cigarette excise taxes reduces smoking participation among pregnant women but the size of the response differs greatly across experiments with the smoking participation price elasticity of demand ranging from −1.83 to −0.10. The weighted average across the four states is −0.49, a number close to previous estimates. We also find that the tax hikes increased birth weight and decreased the risk of low birth weight and these changes occur almost immediately after the tax hike is imposed. We use two-stage least squares (2SLS) to calculate the impact of smoking on birth outcomes. Pooling the data from states with precise first-stage estimates, we find that smok-ing dursmok-ing pregnancy reduces birth weight by 182 grams and increases the chance of a low birth-weight estimate by 7 percentage points. Our results are statistically similar to OLS estimates, suggesting that the omitted variable bias is not severe in single equation models where maternal smoking is treated as exogenous.
II. Background
pack in states that had no other tax change in a four-year window.2Subsequently, we have identified four states (Arizona, Illinois, Michigan, and Massachusetts) that we can examine. The dates and size of the tax hikes are listed in Table 1.
Table 1 also includes some important descriptive statistics of births in the year prior to the tax hike for each state. Of the four states, the highest percentage of smokers in the year prior to the tax hike was in Massachusetts (23 percent) and the lowest was in Arizona (12 percent). In contrast, these states had the highest and lowest low birth-The Journal of Human Resources
376
Table 1
Descriptive Statistics of Births, Natality Detail File
Arizona Illinois Massachusetts Michigan
Date of tax hike 11/29/94 7/14/93 1/1/93 5/1/94 Change in tax (cents/pack) 18 to 58 30 to 44 26 to 51 25 to 75 Average retail price for pack 162.9 182.1 180.6 163.4
of cigarettes in fiscal year of tax hike
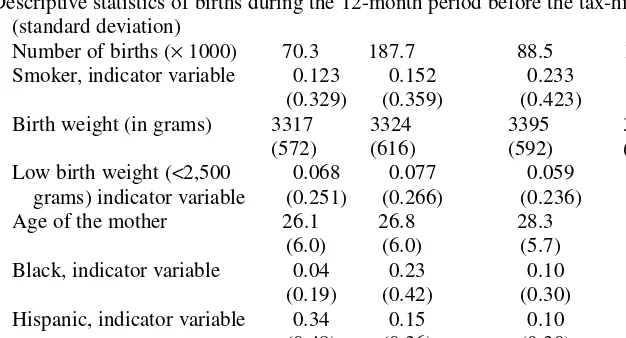
Descriptive statistics of births during the 12-month period before the tax-hike mean (standard deviation)
Number of births (×1000) 70.3 187.7 88.5 134.1 Smoker, indicator variable 0.123 0.152 0.233 0.196
(0.329) (0.359) (0.423) (0.397) Birth weight (in grams) 3317 3324 3395 3336
(572) (616) (592) (621)
Low birth weight (<2,500 0.068 0.077 0.059 0.080 grams) indicator variable (0.251) (0.266) (0.236) (0.267) Age of the mother 26.1 26.8 28.3 26.6
(6.0) (6.0) (5.7) (5.8)
Black, indicator variable 0.04 0.23 0.10 0.21 (0.19) (0.42) (0.30) (0.40) Hispanic, indicator variable 0.34 0.15 0.10 0.03 (0.48) (0.36) (0.30) (0.18) Married, indicator variable 0.62 0.66 0.74 0.71 (0.49) (0.47) (0.44) (0.46)
weight rates, respectively. This result is driven by the low fraction of minorities (Blacks or Hispanics) in Massachusetts and the high fraction in Arizona. These two groups tend to have low smoking rates but poor birth outcomes. Pretreatment smok-ing and low birth-weight rates were 15 and 7.7 percent in Illinois, respectively, and 20 and 8 percent respectively in Michigan.
How these four states spent the revenues generated from the tax hikes differed. Arizona, Illinois and Michigan raised cigarette taxes primarily to generate state tax revenues to pay for nontobacco-related programs. More than 60 percent of the rev-enue collected from Arizona’s 1994 40-cent tax hike went toward medical care for the uninsured and poor. The remainder of the revenue went toward antitobacco pro-grams and health research on prevention and treatment of tobacco-related illnesses (The Arizona Republican, February 16, 1995, p. A5). Illinois’ 1993 14-cent cigarette tax hike was passed to ease budgetary woes over funding for health services for the poor (St. Louis Post Dispatch, July 13, 1993, p. 1A). Michigan’s 1994 50-cent tax increase was passed to raise revenues to replace a portion of those lost when resi-dents voted to eliminate the property tax (New York Times, March 14, 1994, p. A15). Massachusetts’ 1992 25-cent state cigarette excise tax increase funded the Massachusetts Tobacco Control Program that included activities such as antismok-ing media campaigns, enforcement of local antismokantismok-ing laws, and educational programs targeted primarily at teenagers, and pregnant women (The Boston Globe, December 5, 1993, p. 4, and December 19, 1993, p. 50). Revenue from Massa-chusetts’ tax hike also went to health programs unrelated to smoking (The Boston Globe, March 5, 1993, p. 10).
In the next section, we describe a model that estimates the “treatment effect” asso-ciated with each state’s major tax hike. In the case of Arizona, Illinois, and Michigan, the text above suggests that we can reasonably attribute all of the change in con-sumption to the higher cigarette tax. In the case of Massachusetts, however, the treat-ment included a tax hike followed by a large antismoking media campaign. In a companion paper, Lien (2001) examines in detail the impact of the Massachusetts antismoking campaign on tobacco use among pregnant women and finds no addi-tional change in smoking after the start of the media campaign. This suggests that the drop in smoking we show for Massachusetts is driven by the tax change and not the media campaign.
III. Econometric Model
A. A Difference-in-Difference Model
months prior to the tax hike, and a full tax effect for women who conceived after the tax hikes were implemented.3
For each treatment state, we include data for 56 monthly periods: 24 months prior to any exposure to the tax hike, the eight months of a partial tax effect, and 24 months after the tax hike. For these periods, we also include data for the corresponding set of control states. Outcomes are measured at the individual level (i) and data varies across states (s) and months (m). The primary outcome of interest is a binary indicator for maternal smoking, denoted as S. The basic research question is whether the excise tax hike in a particular state decreased maternal smoking. Births that occurred in a treat-ment state are indicated by the dummy variable D. The equation estimated is of the form
(1) S X (D PART TAX )c +(D FULL TAX )a +n +y +!
s sm s sm
ism= ismb1+ * 1 * 1 1s 1m 1ism
where Xis a vector of characteristics that describe the mother and the pregnancy. We include variables on maternal age, race, ethnicity, marital status, and education.4We also include variables for the infant’s sex, parity of birth, plurality of birth, and Kessner adequacy index of prenatal care.5State and month of conception effects are represented by µand υrespectively and !is a random error. The variable PART TAX equals one for women who conceived during the eight months before the tax hike, and FULL TAXequals one for women who conceived during the 24 months following the tax hike. Since D*FULL TAXequals one only for the treatment state in the post-tax-hike period, the full tax-post-tax-hike treatment effect is measured by α1. The econometric model described in Equation 1 is a standard difference-in-difference model where states that did not raise their excise tax form a comparison group.
B. Choosing Control Groups
As Meyer (1995) points out, a difference-in-difference model will only provide con-sistent estimates of the treatment effect, if in the absence of the intervention, the time path in the outcome is the same in both treatment and control states. For example, suppose a major tax hike reduces the probability a mother smokes during pregnancy, but smoking rates are falling faster in treatment states than in controls. In this case, the difference-in-difference model will overstate the benefits of a tax hike.
We can never guarantee that the time paths of outcomes would be the same in the treatment and control states in the absence of the intervention. However, we increase this likelihood by choosing control states that possess the same month-to-month pattern
3. Month of conception is calculated from the month of last menses, weeks of gestation, and month of birth. 4. Our control categories are by maternal age (18 and under, 19 to 25, 26 to 32, 33 to 40 and older than 40), race (Black, white, and other race), Hispanic ethnicity and education (less than high school, high school graduate, some college, and college graduate).
5. We control for whether the birth was the mother’s first birth, second, or higher birth and whether the birth was a singleton, twin, or higher multiple birth. The Kessner index is a measure of the adequacy of prenatal care that indicates whether the mother went to an adequate, medium, or inadequate number of prenatal care visits given the gestation length of her pregnancy. It does not account for the quality of care received or any pregnancy risk factors that may be associated with a higher than average number of visits. Due to the limi-tations of the Kessner index, we checked and found that our results are not sensitive to the inclusion of this variable.
in smoking as the treatment state before the intervention. In selecting controls, we look at the 24 months before the conception of pregnancies that were at some stage when the tax was enacted. For Michigan, the tax hike occurred in May 1994, so we look at women who conceived between September 1991 and August 1993 to pick controls.
Our procedure to choose controls is as follows. Each treatment state has a unique set of potential controls that had no nominal change in state cigarette excise tax levels during the 56-month window.6Potential controls for each state are listed in Table 2. From this set, we ran regressions including data from only the treatment state and one potential control for the 24-month pretreatment period. The model for each treatment state is of the form:
!
+ D *
( )2 Sism=Xismb2+ns+ym+mm s ism
This equation is similar to Equation 1 above. In these regressions, we add the same set of covariates listed for Equation 1 and uand vare state and month of conception effects respectively. Since data from after the tax-hike treatment period is excluded, the equa-tion does not include the D*PART TAXor D*FULL TAXterms. The key terms in this regression are the coefficients on λm, which allow the monthly dummy variables to dif-fer between the state with a tax hike and a potential control. If we cannot reject the hypothesis that λ1 = λ2 = . . ..λ23 = 0, then conditional on differences in the level of use and X, the treatment state and the potential control have statistically the same monthly pattern in maternal smoking and we include this state as a control. The states in bold in Table 2 are those where we cannot reject the null the λ’s are jointly zero.
IV. Results
A. The Impact of Large Tax Hikes on Smoking
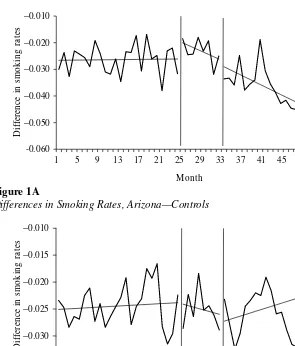
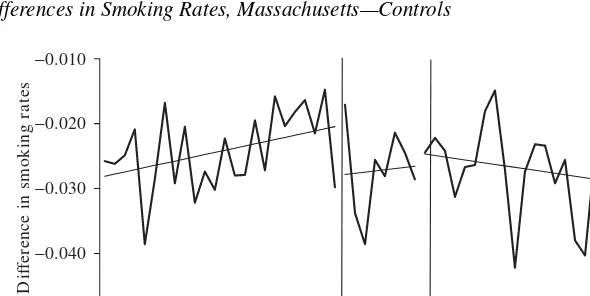
Before we present the results for Equation 1, we first graphically illustrate the impact of the tax hike on smoking rates. For each state experiment, we calculate monthly mean smoking rates for the treatment and control states and graph the difference over the 56-month samples. For the 24 pretreatment months, the eight transition months, and 24 post-treatment months we also provide a smoothed linear time trend that best fits the dif-ference. The results for Arizona, Illinois, Massachusetts, and Michigan are presented in Figures 1A–1D, respectively. First, note that for each state, there is little time trend in the pretreatment differences in smoking rates, which we would expect given our statis-tical procedure to pick control groups. Second, in all states except Illinois, there is a noticeable drop in smoking rates in the 24 post-treatment months. In Arizona and Michigan, these differences drop somewhat over time and in Massachusetts, there is lit-tle change over the initial drop in smoking. In contrast, the temporary drop in smoking experienced in Illinois during the transition period is eliminated by a slow steady increase in smoking in the post-treatment period. These figures suggest we should find little impact of the tax change in Illinois but noticeable changes for the other states.
Table 3 shows the treatment effects of the partial-tax and full-tax effects in the four states we consider and the results line up closely with the simple graphical analysis in
The Journal of Human Resources
380
Table 2
All Potential Control States, with Control States Matched on Smoking in Bold
Arizona Illinois Massachusetts Massachusetts without Worcester Michigan
Alabama Alabama Alabama Alabama Alabama
Alaska Alaska Alaska Alaska Alaska
Colorado Colorado Colorado Colorado Colorado
Delaware Delaware
Florida Florida Florida
Georgia Georgia Georgia Georgia Georgia
Iowa Iowa
Kansas Kansas Kansas Kansas Kansas
Kentucky Kentucky Kentucky Kentucky Kentucky
Louisiana Louisiana Louisiana
Maine
Mississippi Mississippi Mississippi Mississippi Mississippi
Nevada Nevada Nevada Nevada Nevada
New Hampshire New Hampshire New Hampshire New Hampshire New Hampshire
New Jersey New Jersey New Jersey
North Carolina North Carolina
Oklahoma Oklahoma Oklahoma
Pennsylvania Pennsylvania
South Carolina South Carolina South Carolina South Carolina South Carolina
Tennessee Tennessee Tennessee Tennessee Tennessee
Texas Texas Texas
Utah Utah
Virginia Virginia Virginia Virginia Virginia
West Virginia West Virginia West Virginia West Virginia West Virginia
Wyoming Wyoming Wyoming Wyoming Wyoming
Figure 1. We use as controls those states chosen systematically by the procedure out-lined for Equation 2.7
For each regression, we present three sets of standard errors. The first set is simply the OLS standard errors. In our case, the intervention is at the state level but the unit of observation is the individual so there is concern that errors within a state/year-cell may be correlated, reducing the effective number of observations. This problem is typically referred to as a “design effect” in the theoretical literature on random assign-ment trials and the problem arises when treatassign-ment randomization is done at the group rather than at the individual level. A standard solution for this problem is to use a pro-cedure similar to that in Huber (1967) that allows for arbitrary correlation in errors for
7. For each state, the results are similar regardless of whether we use the matched set of control states or the broader control group; therefore, we focus on the results from the matched model.
a state/year cluster. We have adopted this convention and standard errors generated by this procedure are reported in square brackets.
Bertrand, Duflo, and Mullainathan (2004) demonstrate a high Type I error rate in difference-in-difference models such as the one we outline above and attribute this to autocorrelation. They recommend implementing the Huber-type procedure allowing for arbitrary correlation in errors at the state level, which we adopt here and report in curly brackets. We should caution however that these Huber-type procedures are only consistent when the number of groups tends to infinity (Wooldridge 2003) and in our case, we have at most 11 states and as few as six.
Lien and Ev
ans
383
Arizona Illinois Massachusetts Massachusetts w/o Worcester Michigan
OLS Estimates
Partial tax hike 0.0029 −0.0015 −0.0649 −0.0349 −0.010
(0.0019) (0.0013) (0.0023) (0.0024) (0.00195)
[0.0016] [0.0011] [0.0023] [0.0022] [0.0021]
{0.0022} {0.0013} {0.0017} {0.0017} {0.0028}
Full tax hike −0.0092 −0.0011 −0.0699 −0.0379 −0.0114
(0.0013) (0.0009) (0.0017) (0.0017) (0.0014)
[0.0022] [0.0010] [0.0018] [0.00195] [0.0014]
{0.0029} {0.0018} {0.0039} {0.0039} {0.0010}
Full tax hike −0.34 −0.10 −3.24 −1.83 −0.22
Implied price (0.048) (0.090) (0.08) (0.08) (0.026)
Elasticity of participation
Probit Marginal Effects
Partial tax hike 0.001 −0.002 −0.0672 −0.043 −0.0120
(0.002) (0.001) (0.002) (0.002) (0.002)
Full tax hike −0.013 −0.002 −0.072 −0.047 −0.014
(0.001) (0.001) (0.002) (0.002) (0.001)
Full tax hike −0.46 −0.17 −3.33 −2.25 −0.26
Implied price (0.046) (0.10) (0.07) (0.08) (0.028)
Elasticity of participation
impact was in Massachusetts where the full tax hike resulted in a statistically signifi-cant 7 percentage point drop in smoking among pregnant women. The next largest drop in maternal smoking was in Arizona and Michigan, where there was a statisti-cally significant 1 percentage point drop in smoking. Illinois, the state with the small-est tax hike, had a statistically insignificant 0.1 percentage point drop in maternal smoking. For Arizona, Massachusetts, and Michigan we find little difference in the standard errors when we adjust for correlation within the state/month groupings or when errors are clustered solely by state.
In the bottom half of Table 3, we report results where we reestimate the basic mod-els using a probit instead of a linear probability specification. The marginal effects from the probit model, which represents the change in the probability of smoking given exposure to either the partial or full tax hike, are similar to the linear probabil-ity estimates.
Some have suggested that the impact of the tax hike may grow over time in that more addicted smokers may take longer to quit in response to the tax hike. The graphs in Figure 1 illustrate that the only state with a pronounced time series pattern in the treatment effect is Arizona. Breaking the final 24 months of the data into half-year intervals, the treatment effect in Arizona for these four periods is −0.0064, −0.0045, −0.0115, and −0.0143, respectively. The standard error in each of these cases is 0.0029 and we can reject the null hypothesis that all these coefficients are the same. In the other three states, we could not reject the null hypothesis that the treatment effect was the same over these four six-month periods.
The results for Massachusetts are of note. First, the drop in smoking is an astound-ing 7 percentage points, roughly 30 percent of the pre-reform smokastound-ing rate. This is an incredibly large drop in smoking for only a 25-cent increase in taxes. We looked at the data for Massachusetts in detail and noticed some abnormalities with the smok-ing data in Worcester County. Of births in December 1992, 54 percent of Worcester County women giving birth reported smoking during pregnancy, as opposed to 31 percent in February 1993. It would seem something concerning the vital statistics in Worcester County changed over this period and caused the drastic drop in smok-ing.8 For this reason, Worcester County is excluded from further analysis. When Worcester County is excluded from the Massachusetts sample, the decrease in smok-ing from the full tax-hike effect is a 4 percentage point drop.
B. The Implied Price Elasticity of Smoking Participation
From the tax-hike coefficient we calculate a price elasticity of smoking participation assuming prices increase penny for penny with a tax hike.9Table 3 reports the price
8. To confirm that Worcester County was an outlier we looked at the self-reported smoking rates among women giving birth in all counties in the four treatment states for the month prior to the tax hike and after the tax hike. The treatment state county with the next largest smoking rate in the month prior to a tax hike was Tazewell County, Ill., with a smoking rate of 33 percent. The next largest drop in self-reported smoking was an 11 percentage point drop in Middlesex County, Mass., from 32 percent in December, 1992. 9. This assumption is consistent with previous evidence. See for example Sumner (1981), Barnett, Keeler, and Hu (1995) Evans and Ringel (1999), and Evans, Ringel, and Stech (1999). In calculating the elasticities, we use the average price per pack of cigarettes and the smoking participation rate in the treatment state dur-ing the year of the tax change.
elasticity of maternal smoking participation for each of the treatment states using a lin-ear probability model and probit marginal effects. The elasticities for Illinois, Arizona and Michigan are smaller in magnitude than Evans and Ringel’s (1999) estimate of −0.5, but the results for Arizona (−0.34) and Michigan (−0.22) are similar to Gruber and Zinman’s (2001) estimates (−0.38) for older pregnant teenagers.10 Without Worcester County, the price elasticity of smoking participation in Massachusetts is −1.83. Focusing on the Massachusetts results without Worcester and using pretreat-ment births to take a weighted average of participation elasticities across all four states, we produce an average elasticity of −0.49, which is very close to previous estimates.
C. The Impact of Large Tax Hikes on Birth Outcomes
If higher cigarette taxes decreased maternal smoking, then the policy also may have improved birth outcomes. The Surgeon General (U.S. D.H.H.S. 2001) concludes that maternal smoking during pregnancy reduces birth weight by an average of 200 grams, doubles the chance of an infant having a low birth weight, and is responsible for 17 to 26 percent of low weight (<2,500 grams) births. Cigarette smoking has been identified as the “single largest modifiable risk factor for low birth weight . . .” (Shiono and Behrman 1995, p. 11). In addition, maternal smoking during pregnancy has been iden-tified as a cofactor for an elevated probability of sudden infant death syndrome, ectopic pregnancy, spontaneous abortion, and neonatal mortality (U.S. D.H.H.S. 2001).
The state tax hikes on cigarettes brought about variation in maternal smoking, allowing us to estimate the impact of maternal smoking on low birth weight. Since the tax hikes reduced maternal smoking in these states, we would expect to see improved birth outcomes among pregnant women affected by the tax hike. To examine the reduced-form relationship between tax hikes and birth outcomes, we estimate a model similar to that in Equation 1 where the outcome of interest is some measure of birth weight. In this instance, we use two outcomes: birth weight in grams and an indica-tor for whether a baby was born with a low birth weight (<2,500 grams). If Yis the birth outcome measure, then the reduced-form relationship we estimate is
)
FULL TAX a +n +y +!
) (
TAX c + D
PART
( )3 Yism=Xismb2+(Ds* sm 2 *s sm 2 2s 2m 2ism
where terms are defined in an analogous fashion with Equation 1.
Low birth weight is obviously a step further downstream from a tax hike—tax hikes decrease smoking which in turn should reduce the chance of a low-weight birth. Low birth weights are also a rare event. Therefore, in order to detect a statistically precise impact of tax changes on birth outcomes, we need large sample sizes of mothers in the treatment group. Given these concerns, we estimate two different types of models.
First, we examine reduced-form estimates for individual states. Second, we pool estimates across samples to enhance our ability to detect a statistically meaningful two-stage relationship between smoking and birth weight.
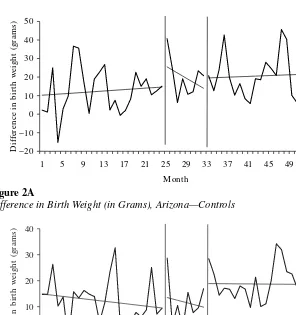
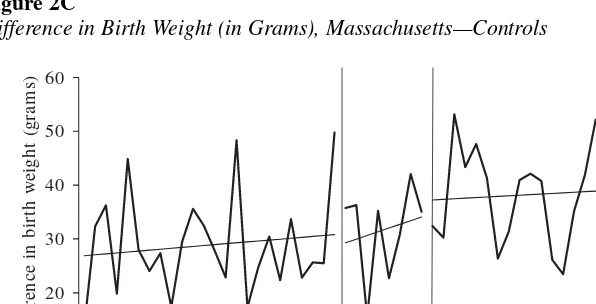
Before presenting the statistical results, we report a graphical treatment of the reduced-form results in Figure 2. For each experiment, we construct average monthly birth weights for the treatment and control states and graph the difference in averages for the 56 months in each sample. In the final 24 months of each sample, we see a notice-able increase in average birth weights in treatment states relative to controls. However, as the vertical axes in Figure 2 indicate, there is a small change in average birth weights since only a small fraction of women quit smoking as a result of the large tax hike.
The top portion of Table 4 shows the reduced-form estimates of birth weight (Row 1) and low birth-weight rate (Row 2) equations. For the reduced-form models, as we did in Table 3, we report simple OLS standard errors, standard errors that allow The Journal of Human Resources
Difference in Birth Weight (in Grams), Arizona—Controls
Figure 2B
for arbitrary correlation in state-year groups (in square brackets), and errors based on arbitrary correlation across observations within the same state (in curly brackets).
For each state, the introduction of a cigarette tax hike increased average infant birth-weight levels and decreased the rate of low birth-weight infants. Except for Arizona, the impact of the tax hike was larger among women who conceived after the tax hike was implemented than among pregnant women who conceived just before the tax hike. For Arizona and Michigan, average birth weight increased by a statistically significant 12 and six grams, respectively, for those partially exposed to the tax hike. In Illinois, which did not have a statistically significant drop in maternal smoking, the partial tax hike did not result in a statistically significant change in infant birth-weight levels or the low birth-weight rate. Consistent with Figure 2c, we find that during
10
Difference in Birth Weight (in Grams), Massachusetts—Controls
Figure 2D
The Journal of Human Resources
388
Table 4
Reduced Form, OLS and 2SLS Estimates of Birth-weight Equation
Massachusetts with/out
Arizona Illinois Worcester Michigan Pooled Results
Birth Low Birth Birth Low Birth Birth Low Birth Birth Low Birth Birth Low Birth Weight Weight Weight Weight Weight Weight Weight Weight Weight Weight
Reduced Form Estimates, Partial Tax Hike
11.79 −0.0017 0.74 0.0005 −6.31 −0.000 6.03 −0.0040 (3.28) (0.0014) (2.15) (0.0010) (3.54) (0.0015) (2.97) (0.0013) [3.10] [0.0013] [2.15] [0.0010] [3.29] [0.0011] [2.61] [0.0012] {2.31} {0.0007} {1.09} {0.0010} {1.23} {0.0004} {1.30} {0.0007}
Reduced Form Estimates, Full Tax Hike
7.67 −0.0026 5.53 −0.0013 6.32 −0.0015 10.93 −0.0033 (2.30) (0.0010) (1.52) (0.0007) (2.53) (0.0011) (2.11) (0.0009) [2.56] [0.0010] [1.52] [0.0007] [2.49] [0.0010] [1.98] [0.0008] {2.40} {0.0010} {2.33} {0.0006} {4.10} {0.0020} {3.14} {0.0015}
OLS Estimates
−229.64 0.054 −238.91 0.055 −219.81 0.044 −238.34 0.052 −231.0 0.051 (1.20) (0.001) (0.87) (0.000) (1.52) (0.001) (1.27) (0.001) (0.76) (0.0003)
2SLS Estimates
−313.10 0.193 −2765.17 0.402 −94.62 0.032 −894.51 0.306 −181.86 0.068 (209.93) (0.096) (2126.59) (0.577) (63.02) (0.027) (191.1) (0.084) (58.95) (0.026)
Massachusetts’ transition period there was no improvement in low birth-weight rates in the partial take hike period.
In all of the states, there was a statistically significant increase in birth weights and a decrease in the low birth-weight rate for conceptions after the tax hike. The largest improvement was in Michigan where the full tax resulted in average birth weights increasing by 11 grams and the low birth-weight rate decreasing by 0.3 percentage points. In Arizona, average birth weight increased by eight grams and the low birth-weight rate decreased by less than three-tenths of a percentage point. In Massachusetts, excluding Worcester County, the average birth weight increased by 6.3 grams.11
We can combine the estimates of the impact of large tax hikes on smoking and birth outcomes by estimating a two-stage least squares model of a birth-outcome equation where the tax hike is used as an instrument for smoking status. Consider an ordinary least-squares model of the effect of maternal smoking on birth outcomes of the form:
( )4 Yism=Xismb3+Sismp+n3s+y3m+!3ism
The ordinary least-squares estimates of the smoking coefficient, ξ, are subject to omit-ted variable bias if smoking and εare correlated. However, if the tax hike is uncorre-lated with the unobserved determinants of birth weight, then the treatment effect, modeled as D*PART TAXand D*FULL TAXcan be used as instruments for smoking in the 2SLS estimates of Equation 4.
The last two rows of results in Table 4 are the OLS and 2SLS estimates of Equation 4. For Arizona and Michigan, the single-equation estimates are lower than the 2SLS estimates. For Arizona, the 2SLS estimate of smoking in the birth-weight equation is a statistically insignificant −313 grams. The 2SLS estimate of smoking in the low birth-weight rate equation for Arizona is a statistically precise 0.19 percentage points. For Michigan, the state with the largest tax hike, we find smoking during pregnancy causes mean birth weight to decrease by a statistically significant 895 grams, and it increases the risk of low birth weight by a statistically significant 31 percentage points. The 2SLS estimates for Massachusetts without Worcester County are lower than the single equation results and statistically insignificant.12
We can increase the precision of estimation by pooling the results across the three experiments with statistically significant drops in smoking in the first stage. To esti-mate a pooled 2SLS coefficient, we stacked the data from Arizona, Massachusetts without Worcester, and Michigan. States such as Wyoming, which were controls for more than one treatment state, were treated as separate control states and were included more than once in the pooled data set. Because the treatment states’ tax changes occurred at different times, we have an experiment with a specific 56-month index interacted with each set of treatment and control states.
11. For Arizona, Massachusetts, and Michigan we find no change in significance of the full and partial tax-hike effects when we adjust for correlation within the state and specific month groupings using the proce-dure suggested by Huber (1967).
The pooled 2SLS estimate for birth weight is −181.9 with a standard error of 58.6. This coefficient is smaller in magnitude than the pooled birth-weight production function estimate of −231.13 The pooled 2SLS estimate for the rate of low birth-weight infants is 0.068 with a standard error of 0.026.14The 2SLS estimates indicate that within these three states, smoking during pregnancy reduces average birth weight by about as much as previously indicated by the Surgeon General. The 2SLS pooled results are within a standard error of the OLS estimates, suggesting that the omitted variable bias in this case is not a serious concern.
V. Conclusion
We use data from four states and a statistical matching procedure to choose control groups to examine how large cigarette excise tax hikes alter smoking among pregnant women. In three of the four states, we find statistically significant but varied responses to the tax hikes. On average, the implied elasticity of demand is very similar to results found in previous studies using marginal changes in taxes as identifi-cation. Interestingly, the reductions in smoking and improvements in birth weight occur almost immediately after the tax hike is implemented. The magnitude of the differences between states potentially reflects the size of the tax hike, different time periods of the tax hikes, state demographic characteristics, levels of debate surrounding the implemen-tation of the tax, and/or manners in how the revenue raised by the tax hike was spent.
In addition, there is evidence that the full tax hike affected birth weight and the rate of low birth weight in all of the states. Pooling the observations from states with sta-tistically significant drops in maternal smoking, we find that among women in these states who are likely to quit as a result of the tax hike, smoking reduces birth weight by 182 grams and doubles the chance of a low-weight birth. These estimates are con-sistent with those reported by the Surgeon General and provide compelling evidence of an impact of smoking on low birth rates.
We should caution, however, that because a minority of pregnant women smoke and the vast majority of low-weight births are to nonsmokers, even large cigarette taxes hikes will have a modest impact on aggregate infant health. To illustrate this point, con-sider the following calculation. In 2001, there were 4.026 million births, about 12 per-cent of the mothers of these children smoked, and roughly 310,000 babies were born with low-weight births. At the end of 2001, the average retail price of cigarettes in the United States was $3.37/pack (nominal) and the average state and Federal excise taxes total $0.77/pack. By February of 2004, average (nominal) state and Federal excise on
13. Our estimates do not account for unobserved parental health characteristics, such as paternal smoking or maternal drinking. The Natality Detail files do not include information on the father’s smoking behavior or maternal exposure to environmental tobacco smoke and the quality of the Natality Detail Files drinking data is poor (Evans and Ringel 1999).
14. Examining the 2SLS pooled estimates for Arizona, Massachusetts including Worcester County, and Michigan we find maternal smoking decreases birth weight by 76.6 grams (standard error 32.77), compared with the ordinary least squares estimate of −230. Maternal smoking increases the probability of having a low birth weight infant by 2.7 percentage points (standard error 0.01), compared with the ordinary least square estimate of 0.05.
cigarettes totaled $1.125/pack, an increase of roughly 29 cents in real 2001 dollars. Assuming the tax hikes were passed onto consumers in the form of higher prices, esti-mates pooled across all four experiments suggest that a nationwide 29-cent tax hike in 2001 would have reduced smoking among pregnant women by about 4.2 percent, result-ing in about 1,380 fewer low-weight births, or a drop in the low birth-weight incidence rate of only 0.45 percent. Any impact of tax hikes on health outcomes associated with low birth weight, such as infant mortality, is expected to be even smaller. Kleinman et al. (1988) estimate that infants whose mother smoked a pack of cigarettes a day during pregnancy have a 50 percent greater chance of dying during their first year. Returning to our example above, there were roughly 27,600 infant deaths in 2001 and if the esti-mates in Kleinman et al. are correct, a nationwide 29-cent increase in cigarette prices would reduce infant deaths by 66, or a reduction of 0.22 percent. So although our evi-dence is pretty convincing that cigarette smoking is detrimental to infant birth weight, large take hikes can have, at best, modest impacts on aggregate infant health.
The results from this paper are even more relevant now as states have been increas-ingly able to impose large tax hikes on cigarettes. At the end of 1996, there were nine states with cigarette excise taxes of $0.50 per pack or more and only three states with taxes in excess of $0.75/pack. By January of 2004, 31 states had taxes of $0.50 or more with 15 states having a tax of a dollar per pack or more. For a variety of reasons, states are much more willing and able to significantly raise the excise tax on cigarettes and the trend does not appear to be fading. In 2002 and 2003 alone, there were 45 tax hikes on cigarette excises taxes with the four largest raises occurring in Massachusetts ($0.75/pack), New Jersey ($0.70), Pennsylvania ($0.69), and Connecticut ($0.61). Although these recent tax hikes will have beneficial fiscal effects for state govern-ments and potential long-term health benefits for people who are either induced to quit or encouraged to not start smoking, our results indicate that there will be an immediate but modest impact on infant health.
References
Almond, Douglas, Kenneth Y. Chay, and David S. Lee. 2004. “The Costs of Low Birth Weight.” NBER Working Paper 10552. Cambridge, Mass.
Barnett, Paul G., Theodore E. Keeler, and The-Wei Hu. 1995. “Oligopoly Structure and the Incidence of Cigarette Excise Taxes.” Journal of Public Economics57(3):457–70. Bertrand, Marianne, Esther Duflo, and Sendhil Mullainathan. 2004. “How Much Should We
Trust Difference-in-Difference Estimates.” Quarterly Journal of Economics119(1):249–75. Chaloupka, Frank J., and Kenneth E. Warner. 2000. “The Economics of Smoking.” In The
Handbook of Health Economics, ed. Joseph P. Newhouse and Anthony J. Cuyler, 1539–1627. New York: North-Holland, Elsevier Science B.V.
Chomitz, Virginia R., Lilian W.Y. Cheung, and Elice Lieberman. 1995. “The Role of Lifestyle in Preventing Low Birth Weight.” The Future of Children, Vol. 5, no. 1., 121–38. Los Altos, Calif.: The David and Lucile Packard Foundation.
Coleman, Greg, Michael Grossman, and Ted Joyce. 2002. “The Effect of Cigarette Excise Taxes on Smoking Before, During and After Pregnancy.” NBER Working Paper 9245. Cambridge, Mass.
Evans, William N., Jeanne S. Ringel, and Diana Stech. 1999. “Tobacco Taxes and Public Policy to Discourage Smoking.” In Tax Policy and the Economy, vol. 13, ed. James M. Poterba 1–55. Cambridge, Mass: NBER and MIT Press.
Gruber, Jonathan, and Botond Köszegi. 2001. “Is Addiction “Rational?” Theory and Evi-dence.” Quarterly Journal of Economics116(4):1261–1305.
Gruber, Jonathan, and Jonathan Zinman. 2001. “Youth Smoking in the US: Evidence and Implications.” In Risky Behavior Among Youth: An Economic Analysis,ed. Jonathan Gruber, 69–120. Chicago: University of Chicago Press.
Huber, Peter J. 1967. “The Behavior of Maximum Likelihood Estimates Under Non-Standard Conditions,” Proceedings of the Fifth Berkeley Symposium on Mathematical Statistics and Probability1:221–33.
Kleinman, Joel C., M. B. Pierre Jr., Jennifer H. Madans, Garland H. Land, and Wayne F. Schramm. 1988. “The Effects of Maternal Smoking on Fetal and Infant Mortality.” American Journal of Epidemiology127(2):274–82.
Kramer, Michael S. 1987. “Determinants of Low Birth Weight: Methodological Assessment and Meta-analysis.” Bulletin of the World Health Organization65(5):663–737.
Lien, Diana S. 2001. “Measuring the Inputs to Infant Health: Evidence from Natural Experi-ments,” PhD Dissertation, University of Maryland, College Park, Maryland.
Meyer, Bruce D. 1995. “Natural and Quasi-Experiments in Economics.” Journal of Business and Economic Statistics13(2):151–61.
National Center for Health Statistics. 1992. Natality Detail File, 1990. National Center for Health Statistics, Hyattsville, Md.
———. 1993. Natality Detail File, 1991. National Center for Health Statistics, Hyattsville, Md. ———. 1994. Natality Detail File, 1992. National Center for Health Statistics, Hyattsville, Md. ———. 1995. Natality Detail File, 1993. National Center for Health Statistics, Hyattsville, Md. ———. 1996. Natality Detail File, 1994. National Center for Health Statistics, Hyattsville, Md. ———. 1997. Natality Detail File, 1995. National Center for Health Statistics, Hyattsville, Md. ———. 1998. Natality Detail File, 1996. National Center for Health Statistics, Hyattsville, Md. ———. 1999. Natality Detail File, 1997. National Center for Health Statistics, Hyattsville, Md. Ringel, Jeanne S., and William N. Evans. 2001. “Cigarette Taxes and Smoking During
Pregnancy.” American Journal of Public Health91(11):1851–56.
Shiono, Patricia H., and Richard E. Behrman. 1995. “Low Birth Weight: Analysis and Recommendations.” The Future of Children, Vol. 5, no. 1, 4–18. Los Altos, Calif.: The David and Lucile Packard Foundation.
Sumner, Daniel A. 1981. “Measurement of Monopoly Behavior: An Application to the Cigarette Industry.” Journal of Political Economy89(5):1010–19.
Tobacco Institute. 1998. The Tax Burden on Tobacco, 1997, vol. 32. Washington D.C.: Tobacco Institute.
U.S. Department of Health and Human Services. 2000. Reducing Tobacco Use: A Report of the Surgeon General. Atlanta, Georgia: U.S. Department of Health and Human Services, Centers for Disease Control and Prevention, National Center for Chronic Disease Prevention and Health Promotion, Office on Smoking and Health.
———. 2001. Women and Smoking: A Report of the Surgeon General. Atlanta, Georgia: U.S. Department of Health and Human Services, Centers for Disease Control and Prevention, National Center for Chronic Disease Prevention and Health Promotion, Office on Smoking and Health.
U.S. Public Health Service. 1964. Smoking and Health: Report of the Advisory Committee to the Surgeon General of the Public Health Service,U.S. Department of Health, Education and Welfare, Public Health Service, Center for Disease Control, PHS Publication No. 1103. Wooldridge, Jeffrey M. 2003. “Cluster-Sample Methods in Applied Econometrics.” American