Sophie Guthmuller is a PhD student in economics at PSL, Université Paris- Dauphine, LEDa- LEGOS. Florence Jusot is a professor of economics at Université de Rouen and an associate researcher at PSL, Université Paris- Dauphine, LEDa- LEGOS. Jérôme Wittwer is a professor of economics at Université Bordeaux Segalen and an associate researcher at PSL, Université Paris- Dauphine, LEDa- LEGOS. This study was fi nancially supported by the Haut Commissariat aux Solidarités actives contre la pauvreté (Ministère de la jeunesse et des solidarités actives) and by Health Chair, a joint initiative by PSL, Université Paris- Dauphine, ENSAE and MGEN under the aegis of the Fondation du Risque (FDR). Sophie Guthmuller thanks the Caisse Nationale d’Assurance Maladie des Travailleurs Salariés (CNAMTS) for the PhD scholarship. The authors are grateful to the Caisse Primaire d’Assurance Maladie (CPAM), the Caisse d’Allocations Familiales (CAF) of Lille, the Institut de Recherche et Documentation en Economie de la Santé (IRDES) and, in particular, Caroline Desprès, and the Institut National d’Etudes Démographiques (INED) for their contribution to the experiment implementation and for their help in the data preparation. The authors would like to thank Bruno Crépon, Andrew Clark, Michel Grignon, Tor Iversen, Maarten Lindeboom, Anthony Scott and Peter Siminski for their useful comments. The authors declare that there are no confl icts of interest and that the procedures followed within the experiment were in accordance with the ethical standards of the CNIL (Commission Nationale de l’Informatique et des Libertés). The data used in this article can be obtained beginning August 2014 through July 2017 from Sophie Guthmuller. Correspon-dence to: Sophie Guthmuller, LEDa- LEGOS, Université Paris- Dauphine, Place du Maréchal de Lattre de Tassigny, 75775 Paris Cedex 16, France. E- mail: sophie.guthmuller@dauphine.fr. Tel: +33 666835937. ISSN 0022- 166X E- ISSN 1548- 8004 © 2014 by the Board of Regents of the University of Wisconsin System
T H E J O U R N A L O F H U M A N R E S O U R C E S • 49 • 1
A Social Experiment in France
Sophie Guthmuller
Florence Jusot
Jérôme Wittwer
A B S T R A C T
I. Introduction
The French Social Security system covers 76 percent of all healthcare expenditures. Individuals can purchase a complementary health insurance (CHI) plan in order to reduce the remaining copayment. This system raises the issue of fi nancial access to care and the affordability of CHI for the poorest populations. In France, as in other countries with healthcare copayments, it has been widely reported that inequalities in access to healthcare are mainly explained by inequalities in access to CHI (Buchmueller et al. 2004; Doorslaer et al. 2004; Bago d’Uva and Jones 2009; Or, Jusot, and Yilmaz 2009). Because these inequalities are considered to be unfair, public policies have been implemented in order to improve the coverage of low- income households by reducing the fi nancial barriers that restrict their access to care.
In 2000, the French government instituted Complementary Universal Health Cover-age (CMU- C), offering free CHI to the 7 percent poorest households (Grignon, Perron-nin, and Lavis 2008). In 2005, a subsidized complementary health insurance program in the form of a voucher called an “Aide Complémentaire Santé” (ACS) was addition-ally introduced for poor households whose income was slightly above the CMU- C threshold. This program provides fi nancial incentives for uninsured households to ac-quire a CHI plan. It also partially reimburses those who had already purchased a pol-icy, and gives them an incentive to purchase a better- quality CHI plan. Currently only 6 percent of the French population does not have complementary insurance (Perron-nin, Pierre, and Rochereau 2011). However, 31 percent of households whose resources are just above the CMU- C eligibility threshold still remain uninsured (Arnould and Vidal 2008). This high rate of noncoverage among the poor is partly explained by the very low uptake of the ACS vouchers. In 2009, this program was used by only 18 percent of the eligible population.
Two main hypotheses can be formulated to explain this low ACS uptake. The fi rst is related to the lack of information regarding the program itself and the application pro-cess. This applies in particular to the eligible holders of an individual CHI who do not assert their rights. Recent literature reviews on the takeup of means- tested programs have shown that the nonpecuniary aspects of a program, such as stigma, transaction costs, administrative complexity, and lack of information may strongly infl uence en-rollment (Remler, Rachlin, and Glied 2001; Currie 2006). A number of pieces of work have shown that information plays a role in takeup. Lo Sasso and Buchmueller (2004), for example, found that lack of information about the State Children’s Health Insur-ance Program (SCHIP), partly due to little prior experience with public- insurInsur-ance programs, may have contributed to nonparticipation. Daponte, Sanders, and Taylor (1998) showed that informing people about Food Stamp benefi ts increased enrollment. Similarly Aizer (2003) found positive effects of outreach, especially in the form of application assistance, on the takeup of Medicaid.
Pauly 2006; Auerbach and Ohri 2006; Gruber 2008). Before the deduction of the ACS voucher, these premia may represent nearly 10 percent of the income of the poorest households (Kambia- Chopin et al. 2008; Jusot, Perraudin, and Wittwer 2012). As the ACS voucher covers only 50 percent of the contract premium (Fonds CMU 2008), the CHI may remain unaffordable for the poorest part of the eligible population even with the voucher: The subsidy may be insuffi cient to render the cost- benefi t tradeoff of be-ing insured attractive. Last, the application process induces an additional cost which may not be entirely covered by the fi nancial benefi t of the voucher; this might explain the nontakeup by eligible individuals who are already insured.
This paper aims to test those two main explanations of low ACS takeup. The elastic-ity of ACS demand to the subsidy amount will be central. Several previous pieces of work have proposed inferring the expected impact of a subsidy on insurance demand based on estimates of the price elasticity of insurance demand in general population surveys in France (Franc and Perronnin 2007; Grignon and Kambia- Chopin 2009) or in the United States (Marquis and Long 1995; Thomas 1995; Marquis et al. 2004; Auerbach and Ohri 2006). We here instead take a direct approach to public- policy evaluation by setting up a randomized social experiment to measure the effects of a change in the current subsidized CHI program on ACS takeup. We identify 4,209 in-dividuals who are potentially eligible for ACS via their resources and randomly assign them into three groups that were offered different ACS voucher amounts and access to information. This experiment was implemented by a local offi ce of the National Health Insurance Fund, called the Caisse Primaire d’Assurance Maladie (CPAM), in Lille, a large city in the North of France.1
The originality of our method should be underlined. Social experiments ensure the robust identifi cation of the causal effects of public interventions. However, imple-menting a controlled social experiment is particularly costly and requires the active participation of the institutions involved. Very little work on health insurance has used randomized social experiments. One famous exception is the experiment carried out by RAND in the United States in the 1970s, which provided a wide variety of robust results regarding the link between health- insurance coverage and healthcare expen-ditures and use (Manning et al. 1987). A randomized experiment on the same topic is currently being conducted in Oregon within Medicaid (Finkelstein et al. 2012).
Based on a randomized experiment we conducted in order to understand the low takeup rate of the ACS program in France, we propose to study two of the main hy-potheses put forward to explain low enrollment: a lack of access to information about the program and a voucher amount considered to be too low. To the best of our knowl-edge, our social experiment is fi rst to focus on the impact of subsidies and differenti-ated access to information on health insurance demand. Results show that a voucher increase has a small but signifi cant effect on takeup. The invitation to the meeting appears to cancel out the positive effect of the voucher increase. Our results suggest that reasons behind the poor takeup rate are also likely to be found at the administra-tion level. Our experiment underlines indeed the diffi culties in effectively reaching
the targeted population. This study fi nally confi rms the diffi culties that are faced in increasing the health insurance coverage of poor populations via subsidy programs.
The remainder of the paper is organized as follows. The design of the experiment and the data are described in Section II. Section III then presents the potential outcome framework that theoretically defi nes the evaluation of social programs and describes the outcome variables used in our experiment. Results regarding the effect of the voucher amount and information briefi ng proposal on ACS takeup in the controlled experiment framework are detailed in section IV and these results are discussed in section V. Section VI concludes.
II. The Design of the Social Experiment
A. Background
The French health insurance system consists of two parts: National Health ance (NHI) and complementary health insurance (CHI). The National Health Insur-ance fund provides public, compulsory, and universal health insurInsur-ance that covers 76 percent of overall health expenditure, about 90 percent of inpatient care expenses, 65 percent of ambulatory- care expenses, but very little with respect to dental and eye care (Le Garrec, Bouvet, and Koubi 2012). However, individuals suffering from long- term illnesses benefi t from full coverage of treatment costs related to their condition. This exemption from copayment does not, however, imply that these patients do not face relatively large out- of- pocket healthcare costs. For instance, they have to bear the copayments related to other illnesses they may have, but also any deductibles or charges that exceed the statutory fee2 for the expenditures related to their chronic disease (Elbaum 2008).
The French NHI does not thus cover all healthcare costs. The residual costs can be covered by a CHI policy. This CHI is additional, voluntary, and private. In France, CHI is not only complementary to NHI, as CHI covers copayments, but also supplements NHI as it can reimburse charges that exceed the statutory fee or healthcare expenses that are not covered at all by NHI (for instance, excess fees for doctor visits, non-reimbursed medication and private rooms in hospital). CHI contracts can be purchased either individually or through the individual’s employer. Starting in 2000, a free and public complementary health insurance, called CMU- C, has been available for income individuals, which pays for most out- of- pocket expenses. The CMU- C pro-gram covers 7 percent of the French population (Arnould and Vidal 2008).
2005 saw the introduction of a subsidized complementary- health- insurance pro-gram in the form of a voucher called the “Aide Complémentaire Santé” (ACS) for poor households whose income was slightly above the CMU- C threshold. In January 2009, households whose income level was between the CMU- C threshold and 20 percent
over this threshold were eligible for ACS: It thus applied to households with an an-nual income between 7,447€ and 8,936€ per consumption unit.3 In practice, eligible households can apply for ACS at their local National Health Insurance offi ce to benefi t from the voucher that is subtracted from the price of the insurance plan. This voucher is only valid for individual plans and does not apply to employer- provided plans.
As the CHI premiums in France increase with the age and the number of benefi cia-ries, the voucher amounts depend also on the number of benefi ciaries and their age, ranging from 100€ to 400€ per individual.4 Table 1 shows the voucher amounts in 2009 when the experiment was implemented. According to the CMU, the average annual cost of a CHI plan taken out by ACS benefi ciaries was 764€ in 2009 (Fonds CMU 2010). The voucher, hence, represents on average 50 percent of the annual CHI premium, all age groups taken together.
B. The Design
The experiment was jointly designed with the CPAM of Lille based on its previous practice. Up to 2009, the CPAM offered a specifi c service only to individuals who applied for the CMU- C but who were in fact eligible for ACS. These individuals were invited to an information briefi ng session and were proposed an increased voucher amount funded locally by the CPAM. Based on this existing practice, our social ex-periment was designed to test the impact of a general increase in the ACS subsidy and improved access to information in the form of a briefi ng session on ACS takeup among the entire eligible population for ACS.
The experiment relied on the national postal information campaign launched to inform individuals about the ACS scheme, organized at a local level by each CPAM. All potentially eligible individuals covered by the CPAM in Lille were identifi ed at the end of 2008 on the basis of their 2007 tax declarations which entitled them to family allowance benefi ts from the Lille Family Benefi ts Fund (CAF) in 2008.5 The computer
3. From January 2011, ACS covered individuals with resources up to 26 percent above the CMU- C plan eligibility threshold. This fi gure will be extended to 35 percent in 2012 (PLFSS 2011).
4. The voucher amounts have been revised upward, and new age brackets were defi ned in August 2009: under 16 years old = 100€; 16–49 years old = 200€; 50–59 years old = 350€; and 60 and over = 500€. 5. In French, CAF stands for “Caisse d’allocations familiales.” The CAF offers allowances related to fam-ily, children, housing, and the minimum income. Allowances entitlement and amounts are conditional on household income. It is important to note that using the mailing lists of the CAF to identify those potentially
Table 1
ACS Subsidy Amounts
Age Groups
Amounts (in Euros)
Under 25 100
25–59 200
search used by the French government to select the population potentially eligible for the ACS was originally conceived by the Grenoble Observatory on the nontakeup of social rights and public services (ODENORE) (Revil 2008a). 4,209 individuals were randomly selected to participate in the experiment among the individuals who were potentially eligible for ACS and who had not taken up their rights at the end of 2008.6
This experimental population was randomly divided into three groups. In Janu-ary 2009, 1,394 individuals assigned to the control group received a letter by post informing them of the National ACS scheme in force on that date; 1,412 individuals in the fi rst treatment group received the same letter but stipulating an increase in the voucher amount; and 1,403 individuals in the second treatment group received by post the same letter stipulating the increased voucher amount and a second letter with an invitation to an information briefi ng. A letter of one page explains in a few sentences the ACS scheme and the voucher amounts offered. The letters were identical between groups except the voucher amounts proposed. In addition, for the treatment groups, a sentence indicated that the extra vouchers were proposed within an experiment. An ACS application form that potentially eligible individuals were invited to return for effective eligibility assessment was enclosed in all the letters. This application form consists of eight pages. In addition to information related to characteristics of household’s members, applicants have to fi ll in 14 items about the resources of each member of the household.
The fi les provided by CAF only allowed us to target the population likely eligible for the ACS without guaranteeing their effective eligibility since, as noted above, the CAF fi les were based on 2007 income levels whereas ACS eligibility is based on income twelve months prior to application.
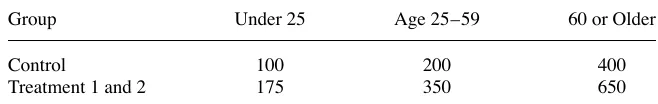
The voucher increase proposed to Treatment Groups 1 and 2 represented a 62.5 per-cent to 75 perper-cent increase over the national subsidy in force according to age. The fi nancial aid proposed per person to each age group is shown in Table 2.7
The information meeting on the ACS proposed to Treatment Group 2 and led by a social worker was conducted in groups of around 15 individuals and took place at the CPAM head offi ce in Lille. These briefi ngs lasted two hours and were aimed at
eligible for the ACS restricts the analysis to people entitled to the allowances offered by the CAF. Without being able to give a specifi c fi gure, it is likely that the selected sample is broadly representative of the eligible population. Nevertheless, we have selected a population who already use social security. This means that we remove from the analysis households who are eligible for ACS but systematically do not take up social benefi ts, and households who are eligible for the ACS but not for family allowances (for instance, elderly home owners).
6. Originally, 5,000 individuals were identifi ed. However, it should be kept in mind that ACS eligibility is evaluated in terms of household resources, and the program itself is a benefi t attributed to the household. Moreover, some households (dual- earner couples in particular) are composed of several individuals identifi ed by CAF as potentially eligible. During the information campaign the letters were sent by the CPAM to each individual; some households consequently received several letters. In our experimental setting, these cases are problematic. Two individuals who were randomly assigned into different groups but who belong to the same household may have received two different letters. To address this contamination bias, we removed from our sample all individuals belonging to the same household but assigned to different groups. In addition, we randomly selected an individual within households in which several individuals were assigned to the same group. Accordingly, dual- earner couples are generally but identically underrepresented in each group. The fi nal sample covers 4,209 individuals.
informing individuals about the ACS scheme and the formalities required to benefi t from it. During the briefi ng, the social worker addressed the following topics: (1) pre-sentation of the ACS scheme and the application procedure, (2) explanation of the eligibility rules and the type of resources that are taken into account, (3) eligibility as-sessment examples based on resources of some participants, and (4) collective support and advice on how to fi ll in the application form. In addition to the application form, the social worker handed out written supports summarizing the application procedure.
The meeting was not restricted to individuals who had returned an application form. Twelve briefi ngs were organized from February to April 2009, at a rhythm of two per week on Thursday and Saturday mornings. This is why letters to the second treatment group were sent out in successive waves over a two- month period so as to manage the fl ow of individuals who responded positively to the meeting invitation. An an-thropologist was present during meetings to observe the participants behavior and to understand the reasons for nontakeup. These observations are reported in Wittwer et al. (2010).
C. Experimental data matched with administrative data
The returned application forms and ACS agreements were observed between January 21, 2009 (the date at which the fi rst wave of letters was sent out) and July 30, 2009 (the experimental end date) by the CPAM benefi ts department. The data collected by the CPAM provides information on each individual included in the experimental sample: the experimental group; whether an ACS application form was returned; if after assessment they were notifi ed of their entitlement to ACS; in the case of refusal, whether it was due to above- threshold resources or on the contrary below- threshold resources entitling them to CMU- C. Finally, for individuals in Treatment Group 2, information on briefi ng attendance was recorded.
These data were then matched to CPAM administrative data containing information on age, gender, whether individuals were within the working population or out of the labor force due to disability or to retirement on December 31, 2008, long- term illness scheme benefi ciaries, ambulatory- care expenditures in 2008, CHI status prior to the experiment and CMU- C benefi ciaries in 2007. Table A1 in Appendixes presents the
Table 2
ACS Voucher Amounts Per Capita Proposed During the Experiment (in Euros)
Group Under 25 Age 25–59 60 or Older
Control 100 200 400
Treatment 1 and 2 175 350 650
full set of variables used. Information on inpatient care expenditure is not available, because these are not individually recorded by CPAM due to the specifi c fi nancing system of hospitals. Not taking these expenditures into account in the analysis does not much affect the willingness to buy a CHI, as CHI mostly covers ambulatory- care ex-penditure and inpatient care is almost entirely covered by National Health Insurance. Information on CHI plan status is collected by the CPAM thanks to a computer in-formation exchange standard called NOEMIE (Norme Ouverte d’Echange entre Mala-die et les Intervenants Extérieurs). This standard allows the electronic transmission of healthcare invoices between CPAM offi ces and CHI providers. Data on CHI coverage recorded via National Health Insurance does not tell us if the CHI was purchased through the employer or individually. Since individuals covered by an employer- provided CHI are actually not eligible for ACS, independently of their income level, this lack of information can induce an overestimation of the eligible population. However, we ex-pect this bias to be limited as employer- provided CHIs only represent around 20 per-cent of CHI plans among the low- income population (Arnould and Vidal 2008).
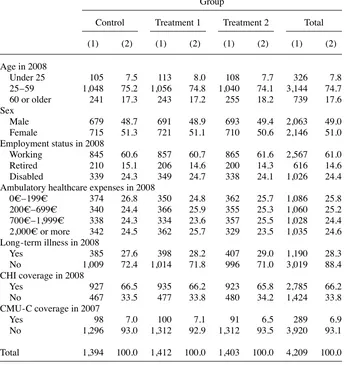
Table 3 provides descriptive statistics for the population under consideration. We check that the random assignment did indeed lead to very similar distributions of variables between groups.8 The sample is split equally between men and women. A large proportion, almost 80 percent, is aged 25 to 59 while the under- 25s represent less than 10 percent of each group. Regarding the employment status, 61 percent are in the working population, nearly 25 percent are out of the labor market due to dis-ability, and 15 percent receive a retirement pension. Finally, we note that one month before the start of the experiment, one individual out of three was not covered by a CHI plan,9 while 50 percent of the population had ambulatory healthcare expenditure greater than 700€ in 2008.
III. Methodology
A. Potential Outcomes Model
The evaluation of the effect of the voucher increase and the information meeting on the demand for ACS is theoretically based on the potential- outcome model, developed by Roy (1951) and Rubin (1974). More formally, we want to estimate the causal ef-fect of a treatment T on an outcome Y. This model defi nes two potential outcomes:
Yi1 the outcome of individual i when i is treated and Yi0 the outcome of individual i
when i is untreated. The causal effect of participating in the treatment for i is then
∆i = Yi1 – Yi0. But ∆i is always unobservable as only one of the outcome variables is
observable: When i is treated, Yi1 is realized and Yi0 is not observed. Yi0 is then called the counterfactual outcome and refers to the outcome Y that would have pertained had the individual been treated.
More precisely, we want to measure the average treatment effect (ATE) on the full
8. Chi- square tests accept the null hypothesis of independence.
population. ∆ATE = E[Y1 – Y0] = E[Y1] – E[Y0]. As the counterfactual is unobservable, our aim is to fi nd the best substitute in order to estimate the ATE without bias.
Within the framework of an experimental design, the treatment is randomly as-signed across individuals: Untreated individuals form the control group and treated individuals the treatment group. Thus if the sample of individuals is suffi ciently large, random assignment ensures that both groups are similar, not only with respect to
ob-Table 3
Description of the Population Before the Experiment
Group
Control Treatment 1 Treatment 2 Total
(1) (2) (1) (2) (1) (2) (1) (2)
Age in 2008
Under 25 105 7.5 113 8.0 108 7.7 326 7.8
25–59 1,048 75.2 1,056 74.8 1,040 74.1 3,144 74.7
60 or older 241 17.3 243 17.2 255 18.2 739 17.6
Sex
Male 679 48.7 691 48.9 693 49.4 2,063 49.0
Female 715 51.3 721 51.1 710 50.6 2,146 51.0
Employment status in 2008
Working 845 60.6 857 60.7 865 61.6 2,567 61.0
Retired 210 15.1 206 14.6 200 14.3 616 14.6
Disabled 339 24.3 349 24.7 338 24.1 1,026 24.4
Ambulatory healthcare expenses in 2008
0€–199€ 374 26.8 350 24.8 362 25.7 1,086 25.8
200€–699€ 340 24.4 366 25.9 355 25.3 1,060 25.2
700€–1,999€ 338 24.3 334 23.6 357 25.5 1,028 24.4
2,000€ or more 342 24.5 362 25.7 329 23.5 1,035 24.6 Long- term illness in 2008
Yes 385 27.6 398 28.2 407 29.0 1,190 28.3
No 1,009 72.4 1,014 71.8 996 71.0 3,019 88.4
CHI coverage in 2008
Yes 927 66.5 935 66.2 923 65.8 2,785 66.2
No 467 33.5 477 33.8 480 34.2 1,424 33.8
CMU- C coverage in 2007
Yes 98 7.0 100 7.1 91 6.5 289 6.9
No 1,296 93.0 1,312 92.9 1,312 93.5 3,920 93.1
Total 1,394 100.0 1,412 100.0 1,403 100.0 4,209 100.0
servable variables but also unobservable variables. This solves the self- selection issue by construction. Formally we have, E[Y0 \ T = 1] = E[Y0 \ T = 0] = E[Y0] and E[Y1 \
T = 1] = E[Y1 \ T = 0] = E[Y1].
In our social experiment we defi ned two different treatments: an ACS voucher in-crease for the fi rst treatment group and an information meeting proposal in addition to the voucher increase for the second treatment group. As these treatments were ran-domly assigned, the impact of the treatments can then be estimated by difference in the means between the treated and untreated groups. The effect of the voucher increase will then be estimated by the difference in the means between Treatment Group 1 and the control group, and that of the meeting proposal by the difference in the means of the outcome variable between Treatment Group 2 and Treatment Group 1. Signifi cant differences between groups are evaluated via Chi- squared tests.
B. Outcomes variables
We focus on two outcome variables to evaluate treatment effectiveness. We assess the demand for or the interest in the ACS by the number of returned application forms subsequent to the letter received from the CPAM. The fi rst outcome variable is then the rate of returned application forms.
Beyond the rate of completed application forms, and within the experimental frame-work, we can also calculate the percentage of individuals effectively entitled to ACS, since a number of the applications were refused. The second outcome variable is de-fi ned as the rate of ACS notifi ed—that is, the proportion of experienced individuals who effectively received an ACS voucher after eligibility reassessment by the CPAM. There are two cases where applications were refused; when individual’s resources were below the eligibility threshold, they could benefi t from the free CMU- C plan and when their resources were above the ACS cutoff point, their application were refused.
IV. Results
A. Impact of the voucher increase
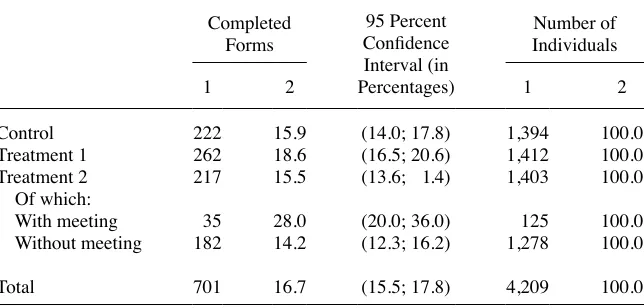
Of the 4,209 individuals involved, only 701 returned an application form for a takeup rate of 16.7 percent (Table 4). Table 4 also compares the application return rates by group. 15.9 percent of the control group returned an ACS application form (222 ap-plications). The takeup rate in Treatment Group 1, which benefi tted from the increased voucher amount, is higher (at the 5 percent signifi cance level) than that in the control group with 18.6 percent of applications. Increasing fi nancial aid thus appears to have a positive, though limited, impact on the probability of takeup.
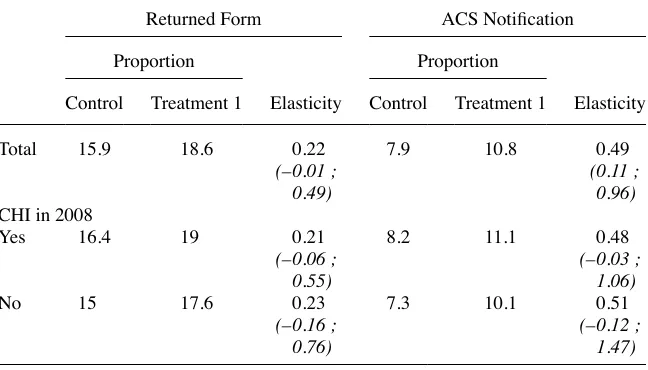
This impact can be measured by the elasticity of the probability of returning a com-pleted application form to the fi nancial aid proposed. This elasticity is calculated in average for all age- groups by the ratio of the rise between treatment groups in the probability of returned forms to the rise in the voucher amount,10 and is equal to 0.22
(Table 5). Surprisingly, the results are quite similar for individuals already covered by CHI (66.2 percent of the sample) and those who are not (33.8 percent). The rate of returned applications among individuals already covered by CHI is 16.4 percent in the control group and 19 percent in Treatment Group 1, as against 15 percent and 17.6 percent respectively among individuals without CHI coverage: These differences are not signifi cant. Similarly, we observe no difference in the elasticity of takeup rate to voucher amount according to CHI coverage (0.23 for individuals initially covered by CHI as against 0.21 for those not covered).
Looking at the ACS agreements and the case of refusals, we see that in total, 55.2 percent of returned applications were in fact eligible for ACS (Table 6), 10.1 per-cent were eligible for CMU- C but not ACS (in the cases where income was below the minimum ACS threshold) and 34.7 percent were refused because their income levels were too high. Among the 4,209 individuals included in the experiment, 9.2 percent were effectively eligible for ACS, 1.7 percent for CMU- C, 5.8 percent was refused both ACS and CMU- C, and 83.3 percent failed to apply (Table 6 and Table 7).
A comparison of the number of ACS agreements by group yields similar results to those obtained for the comparison between returned applications. However, the gap between the control group and Treatment Group 1 is accentuated. The rate of ACS agreements relative to the number of participants is 10.8 percent in Treatment Group 1 as against 7.9 percent in the control group. The voucher amount elasticity of the prob-ability of ACS notifi cation is 0.49 (Table 5), and is signifi cantly higher compared to the one calculated on the basis of the rate of returned forms. This increase in elasticity is explained by a much lower proportion of returned forms in the control group than in the Treatment Group 1. In fact, the proportion of ACS notifi cation among returned application forms is only 49.6 percent in the control group and 58 percent in the fi rst treatment group (Table 6).
Table 4
Returned ACS Application Forms
Completed Forms
95 Percent Confi dence Interval (in
Number of Individuals
1 2 Percentages) 1 2
Control 222 15.9 (14.0; 17.8) 1,394 100.0
Treatment 1 262 18.6 (16.5; 20.6) 1,412 100.0
Treatment 2 217 15.5 (13.6; 1.4) 1,403 100.0
Of which:
With meeting 35 28.0 (20.0; 36.0) 125 100.0
Without meeting 182 14.2 (12.3; 16.2) 1,278 100.0
Total 701 16.7 (15.5; 17.8) 4,209 100.0
The exceptional fi nancial aid offered to the individuals in Treatment Groups 1 and 2 appears to have more successfully targeted eligible benefi ciaries—that is to say, the poorest individuals in the experimental sample, as the rate of refusals due to income levels above the eligibility threshold is much lower in Treatment Groups 1 and 2 than in the control group (Table 7).
B. Impact of the proposed meeting
The rate of returned applications is 15.5 percent among Treatment Group 2, whose members received an invitation to an information briefi ng as well as a voucher in-crease. This rate is slightly lower than that in the control group but not signifi cantly so. On the contrary, the rate is signifi cantly lower in the second treatment group than in Treatment Group 1 (at the 5 percent signifi cance level). Somewhat unexpectedly, the invitation to the briefi ng appears to have impeded takeup, thus cancelling out the positive effect of the voucher increase.
Among the 1,403 individuals in Treatment Group 2, only 125 attended the informa-tion briefi ng to which they were invited (8.9 percent). Of these, 35 completed and returned an ACS application form. Individuals who attended the meeting are signifi -cantly more likely to complete an application form (and to obtain an ACS agreement). The takeup rate is 28 percent of the individuals who attended the briefi ng. On the contrary, among the 1,278 individuals in Treatment Group 2 who did not attend the
Table 5
The Voucher Amount Elasticity of ACS Demand
Returned Form ACS Notifi cation
Proportion Proportion
Control Treatment 1 Elasticity Control Treatment 1 Elasticity
Total 15.9 18.6 0.22 7.9 10.8 0.49
(–0.01 ; 0.49)
(0.11 ; 0.96)
CHI in 2008
Yes 16.4 19 0.21 8.2 11.1 0.48
(–0.06 ; 0.55)
(–0.03 ; 1.06)
No 15 17.6 0.23 7.3 10.1 0.51
(–0.16 ; 0.76)
(–0.12 ; 1.47)
Guthmuller
, Jusot, and
W
ittwer
179
Number of ACS Agreements
Percentage in Relation to the
Total Number of Individuals
95 Percent Confi dence Interval (in Percentages)
Percentage in Relation to the Total Number of Returned Application Forms
95 Percent Confi dence Interval (in Percentages)
Control 110 7.9 (6.5; 9.3) 49.6 (42.9; 56.2)
Treatment 1 152 10.8 (9.1; 12.4) 58.0 (52.0; 64.0)
Treatment 2 125 8.9 (7.4; 10.4) 57.6 (51.0; 64.2)
Attended the meeting 22 17.6 (10.8; 24.4) 62.9 (46.0; 79.6)
No meeting 103 8.1 (6.6; 9.6) 56.6 (49.3; 63.9)
Total 387 9.2 (8.3; 10.1) 55.2 (51.5; 58.9)
The Journal of Human Resources
Table 7
Cases of ACS Refusal
CMU- C Agreement Resources Above Upper Limit
Number
Percentage in Relation to the
Total Number of Individuals
Percentage in Relation to the
Total Number of Completed
Application Forms Number
Percentage in Relation to the Total Number of Individuals
Percentage in Relation to the
Total Number of Completed Application Forms
Control 25 1.8 11.3 87 6.2 39.1
Treatment 1 25 1.8 9.5 85 6.0 32.5
Treatment 2 21 1.5 9.7 71 5.1 32.7
Attended the meeting 2 1.6 5.7 11 8.8 31.4
No meeting 19 1.5 10.4 60 4.7 33.0
Total 71 1.7 10.1 243 5.8 34.7
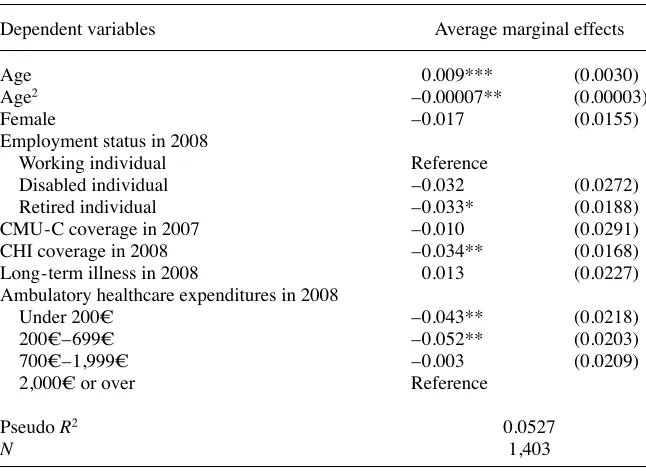
briefi ng, the takeup rate is only 14.2 percent. The information briefi ng thus seems to have a positive impact on the ACS takeup rate among those who participated and a negative effect for those who failed to attend the briefi ng. One explanation could be that some of the individuals in the second treatment group, those who did not go to the meeting, thought that meeting attendance was compulsory and therefore did not consider it a good thing to apply for the ACS because they could not attend the meet-ing. (This result remains signifi cant after controlling for covariates, see Table A2 in Appendixes.)
Note that the positive impact of the information meeting needs to be looked at more carefully as we can no longer rely on the experimental nature of our data at this point. As meeting attendance was not compulsory, it is likely that individuals self- selected themselves, that is, individuals with a positive expected outcome were more likely to participate. We tend to control for this potential endogeneity bias by employing a recursive bivariate model but we fi nd ambiguous evidence of the meeting attendance on ACS takeup (Guthmuller, Jusot, and Wittwer 2012).
C. Impact of covariates
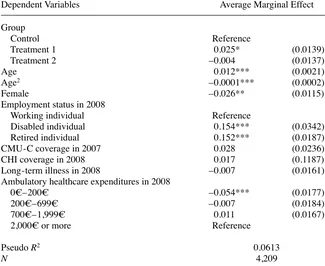
In order to look at the impact of covariates on the probability to complete an ap-plication form we run a probit regression on the whole sample (Table 8). First, the important thing to note is that these estimations confi rm the slight positive effect of the voucher increase and the deleterious effect of the meeting invitation within the experimental results. The average marginal effects are similar to the differences in the rate of returned forms between groups reported in Table 8.
Besides, it is very clear that expected high healthcare expenditures increase the probability of ACS takeup. It appears indeed that age and previous healthcare expen-ditures (in 2008) have signifi cant and big impacts. Similarly, the effect of disability is certainly linked to healthcare needs. It is fi nally worth noting that the people’s re-sponse to information on ACS benefi ts is mainly explained by healthcare needs while the role of economic incentives, as the voucher increase, appears to be much weaker. One can imagine that people with high healthcare needs are simply much more aware of any public program for healthcare benefi ts.
Last, the impacts of gender and retirement may be noticed. The effect of retirement is likely explained by the time that retired people can devote to ACS takeup. The impact of gender is more diffi cult to analyze. One possible explanation is the expected high proportion of single mothers in our sample. It is indeed diffi cult for single moth-ers to deal with the heavy administration process associated with ACS takeup.
V. Discussion
Nevertheless, we must be cautious about these comparisons because part of our experimental sample is initially covered by a CHI plan. We discuss this point below. In addition to the weakness of the takeup rate elasticity, the low takeup rate is intrigu-ing. We explore other potential explanations and ask whether the imprecise eligibility assessment rule used by the CPAM partly explains this weak enrollment rate.
A. Takeup rate and eligibility
As reported in Table 7, a sizeable number of applications were refused by the CPAM due to resources that were too high or too low. This imprecise targeting of the eligible population may be an initial explanation for low enrollment because noneligible in-dividuals may know that they cannot benefi t from ACS (for instance, through former social benefi ts applications).
Our experiment underlines the diffi culties in reaching the targeted population. These
Table 8
Likelihood of ACS Takeup
Dependent Variables Average Marginal Effect
Group
Control Reference
Treatment 1 0.025* (0.0139)
Treatment 2 –0.004 (0.0137)
Age 0.012*** (0.0021)
Age2 –0.0001*** (0.0002)
Female –0.026** (0.0115)
Employment status in 2008
Working individual Reference
Disabled individual 0.154*** (0.0342)
Retired individual 0.152*** (0.0187)
CMU- C coverage in 2007 0.028 (0.0236)
CHI coverage in 2008 0.017 (0.1187)
Long- term illness in 2008 –0.007 (0.0161)
Ambulatory healthcare expenditures in 2008
0€–200€ –0.054*** (0.0177)
200€–699€ –0.007 (0.0184)
700€–1,999€ 0.011 (0.0167)
2,000€ or more Reference
Pseudo R2 0.0613
N 4,209
diffi culties are due to the administration’s lack of precise information on actual family resources; thus, we do not have accurate information on who is eligible for ACS. As mentioned above, a nonnegligible number of individuals who returned an application form were not eligible for ACS. It is essential to take this factor into account because uncertainty about effective eligibility reduces the incentive to apply for the program.
To further investigate this issue, after the experiment, we collected new data on 2008 incomes for each individual to more precisely assess eligibility for ACS in 2009. After reassessing eligibility with this new information, we found that only 43 percent of the experimental sample for whom 2008 income was available, were eligible for ACS, confi rming that the initial eligibility targeting of the experimental population in 2008 was imprecise (Table 9). All the fi gures presented in this section are dragged from this new defi ned sample.
Among this redefi ned eligible population, the takeup rate rises to 24 percent. The failure of some individuals in the initial sample to apply could be explained by their knowledge of their ineligibility status. However, this rate remains low and suggests other obstacles to application. The refusal rate among applicants remains high: 22.3 percent of the claimants were refused due to resources beyond the entitle-ment criteria, of which 5 percent were refused due to resources that were too low and 17.2 percent because of resources that were too high. This fi nding underlines the complexity of eligibility criteria, which is heightened by the narrowness of the tar-get population. Moreover, imprecise tartar-geting of eligible people implies costs for the CPAM: the direct costs of sending letters to noneligible people, indirect costs due to the nonapplication of eligible individuals because of uncertainty about their eligibility, and the nonfi nancial costs borne by noneligible people who apply.
Our results also suggest that health insurance subsidies could help to better target eligible populations given that the acceptance rate is slightly higher in both treatment groups than in the control group (79.2 percent versus 74.4 percent). In particular, the proportion of refusals due to resources above the eligibility threshold was lower in both treatment groups, suggesting that the increase in the subsidy has attracted the poorest among the experimental sample.
B. Information costs
The Journal of Human Resources
Table 9
Returned ACS Application Forms Among the Redefi ned Sample
Control
Treatment 1
Treatment 2
Treatment 2: With Meeting
Treatment 2: Without
Meeting Total
1 2 1 2 1 2 1 2 1 2 1
Returned forms: 117 22.4 134 25.7 126 23.8 20 33.9 106 22.6 377
CHI 86 24.9 89 25.4 92 25.4 12 34.3 80 24.5 267
No CHI 31 17.5 45 26.2 34 20.4 8 33.3 26 18.2 110
Number of individuals 523 100.0 522 100.0 529 100.0 59 100.0 470 100.0 1,574
seem to have diffi culties in distinguishing the CMU- C plan from the ACS benefi t. Because the CMU- C is known to be a generous and free social CHI plan, people tend to be disappointed when they realize that ACS does not entitle them to a free plan (Wittwer et al. 2010).
As indicated above, individuals who attended the meeting were signifi cantly more likely to complete an application form (and to obtain an ACS agreement). This result must be considered carefully because we cannot rely on the experimental nature of our data at this point. Surprisingly, even when considering only the redefi ned sample of the eligible population, the enrollment rate remains low (36 percent of the newly defi ned sample of eligible individuals; Table 9). This result suggests that information costs may not be completely excluded by the briefi ng. To better understand the low enrollment rate of meeting participants, we exploit the qualitative insights collected by the anthropologist during meetings. According to her observations, two types of participants can be distinguished. The fi rst type understands most of the information provided during the meeting (Wittwer et al. 2010). Some people in this group decline to enroll because they realize that they are not eligible. Others do not enroll because they think that a CHI plan is too expensive after the voucher has been deducted (see below). The second type appears to be unable to assimilate the information provided during the meeting. Most of the time, people in this group do not apply.
We also fi nd that the invitation to participate in an information briefi ng discourages certain individuals from applying. This fi nding illustrates the diffi culty in adequately communicating the existence of a scheme and the administrative procedures involved to allow people to benefi t from it. Moreover, only 9 percent of the population attended a briefi ng, which may legitimize the idea of using third- party organizations (such as associations, mutual benefi t organizations, social workers) to disseminate information and support (Chauveaud and Warin 2009).
These observations confi rm the diversity of enrollment behaviors. To go further in the analysis of nontakeup, it is useful to separately consider individuals covered by a CHI plan and those without a CHI plan. The benefi t from the ACS appears to be very different for these two subpopulations. For individuals without CHI, the net benefi t from a complementary health insurance plan is questionable.
C. Benefi t from a CHI plan
Assuming rational behavior of eligible individuals without a CHI plan, we expect that these individuals will decide to apply for ACS if the benefi ts they could obtain from it exceed their costs. Several studies on reasons for the takeup of means- tested programs in the United States show evidence of such behavior (Remler, Rachlin, and Glied 2001; Currie 2006). For instance, a study by Janet Currie of Medicaid in 2000 fi nds that immigrant families with more children are more likely to enroll in the plan because they benefi t more without facing higher enrollment costs (Currie 2000).
program for this population. However, we can explore whether the program is valu-able for uninsured individuals regarding their potential copayment.
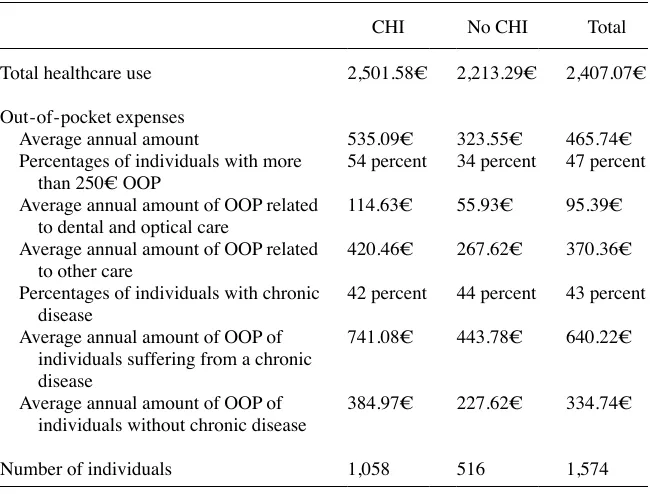
As expected considering their income level, this population has a generally poor health status, which may lead to important healthcare needs. Two indicators are avail-able in the administrative data to assess individual health status: the benefi t from an exemption from copayment for long- term illnesses and health expenditures. In 2008, 42.9 percent11 of the rede
fi ned sample of eligible individuals benefi ted from exemp-tions from copayment due to long- term illnesses, whereas this was only the case for 15 percent of the French population. In this redefi ned sample, the average amount of health expenditure was 2,407.07€ but health expenditures were strongly concentrated among individuals with the worst health status (Table 10). The mean health expendi-tures of people who benefi tted from a copayment exemption was 4,374.87€, whereas health expenditures for the remaining part of the population were 929.57€, on
aver-Table 10
Health Expenditures and Out- of- Pocket Expenses (OOP) in 2008 Among the Redefi ned Sample
Average annual amount of OOP related to dental and optical care
114.63€ 55.93€ 95.39€
Average annual amount of OOP related to other care
420.46€ 267.62€ 370.36€
Percentages of individuals with chronic disease
42 percent 44 percent 43 percent
Average annual amount of OOP of individuals suffering from a chronic disease
741.08€ 443.78€ 640.22€
Average annual amount of OOP of individuals without chronic disease
384.97€ 227.62€ 334.74€
Number of individuals 1,058 516 1,574
Notes: Out- of- pocket expenses after reimbursement by National Health Insurance (NHI).
age. After reimbursement by National Health Insurance, the average copayment was 465.74€ for the whole population, 640.22€ for individuals exempted because of a chronic illness, and 334.74€ among the rest of the population.
If we assume that the average health insurance premium is 500€ per year (Arnould and Vidal 2008; Jusot, Perraudin, and Wittwer 2012) and that the ACS voucher covers 50 percent of this premium, we can estimate that the program is valuable for individu-als who expect to have a copayment higher than 250€ per year. In fact, 47 percent of the sample and 34 percent of the individuals without a CHI plan had a copayment of more than 250€ in 2008. The average copayment for individuals without a CHI plan is 323.72€. Even without considering the out- of- pocket expenses for dental and optical care, which are not well covered by most of the CHI contracts, the average copayment is more than 250€ and is as high as 267.62€ for individuals without a CHI plan. Thus, the net benefi t of the program does not fully explain its low takeup rate among the population without a CHI plan. However, this result does not mean that enrollment behavior avoids rationality. In fact, the likelihood of returning a form is positively correlated with healthcare expenses (Table 8). The low takeup rate is even more ques-tionable among the population that was initially covered by an insurance plan.
D. Low takeup of covered people
We might expect that people covered by a CHI plan would systematically return forms given that ACS is a windfall for them. As reported in Table 9, however, only 25 per-cent of eligible individuals covered by a CHI plan in 2008 actually returned a form, regardless of the experimental group to which they belonged.
This low return rate is puzzling. First, we must keep in mind that some people who are covered by a CHI plan are covered by their employer and therefore are not eligible for ACS.12 As noted above, the proportion of insured people covered by their employer in the studied population represents roughly 20 percent of the insured population. Therefore, the corrected return rate for the insured population is likely to increase to 31 percent (under the assumption that people covered by their employer realize that they are not eligible). Nevertheless, it is unclear why most people covered by an individual plan do not return the form.
The failure to understand the information contained in the letter may also be a convincing explanation. As noted above, the letter mailed by the CPAM is written in an administrative syntax, and the social security scheme is particularly intricate. We might expect that some insured persons could misinterpret the eligibility scheme. In particular, they may expect the ACS voucher to be restricted to uninsured people or that the ACS benefi t requires the choice of a specifi c insurance plan that would require them to give up their current plan. Furthermore, applying to ACS requires covered people to indirectly reveal their income to their insurance companies (because they use the ACS voucher to pay their plan). Revealing his income may be unpleasant in itself and may be associated with the fear that the contract will not be renewed.
The low takeup rate of the insured population supports the idea that the low takeup rate of the uninsured population—the main target of the ACS program—cannot be wholly understood as a simple economic tradeoff between insurance benefi ts and the
premium amount. Nevertheless, we can observe that the takeup rates are very close in the control group and in Treatment Group 1 in the covered population, contrary to what is observed in the uninsured population (Table 9). This difference between the two populations is compatible with economic tradeoffs. Indeed, the voucher amount is not supposed to infl uence the takeup behavior of the insured population for whom the voucher is a windfall (regardless of the voucher amount assuming that it is suf-fi cient to compensate application costs). Conversely, it is supposed to infl uence the takeup behavior of the uninsured population, for whom the premium amount must be compared with the voucher amount.
E. Methodological issues
The experimental approach used in this study has the advantage of relying on the assessment of a program implemented in vivo. The randomization avoids selection issues, which are usually the main diffi culty in evaluating public policy. However, the improvement in internal validity robustness is counterbalanced by a loss in exter-nal validity representativeness. The studied population is only representative of the eligible population for ACS in Lille, which undoubtedly has its own particular char-acteristics. Nevertheless, Lille is the fourth- largest city in France and is characterized by a high unemployment rate. We can thus assume that the population of Lille is quite representative of the French low- income population. Similarly, the effectiveness of the experiment is dependent on the institution that conducted it and its relationship with the individuals concerned. There is no guarantee that the same experiment conducted with a similar population would provide the same results in another CPAM. Moreover, as with all experiments, this study is limited in time. It does not allow us to observe the long- term repercussions of the treatments given the potential slow diffusion of information. Ultimately, receiving an ACS agreement does not necessarily mean that it is used to purchase CHI coverage. Therefore, it would be interesting for future work to examine the effects of the treatments on CHI coverage.
VI. Conclusion
Based on a randomized experiment, this study proposes to understand the low takeup rate of the ACS program which is a complementary health insurance voucher program for the poorest in France. Two of the main hypotheses put forward to explain low enrollment were explored: a lack of access to information about the pro-gram and a voucher amount considered to be too low. To the best of our knowledge, this social experiment is fi rst to focus on the impact of subsidies and differentiated ac-cess to information on health insurance demand. Results show that a voucher increase has a small but signifi cant effect on takeup.
In the French context, this experiment provides some relevant elements for im-proving access to health insurance of the low- income population. Considering that increasing the voucher amount slightly improves the ACS takeup rate and better tar-gets the eligible population, we may expect that the increase in the standard amount of fi nancial aid for individuals aged 50 and over instituted on January 1st 2010 will have a positive impact on ACS takeup. However, as this national increase is lower than that proposed within the framework of our experiment, we can also expect the impact to be smaller. Moreover, this experiment points out the diffi culty of reaching a target population by means of a postal information campaign, such as that implemented at the national level in 2008–2009, and the counter- productive nature of the invitation to an information briefi ng. In this light, extending the target population on January 1, 2011 may be a fi rst step to encouraging ACS takeup.
The Journal of Human Resources
Appendixes
Table A1
Description of Variable Set
Type Variables Description
Experimental data Completed form returned Dummy variable = 1 if individual returned completed applica-tion form, 0 otherwise
ACS proposal Dummy variable = 1 if individual received an ACS proposal after CPAM assessment, 0 otherwise
CMU- C proposal Dummy variable = 1 if individual received an ACS refusal but a CMU- C proposal (in case of resources below ACS eligibility threshold) after CPAM assessment
ACS refusal Dummy variable = 1 if individual received an ACS and CMU- C refusal (in case of resources above ACS eligibility cap) after CPAM assessment, 0 otherwise
Guthmuller
, Jusot, and
W
ittwer
191
Health, Healthcare Ambulatory healthcare expenses in 2008 0€–199€
utilization and 200€–699€
CHI coverage 700€–1,999€
2,000€ or more
Long- term diseases in 2008 Dummy variable = 1 if individual had a long- term disease in 2008, 0 otherwise (LTC)
Complementary health insurance coverage in 2008 (December 31)
Dummy variable = 1 if individual is covered by a CHI in 2008, 0 otherwise
Complementary health insurance coverage after experiment (September 30, 2009)
Dummy variable = 1 if individual is covered by a CHI after experiment, 0 otherwise
CMU- C coverage in 2007 (December 31) Dummy variable = 1 if individual is covered by CMU- C in 2007, 0 otherwise
Employment status in 2008 (December 31) Working individual (includes occupied and unemployed individuals)
References
Aizer, Anna. 2003. “Low Take- Up in Medicaid: Does Outreach Matter and for Whom?”
American Economic Review Papers and Proceedings 93(2):238–41.
Arnould, Marie- Laure, and Guillaume Vidal. 2008. “Typologie des Contrats les Plus Souscrits auprès des Complémentaires en 2006.” Etudes et Résultats 663.
Auerbach, David, and Sabina Ohri. 2006. “Price and Demand for Non- Group Health Insur-ance.” Inquiry 43(2):122–34.
Bago d’Uva, Teresa, and Andrew M. Jones. 2009. “Health Care Utilisation in Europe: New Evidence from the ECHP.” Journal of Health Economics 28(2):265–79.
Buchmueller, Thomas C., Agnes Couffi nhal, Michel Grignon, and Marc Perronnin. 2004. “Ac-cess to Physician Services: Does Supplemental Insurance Matter? Evidence from France.”
Health Economics 13(7):669–87.
Bundorf, M. Kate, and Mark V. Pauly. 2006. “Is Health Insurance Affordable for the Unin-sured?” Journal of Health Economics 25(4):650–73.
Chauveaud, Catherine, and Philippe Warin. 2009. “Favoriser l’Accès aux Soins des Bénéfi ci-aires de Minima Sociaux. Expliquer la CMU- C et l’ACS aux Populations Potentiellement Eligibles.” Odenore collection Etude 32.
Cnamts. 2011. “Médecins Exerçant en Secteur 2: Une Progression Continue des Dépassements
Table A2
Likelihood of meeting attendance (Treatment Group 2)
Dependent variables Average marginal effects
Age 0.009*** (0.0030)
Age2 –0.00007** (0.00003)
Female –0.017 (0.0155)
Employment status in 2008
Working individual Reference
Disabled individual –0.032 (0.0272)
Retired individual –0.033* (0.0188)
CMU- C coverage in 2007 –0.010 (0.0291)
CHI coverage in 2008 –0.034** (0.0168)
Long- term illness in 2008 0.013 (0.0227)
Ambulatory healthcare expenditures in 2008
Under 200€ –0.043** (0.0218)
200€–699€ –0.052** (0.0203)
700€–1,999€ –0.003 (0.0209)
2,000€ or over Reference
Pseudo R2 0.0527
N 1,403
d’Honoraires, la Nécessité d’une Réforme Structurelle du Système.” Point d’information du 17 mai 2011.
Craig, Peter. 1991. “Costs and Benefi ts: A Review of Research on Take- up of Income- Related Benefi ts.” Journal of Social Policy 20(4):537–565.
Currie, Janet. 2000. “Do Children of Immigrants Make Differential Use of Public Health Insurance?” In Issues in the Economics of Immigration , ed. George Borjas, University of Chicago Press and National Bureau for Economic Research, 399 pages.
———. 2006. “The Take- Up of Social Benefi ts.” In Poverty, the Distribution of Income, and Public Policy, eds. Auerbach, Alan J., David Card, and John M. Quigley:80–148. New York: Russell Sage.
Daponte, Beth Osborne, Seth Sanders, and Lowell Taylor. 1998. “Why Do Low- Income Households Not Use Food Stamps? Evidence from an Experiment.” Journal of Human Resources 34(3):612–28.
Doorslaer, Eddy van, Xander Koolman, and Andrew M. Jones. 2004. “Explaining Income- Related Inequalities in Doctor Utilisation in Europe.” Health Economics 13(7):629–47. Elbaum, Mireille. 2008. “Participation Financière des Patients et Equilibre de l’Assurance
Maladie.” Lettre de l’OFCE 301.
Finkelstein, Amy, Sarah Taubman, Bill Wright, Mira Bernstein, Jonathan Gruber, Joseph P. New house, Heidi Allen, Katherine Baicker, and The Oregon Health Study Group. 2012. “The Oregon Health Insurance Experiment: Evidence from the First Year.” Quarterly Journal of Economics 127(3):1057–106.
Fonds CMU. 2008. “L’Aide à la Complémentaire Santé en 2007.” Rapport du Fonds CMU au Gouvernement sur l’évolution du prix et du contenu des contrats ayant ouvert droit à l’aide complémentaire santé en 2007 (en application de l’article L.863- 5 du Code de la Sécurité Sociale). June 2008.
———. 2010. “L’Aide à la Complémentaire Santé en 2009.” Rapport du Fonds CMU au Gouvernement sur l’évolution du prix et du contenu des contrats ayant ouvert droit à l’aide complémentaire santé en 2009 (en application de l’article L.863- 5 du Code de la Sécurité Sociale). June 2010.
Franc, Carine, and Marc Perronnin. 2007. “Helping the Poor to Acquire a Complementary Health Insurance: An Initial Appraisal of the ACS System.” Issues in Health Economics 121 Irdes.
Gilles- Simon, Marie- Odile, and Michel Legros. 1996. “Le Non- Recours Chez les Plus Pauvres: une Approche Empirique” Recherches et Prévisions 43(1):51–58.
Grignon, Michel, and Bidénam Kambia- Chopin. 2009. “Income and the Demand for Comple-mentary Health Insurance in France.” Document de travail Irdes 24.
Grignon, Michel, Marc Perronnin, and John N. Lavis. 2008. “Does Free Complementary Health Insurance Help the Poor to Access Health Care? Evidence from France.” Health Economics 17(2):203–19.
Gruber, Jonathan. 2008. “Covering the Uninsured in the United States.” Journal of Economic Literature 46(3):571–606.
Guthmuller, Sophie, Florence Jusot, and Jérôme Wittwer. 2012. “Improving Take- Up of Health Insurance Programs: A Social Experiment in France.” Cahiers de la Chaire Santé. 11. Jusot, Florence, Clémence Perraudin, and Jérôme Wittwer. 2012. “L’Accessibilité Financière
à la Complémentaire Santé en France: Les Résultats de l’Enquête Budget de Famille 2006”
Economie et Statistique 450(1):29–46.
Kambia- Chopin, Bidénam, Marc Perronnin, Aurélie Pierre, and Thierry Rochereau. 2008. “Complementary Health Insurance in France in 2006: Access Is Still Unequal.” Issues in Health Economics 132. Irdes.
———. 1983. “Making Ends Meet: An Investigation into the Non- Claiming of Supplementary Pensions.” London: Bedford Square Press.
Le Garrec, Marie- Anne, Marion Bouvet and Malik Koubi. 2012. “Les Comptes Nationaux de la Santé en 2011.” Etudes et Résultats 809. Drees.
Lo Sasso, Anthony T., and Thomas C. Buchmueller. 2004. “The Effect of the State Children’s Health Insurance Program on Health Insurance Coverage.” Journal of Health Economics
23(5):1059–82.
Manning, Willard G., Joseph P. Newhouse, Naihua Duan, Emmett B. Keeler, Arleen Leibow-itz, and M. Susan Marquis. 1987. “Health Insurance and the Demand for Medical Care: Evidence from a Randomized Experiment.” American Economic Review 77(3): 251–77. Marquis, M. Susan, and Stephen H. Long. 1995. “Worker Demand for Health Insurance in the
Non- Group Market.” Journal of Health Economics 14(1):47–63.
Marquis, M. Susan, Melinda Beeuwkes Buntin, José J. Escarce, Kanika Kapur, and Jill M. Yegian. 2004. “Subsidies and the Demand for Individual Health Insurance in California.”
Health Services Research 39(5):1547–70.
Or, Zeynep, Florence Jusot, Egin Yilmaz, and The European Union Working Group on Socioeconomic Inequalities in Health. 2009. “Inégalités Sociales de Recours aux Soins en Europe: Quel Rôle pour le Système de Soins ?” Revue Economique 60(2):521–43. Perronnin, Marc, Aurélie Pierre, and Thierry Rochereau. 2011. “Complementary Health
Insur-ance in FrInsur-ance: Wide- Scale Diffusion but Inequalities of Access Persist.” Issues in Health Economics 161. Irdes.
PLFSS. 2011. “Projet de Loi de Financement de la Sécurité Sociale pour 2011.” Rapport sur le site internet de la sécurité sociale: www .securite- sociale.fr / chiffres / lfss / lfss2011 / 2011_plfss .pdf.
Remler, Dahlia K., Jason E. Rachlin, and Sherry A. Glied. 2001. “What Can the Take- Up of Other Programs Teach Us About How to Improve Take- Up of Health Insurance Programs?” NBER Working Paper 8185.
Revil, Héléna. 2008a. “Identifi er des Populations en Non- recours aux Dispositifs de l’Assurance Maladie: Proposition de Méthode.” Recherches et Prévisions 93(1):102–09. ———. 2008b. “Le Non- recours à la Couverture Maladie Universelle Complémentaire
(CMU-C) et à l’Aide Complémentaire Santé (ACS).” Etudes et recherches 25. Odenore. Roy, A. D. 1951. “Some Thoughts on the Distribution of Earnings.” Oxford Economic Papers,
New Series 3(2):135–46.
Rubin, Donald B. 1974. “Estimating Causal Effects of Treatments in Randomized and Nonran-domized Studies.” Journal of Educational Psychology 66(5):688–701.
Saliba, Bérengère, and Bruno Ventelou. 2007. “Complementary Health Insurance in France: Who pays? Why? Who Will Suffer from Public Disengagement?” Health Policy 81(2): 166–82.
Thomas, Kathleen. 1995. “Are Subsidies Enough to Encourage the Uninsured to Purchase Health Insurance? An Analysis of Underlying Behavior.” Inquiry 31(4):415–24.
Van Oorschot, Wim. 1991. “Non Take- Up of Social Security Benefi ts in Europe”. Journal of European Social Policy 1(1):15–30.
———. 1998. “Failing Selectivity: On the Extent and Causes of Non- Take- Up of Social Security Benefi ts.” In Empirical Poverty Research in Comparative Perspective, ed. H. J. Andress, 101–32. Ashgate: Aldershot.