INVESTIGATION OF LITHOSPHERIC STRUCTURE IN MONGOLIA: INSIGHTS
FROM INSAR OBSERVATIONS AND MODELLING
Z. Jing a,b, F. Bihong a, *, S. Pilonga , G. Qiang a,b
a Institute of Remote Sensing and Digital Earth, Chinese Academy of Sciences, 100094 Beijing, China - (zhangjing2015, fubh,shipl,
guoqiang)@radi.ac.cn
b University of Chinese Academy of Sciences, Beijing 100049, China
Commission III, WG III/2
KEY WORDS: Crustal Deformation, InSAR, Postseismic, Mongolia, Viscoelastic Relaxation, Seismic Cycle
ABSTRACT:
The western Mongolia is a seismically active intracontinental region, with ongoing tectonic deformation and widespread seismicity related to the far-field effects of India-Eurasia collision. During the 20th century, four earthquakes with the magnitude larger than 8 occurred in the western Mongolia and its surrounding regions, providing a unique opportunity to study the geodynamics of intracontinental tectonic deformations. The 1957 magnitude 8.3 Gobi-Altai earthquake is one of the largest seismic events. The deformation pattern of rupture zone associated with this earthquake is complex, involving left-lateral strike-slip and reverse dip-slip faulting on several distinct geological structures in a 264 × 40 km wide zone. To understand the relationship between the observed postseismic surface deformation and the rheological structure of the upper lithosphere, Interferometric Synthetic Aperture Radar (InSAR) data are used to study the 1957 earthquake. Then we developed a postseismic model in a spherical, radially layered elastic-viscoelastic Earth based on InSAR results, and further analysed the dominant contribution to the surface deformation. This work is important for understanding not only the regional tectonics, but also the structure and dynamics of the lithosphere.
SAR data were acquired from the ERS1/2 and Envisat from 1996 to 2010. Using the Repeat Orbit Interferometry Package (ROI_PAC), 124 postseismic interferograms are produced on four adjacent tracks. By stacking these interferograms, the maximum InSAR line-of-sight deformation rate along the Gobi-Altai fault zone is obtained. The main results are as follows: (1) The maximum InSAR line-of-sight deformation velocity along this large fault zone is about 6 mm/yr; (2) The modelled surface deformation suggests that the viscoelastic relaxation is the most reasonable mechanism to explain the observed surface motion; (3) The optimal model cover the Gobi-Altai seismogenic thickness is 10 km; (4) The lower bound of Maxwell viscosity of lower crust and upper mantle is approximately 9 ×10¹⁹ Pa s, and the Maxwell relaxation time corresponding to this viscosity is 95.13 years.
* Corresponding author: E-mail address: [email protected] (B. Fu). 1. INTRODUCTION
Mongolia represents the northernmost expression of the India-Asia collision deformation, and is considered to be the most seismically active area of the last century (Baljinnyam et al., 1993). Six earthquakes with a magnitude of 7 or greater occurred in Mongolia. They are mainly concentrated on four major fault systems, which extend for several hundred kilometers. These strike-slip faults are potential fragile zones to come about large-magnitude earthquakes (Walker et al., 2007). The Mw 8.1 December 4th 1957 Gobi-Altai earthquake happened on the Bogd fault, it is an east-west trending left-lateral strike-slip fault (Kurushin et al., 1997).
The rheological structure of the lithosphere plays a crucial role in the earthquake cycle because the rheology and movements of the lower crust and upper mantle movement influence fault activity over time. It is well known that the rheological structure in northern and southern Tibet have significant differences (Molnar et al., 1973; Molnar and Tapponnier, 1975; Thatcher, 2003; England and Molnar, 2005), but the rheology of Mongolia investigations are still limited. Mongolia is regarded as remotely affected by India-Eurasia convergence. However, actual upper layer thickness and viscosity values for a particular region are commonly poorly-resolved; and only a few studies have investigated Mongolia rheology (Wright et al.,
viscosity between 1 ×10¹⁸ and 4×10¹⁸ Pa s, and a weaker lower crust (3×10¹⁶ to 2×10¹⁷) in the Baikal-Mongolia area (Vergnolle et al., 2003). They also claim that the 1905 Bolnay-Tsetserleg sequence and 1957 Bogd earthquake are the dominant contributions to the observed postseismic deformation.
Geodetic techniques such as InSAR and GPS provide valuable methods to quantify continental deformation on a large scale. These techniques have been used for studying postseismic deformation and inferring lithospheric rheology (e.g., Savage and Prescott, 1978; Thatcher et al., 1980; Hetland and Hager, 2006). It is now recognized that postseismic motion can be caused by some combination of any or all of the following processes: (1) transient aseismic fault slip (“afterslip”); (2) poroelastic relaxation due to fluid flow in the upper crust; (3) viscoelastic relaxation in the lower crust and/or upper mantle. Based on InSAR data, the kinematics of continental deformation can be simulated using computational and numerical rheological models, in order to constrain the viscosity of the continental lithosphere.
Gourmelen and Amelung (2005) combined InSAR with Global Positioning System (GPS) space geodetic techniques in order to measure late-stage postseismic transients’ deformations following large earthquakes in the Central Nevada seismic belt by averaging independent interferograms. Through model simulations, they infer that the deformation is caused by flow in the mantle underlying an elastic crust. The results of a comparable study on the 1957 Gobi-Altai historic earthquake that used a similar method (Gourmelen and Amelung, 2005) are reported in this paper. A ground velocity map along the Gobi-Altai fault in radar line-of-sight direction are generated. The study focuses on the transient deformation after 38 years following the 1957 Gobi-Altai earthquake Mw 8.1, and it provides constraints on the rheology of the crust and upper mantle in the Gobi-Altai region. By evaluating the transient deformation of the postseismic motion, the response of the lithosphere to large earthquakes may be evaluated. This research aims to: (1) develop an InSAR dataset of postseismic deformation four decades after the 1957 earthquake, then derive a postseismic model in a spherical, radially layered elastic-viscoelastic Earth based on InSAR results; and (2) constrain the crustal viscosity in the lower crust and upper mantle using numerical modelling (VISCO1D) for this area; and (3) analyse the dominate contribution to the surface deformation. Studying this earthquake in western Mongolia is not only important for understanding regional tectonics, but also for understanding the structure and dynamics of the lithosphere (e.g., Chen et al., 2004; Elliott et al., 2010).
2. STUDY AREA AND DATA
2.1 Study area
The 1957 December 4 Gobi-Altai Mw8.1 earthquake is one of the great earthquakes to have occurred anywhere in the world. This event locates in the southwest of Mongolia, which is a NNE-SSW compression zone due to the India-Asia collision (Tapponnier and Molnar 1979; Vassallo et al., 2007). The deformation is a primary left-lateral strike-slip with north-south shortening along the east-trending Gobi-Altai mountain range. East-west shortening and reverse faulting also occurs in this area and was associated with the simultaneous rupture of several faults, such as Dalan Turuu, Hetsuu forebergs, Gurvan Bulag thrust and Toromhon Overthrust (Kurushin et al., 1997). The Gobi-Altai region provides suitable conditions for remote
sensing techniques such as Interferometric Synthetic Aperture Radar (InSAR) because of the arid climate, sparse vegetation and limited human modification of the surface (e.g., agriculture). These natural conditions also preserve the surface rupture of the 1957 earthquake for optical observation.
Figure 1. Main tectonic structures in Asia (blue lines). Red rectangular is the study area Gobi-Altai fault.
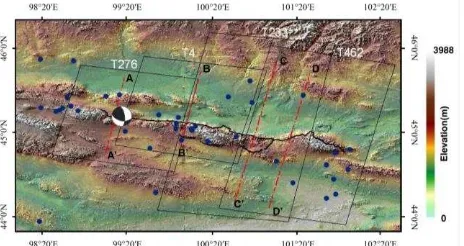
Figure 2. Shaded relief topography of the Gobi-Altai Fault in south Mongolia. DEM is 90 m SRTM. Fault trace is shown in thick black line, and focal mechanism is taken from Bayasgalan et al. (1999). Dark blue dots mark locations of earthquakes with Mw > 3 (from USGS and ANSS catalogue between 1957 and 2011). Numbers above black boxes mean SAR tracks. A-A’, B -B’, C-C’, D-D’ denote locations of displacement profiles shown in Figure 7.
2.2 Data
orbits are used in processing to eliminate orbital contributions. Coherence is excellent over the four tracks, probably due to the sparse vegetation and the arid climate. Even though the atmospheric noise level is not very high, for postseismic studies where the surface deformation is small, it can have an enormous impact on the interpretation of results. In addition, the Gobi-Altai fault lies along the edge of mountains, which gives rise to topography-correlated noise in the interferograms (Ryder et al., 2014).
3. METHODOLOGY
3.1 Landsat images
Remote sensing has been used in recent decades for mapping faults in different parts of the world. Remote sensing data allow the detection of structural features and offer opportunities for improving mapping and identifying the areas that are likely to be locations of earthquakes. Major fault traces were identified in Mongolia, the Tian Shan and the Himalaya (Tapponnier and Molnar, 1979) by combining satellite images and mapping active geomorphic features. In this study, digital image processing and visual interpretation were used to delineate geological lineaments in this area. Two Landsat 7 ETM+ images (Path: 134, 135 Row: 29) were used in this study. They were acquired on 20/10/2000 and 20/03/2001 respectively (NASA Landsat Program).
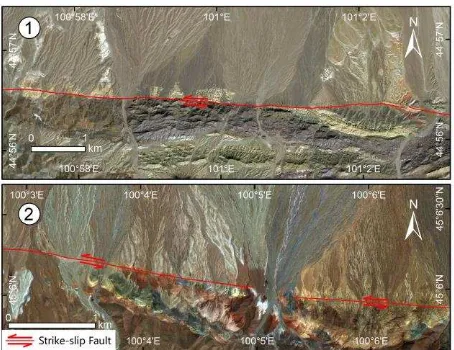
Figure 3. This false colour image uses Landsat ETM+ 7 (shortwave infrared) for red, band 4 (near infrared) for green, and band 1 (blue) for blue. Simplified tectonic map of Gobi-Altai fault (modified after Vassallo et al., 2007). Based on Landsat ETM+ 7 data provided by the NASA Landsat Program, 2000. The two blue boxes are typical sites shows in Figure 4.
Figure 4. The two typical sites for the strike-slip fault.
Landsat 7 ETM+ images with scene size (185185 km), pixel resolution 30 m were used in the combination of 741 (RGB) as the most suitable for defining the fault (Sevki et al., 2009). The ENVI 4.5 (Environment for Visualizing Images) software was
used to stack the three bands of the Landsat images. As can be seen in the Landsat image (Figure 3), geomorphic features can be traced over a length of approximately 270 km. Complex alluvial fan and splay fault traces indicate the position of the fault rupture. The correlation between five main fault segments with the Landsat image can be considered in five parts: (1) the main left-lateral strike-slip components, marked in red line with two opposite arrows along the Bogd fault on the Landsat image; (2) the Toromhon Overthrust and Tsagaan Ovoo-Tevsh uul reverse section, located at the middle bend of the main fault; (3) the Gurvan Bulag thrust on the south side of the Ih Bogd mountains; (4) the Ölziyt uul thrust fault dipping to north; (5) a short left-lateral strike slip fault on the summit of the plateau.
3.2 Interferometric processing of SAR data
Space-borne Interferometric Synthetic Aperture Radar (InSAR, also abbreviated as IFSAR or ISAR) is an advanced geodetic tool. SAR data have advantages including near global coverage and all-weather, day-night capability. This geodetic technique calculates the interference pattern caused by the change in phase between two SAR images acquired by spaceborne synthetic aperture radar at two distinct times on a pixel-by-pixel basis (Massonnet and Feigl, 1998). The resulting image, called an interferogram, is a map that records the variation in distance between the ground and the radar source during the time interval between the two observations. The direction between radar and the surface of Earth is usually referred to as line-of-sight direction.
Figure 5. Postseismic interferogram rate maps on four tracks shows separately. Colour scale is line-of-sight velocity in cm/yr. Black line shows 18-segment fault trace modified from fieldwork (Kurushin et al., 1997). Red line A-A’, B-B’, C-C’, D-D’ denote locations of displacement profiles shown in Figure 7 a,b,c,d, a’,b’,c’,d’, and also show the elevation plot at the right side y axis. Positive range change refers to movement away from the satellite, negative range change refers to movement toward the satellite.
Therefore, InSAR provides highly detailed images of the amount of movement of the ground relative to a satellite. This technique is very useful for monitoring ground movements because of its exceptional spatial resolution (10 m) for C-band SAR data, and high measurement precision in millimetre.
a
c d
In order to increase the signal-to-noise ratio of the surface deformation and identify any late stage postseismic signal, stacking of interferograms was carried out (Sandwell and Sichoix, 2000). The result shown in Figure 5 presents the average rate of motion relative to the satellite in the line-of-sight direction. In this study, some interferograms with obvious contributions from atmospheric and topographic effects were excluded. These kinds of noise contaminate the final result in the stacking process. Additionally, interferograms with low coherence and disconnected phase were omitted.
In the process of interferogram processing, some individual patches can have k2π offsets (k is integer), so tie-point -- an unwrapping approach is used to manually chose positions and unwrap them based on a branch-cut method (ROI-PAC classic unwrapper) supported by Goldstein et al. (1988). The stacked result was compared with the output of viscoelastic relaxation, interseismic and afterslip models respectively. Running a range of viscoelastic relaxation, interseismic and afterslip models, this study trying to find the optimal explanation by calculating the minimum misfit between observations and models. Furthermore, understanding what caused the surface movement after the main shock.
As can be seen in Figure 5, the descending InSAR rate maps show average line-of-sight velocities from 1995 to 2010. A distinct broad blue-to-red transition can be seen across the fault, as expected for a long left-lateral strike-slip fault, which correspond to the north side of the fault move away from the satellite and south side of the fault move towards the satellite. On Tracks 4 and 233, the pattern of descending line of sight velocity consists of a lobe of positive range change to the north of the fault and a lobe of negative range change on the south of the fault, which is correspond to a left-lateral strike-slip mechanism.
But due to the complex landscape, several thrust and reverse rupture states near to the main Bogd fault. Assuming the north side Dalan Turuu thrust moves up, the InSAR rate map red signal will decrease in this part because the vertical movement counteract the phase due to horizontal movement. On the contrary, if the active reverse components locate at the south side of the Gobi-Altai fault, these surface displacement rates will increase the negative range that are considered to be part of the left-lateral movement. The peak relative displacement occurs in the near field covered by Track 4 and Track 233 (at a distance of ~8 km on north side of the fault, ~ 25 km on south side of the fault), with a maximum of 6 mm/yr range change from peak-to-trough (Track 4 in Figure 5). This result is not very confident because the same tectonic signal does not show on overlap regions in both Track 4 and Track 233.
Compared to ascending tracks, descending tracks observe the deformation parallel to the fault, which is advantageous for measuring surface displacement. In addition, only several ascending scenes were available, with limited time span, so these were not used in this study.
4. MODELLING
Earthquake-induced stress changes will trigger ductile flow in the lower crust and upper mantle that can lead to transient deformation at the Earth’s surface. The viscosity in the lower crust or upper mantle controls the time constant of stress relaxation. Viscoelastic models of earthquakes can be restricted to a combination of elastic and viscous elements. For various
linear viscoelastic systems, different combinations of elastic and viscous elements can be easily generated based on the principle functions of rigidity and viscosity. A Maxwell material can be represented as a spring and dashpot in series as shown in Ryder (2006). The total strain rate is the sum of the strain rate in the spring and the dashpot. However, the force requires that the stress must be the same in each element (Segall et al., 2000).
4.1 Viscoelastic Relaxation
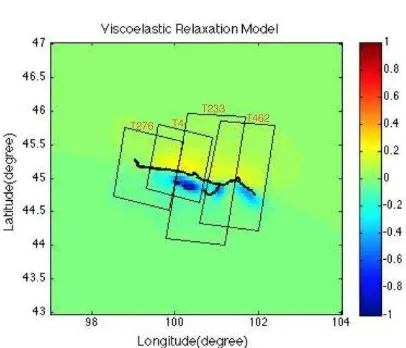
Figure 6. Optimal viscoelastic relaxation model (with upper layer thickness 10 km, viscosity 9×10¹⁹ Pa s) for the Gobi-Altai fault. Velocity components predicted from VISCO1D viscoelastic relaxation model. Thick black line marks the fault trace. T276, T4, T233 and T462 refer to SAR tracks 276, 4, 233 and 462, marked by thin black line boxes. Colour scale shows line-of-sight deformation rate in cm/yr.
a a’
b
c c’
Figure 7. Velocity profile plots across the main strike slip fault along A-A’, B-B’, C-C’, D-D’ (lines shown in Figure 2). The black dots show the line-of-sight displacement rates (cm/yr) from the InSAR data, and the colored lines show the different models corresponding to increasing upper layer thickness (10 km, 15 km, 20 km, 30 km) and viscosity (1×10²⁰ Pa s, 1×10²¹ Pa s, 1×10²² Pa s, 1×10²³ Pa s) respectively. The best fitting viscoelastic relaxation model is for H = 10 km with 1×10²⁰ Pa s viscosity, always shown by the red line of the model profiles. The second y-axis at the right side shows the elevation (m), the dark blue line in the profile displays the elevation plot.
4.2 VISCO1D
In order to investigate whether or not a simple viscoelastic layered model can replicate the observed movements, VISCO1D (Pollitz, 1992) code was used. VISCO1D uses a spherically stratified elastic-viscoelastic Earth model and computes the internal or surface displacements generated by an earthquake in a user-specified period. In this model, surface deformation is controlled by three sets of parameters: (1) the faults parameters (strike, dip, slip, rake, length, depth of upper and lower fault edges, and the latitude and longitude of one fault corner); (2) the relative thickness of the upper (elastic) crust layer and the lower (viscoelastic) layer, and; (3) the viscosity of the lower crust and upper mantle.
In the viscoelastic relaxation model, the chief Gobi-Altai fault includes 18 segments with various parameters based on Kurushin et al. (1997) and his colleague’s field work. Due to the complex structure of the whole fault, the detailed descriptions of the fault segments were incorporated in the viscoelastic relaxation model to simulate the surface displacement using VISCO1D. In order to determine the elastic thickness of the crust and the viscosity of the underlying substance, a two-layer Earth model consisting of an elastic plate overlying a viscoelastic half-space was constructed. According to Wright et al. (2013), the estimated seismogenic thickness the postseismic deformation, and each fault segment represents one pattern of relaxation with its own decay time and spatial deformation pattern. Cumulative line-of-sight displacements since 1996 to 2010 were constructed in VISCO1D. When comparing to the InSAR rate maps, the accumulated displacements are then divided by the corresponding time interval.
Whilst a three-layer model with different viscosities for the upper mantle and lower crust would be more satisfactory because the low signal-to-noise ratio in the rate maps would
make it difficult to resolve variations in viscosity with depth. But this study only concentrate on the Maxwell body rheology.
The root-mean-square (rms) misfit between the InSAR rate map and model is calculated according to
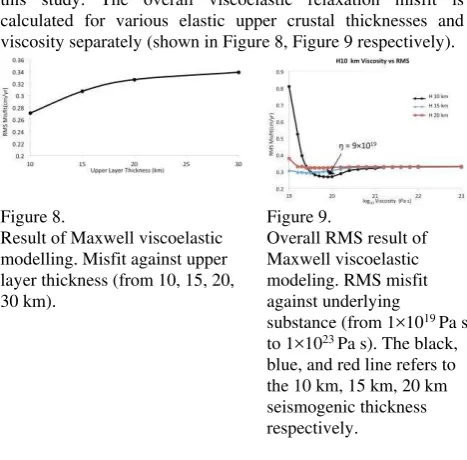
2 ground, and di, mi are the line-of-sight displacements for the ith point on the surface from the InSAR observation rate map and viscoelastic relaxation displacement model, respectively (Ryder et al., 2007). Root-mean-square misfit calculations method have been used when searching for optimal viscoelastic models in this study. The overall viscoelastic relaxation misfit is calculated for various elastic upper crustal thicknesses and viscosity separately (shown in Figure 8, Figure 9 respectively).Figure 8.
5.1 Seismogenic thickness and effective elastic thickness in Gobi-Altai region
Wright et al., (2013) conclude that there is no clear relationship between seismogenic thickness and elastic thicknesses, for seismically active regions globally. Generally, the elastic thicknesses from Bouguer gravity are systematically larger than the geodetic seismogenic thicknesses (Wight et al., 2013). The geodetic observations may be relevant to weaker areas, and localized mechanisms can also modify the local rheology. From thermobarometric and petrologic analysis of mantle and lower crustal xenoliths, the crust-mantle boundary beneath the Gobi-Altai region in southwest Mongolia is located at a depth of 45 km (Ionov et al., 1998).
Both the effective elastic thickness and seismogenic thickness reflect the lithosphere strength of the upper crust. The effective strength of the continental lithosphere is in the seismogenic crust. This study using InSAR rate map and viscoelastic modelling constrain the seismogenic thickness of Gobi-Altai. Most of continental earthquakes occurred in the lower crust at depths less than 20 km, which can be defined as seismogenic crust (Wright et al., 2013). Bayasgalan et al. (2005) determine 10 earthquake centroid depths by investigating P and SH waveforms, and claim that the seismogenic thickness (Ts) within Mongolia is less than 20 km. This conclusion is consistent with this study. Through searching for best fitting viscoelastic relaxation models at various elastic upper layer
thicknesses (Figure 8), the minimum misfit model was that the seismogenic thickness is 10 km in Gobi-Altai region. Bayasgalan et al. (2005) also constrain the effective elastic thickness (Te) in central Mongolia is < 10 km, and infer the Gobi-Altai range may be a little greater but less than 20 km. Using free-air gravity profile across the Valley of Lakes in the Gobi-Altai to find the minimum misfit in the Gobi-Altai region, the result shows the effective elastic thickness is 10 km. The spectral analysis of admittance presents an average effective elastic thickness of < 10 km over the broad region (Bayasgalan et al., 2005). The solid gravity analysis confirms that Te is comparable to Ts in Gobi-Altai region. This conclusion is in agreement with Maggi et al. (2000).
5.2 Viscosity
A number of postseismic studies identify some general patterns for lower crust or upper mantle rheology. Wight et al., (2013) found 49 studies which postseismic observations have been made on continental earthquakes, and conclude the range of Maxwell viscosities across all studies between 1×10¹⁷ and 7×10¹⁹ Pa s. For the standard linear solid and Burgers viscoelastic modeling, the range is 1×10¹⁷ to 2×10²⁰ Pa s (Wright et al., 2013).
The late-stage postseismic investigation of the Gobi-Altai region suggests a range of viscosities from 1×10¹⁶ to 1×10¹⁹ Pa s (Barbot et al., 2008; Pollitz, 2003; Vergnolle et al., 2003). Vergnolle et al. (2003), using GPS measurements, found an upper mantle viscosity between 1×10¹⁸ and 4×10¹⁸ Pa s. When they test various mantle viscosities beneath Mongolia, they found that both a high viscosity model (5×10²⁰< ηm< 1×10²¹ Pa s) (ηm refers to the viscosity in the mantle) and a low-viscosity model (1×10¹⁸<ηm < 4×10¹⁸ Pa s) fit the GPS data. Their statistical tests slightly favor the low-viscosity model in their study, and the low viscosity value is in agreement with this study 9×10¹⁹ Pa s. This viscosity is also consistent with other strike-slip fault studies in Tibet Plateau. For example, Ryder et al. (2014) find the lower crust has viscosity 6-10×1019 Pa s under the Beng Co strike-slip fault. Wen et al. (2012) exploit the best fitting viscosity for the mid-to-lower crust of 2-5×10¹⁹ Pa s along the western part of the Kunlun fault. Barbot et al. (2008) constrain a lower bound viscosity on Altai fault of 1019 Pa s. Calais et al. (2002) use GPS method to study the readjustment after Mw 8.4 1905 Bolnay earthquake, and assumed a lower crust viscosity of 3×10¹⁸ Pa s. Gourmelen and Amelung (2005) using a two-layer model find a lower bound of the underlying substrate of 1-10 ×1018 Pa s on Central Nevada Seismic Belt. The viscosity values of these studies give confidence to the conclusion that the viscosity under Gobi-Altai fault is < 9 ×10¹⁹ Pa s.
On the contrary, regional studies (Stosch et al., 1995; Kopylova et al., 1995; Ionov et al., 1998) indicate that the lower crust may be composed of diabase, and extrapolation of the geotherm of Ionov et al. (1998) combined with application of flow laws for wet diopside or dry diabase (Mackwell et al., 1998) supports the model of a relatively strong lower crust.
5.3 Analysis of viscoelastic relaxation
Postseismic motion associated with large strike-slip fault may be the result of viscoelastic relaxation, afterslip or a mixture of these two end-member models (Wright et al., 2013; Wen et al., 2012). The different mechanisms at depth also display very similar displacement fields at the surface (e.g., Hearn, 2003).
How to distinguish between afterslip and viscoelastic relaxation is a major challenge for InSAR studies. The observed and modelled line-of-sight InSAR rate maps are shown in Figures 5 and 6 respectively. For special fault and satellite geometries, the afterslip and viscoelastic relaxation can be separated from each other. For example, after the 1999 Hector Mine earthquake, the most important cause of surface displacement is inferred to be viscoelastic relaxation (Pollitz et al., 2001). For the present study, even if the published GPS data (Calais et al., 2003) cover the Gobi-Altai fault, the GPS stations located on both sides of Gobi-Altai fault are sparse. Therefore, it is impossible to identify the actual mechanism responsible for the deformation along the Gobi-Altai fault. In addition, the complex surface ruptures in this region consist of left-lateral strike-slip movement and several thrust faults, which make the interpretation of InSAR velocity map difficult. The observed surface dislocation may be a mixture of left-lateral motion and thrust related uplift.
From the perspective of timescale, investigations of afterslip motions usually measure a decay on timescales of months to years (Savage et al., 2005). Ryder et al. (2014) claim that the observed should be solely contribute to the viscoelastic relaxation across Beng Co fault because the SAR data covers fifth and sixth postseismic decades. In this study, the InSAR rate map (from 1995 to 2010) rule out the afterslip still occurs on Gobi-Altai fault due to the time scale.
Vergnolle et al. (2003) determined the shear zone velocity associated with the low-viscosity model (3 to 5.5 mm/yr), and it is more consistent with the accumulated slip rate on active faults in Mongolia (Ritz et al., 1995, 2003). The amplitude of the line of sight velocities measured right across the Gobi-Altai fault is ~6 mm/yr, equivalent to a left-lateral rate of 15.35 mm/yr. This slip rate is larger than the results measured by dating offset alluvial fans along profiles at depth (Vassallo et al., 2005). Vassallo et al., (2005) measure the slip rates along the Bogd strike-slip fault over the Upper Pleistocene-Holocene is 0.95±0.29 mm/yr. Rizza et al. (2011) based on dating 10Be data measuring the left-lateral slip rate is ~1mm/yr. Calais et al. (2002) using GPS data from 1997 to 2000 period measure the surface velocities can be 4 mm/yr. Calais et al. (2002) also run the VISCO1D modelling and find the postseismic effects to the GPS velocities presented is less than 2 mm/yr for Mongolian sites, and on the Baikal sites are less than 1 mm/yr. Calais et al. (2002) detect that the Bolnay postseismic postseismic deformation may still contribute up to 7 mm/yr in western Mongolia. Considering the large slip rate differences between this study and previous investigations, the conclusion can be made that the observed InSAR surface deformation may reflect a late-stage postseismic deformation mainly contribute by viscoelastic relaxation. However, other studies may measure a steady interseismic deformation.
6. CONCLUSION
6.1 Postseismic study
seismogenic thickness (10 km) with the effective elastic thickness (10 km) obtained from Bayasgalan et al. (2005), the lithospheric thickness in the Gobi-Altai region is consistent with the perspective of seismic and gravity.
Using a simple two-layer model with Maxwell body rheology, under a lower bound on the upper layer thickness of the crust of 10 km circumstance, a viscosity of the lower crust and upper mantle of 9×10¹⁹ Pa s was found. The Maxwell relaxation time corresponding to this viscosity is 95.13 years. The viscoelastic relaxation happened in the lower crust and upper mantle.
After comparing the viscoelastic relaxation, afterslip, and interseismic models by searching the minimum misfit value, the InSAR observed postseismic deformation mainly record the viscoelastic relaxation. The final part of Gobi-Altai fault is not well studied. The InSAR velocity map contains highly topographic noise on Track 462 (Figure 5d). All of analysis is established on review other papers. Gobi-Altai left-lateral rupture have initiated with rupture of the Tsagaaan nuruu thrust fault at the western of the Bogd fault and then propagated to the east as a left-lateral strike-slip fault. How the thrust segments at the south end of the Gobi-Altai fault interact with the strike-slip segments in depth still an open question.
ACKNOWLEDGEMENTS
This work is a master thesis in University of Liverpool, Dr. Isabelle Ryder and Prof. Andreas Rietbrock are thanked for being helpful and constructive project supervisors. I thank Dr. Hua Wang to help me reprocess the InSAR data using pi-rate software.
REFERENCES
Baljinnyam, I., et al., 1993. Ruptures of major earthquakes and active deformation in Mongolia and its surroundings. Geological Society of America, Colorado, p. 62.
Barbot, S., Hamiel, Y., Fialko, Y. 2008. Space geodetic investigation of the coseismic and postseismic deformation due to the 2003 m w 7.2 Altai earthquake: implications for the local lithospheric rheology. Journal of Geophysical Research Atmospheres, 113(B3), pp. 133-144.
Bayasgalan, A., Jackson, J., McKenzie, D., 2005. Lithosphere rheology and active tectonics in Mongolia: relations between earthquake source parameters, gravity and GPS measurements.
Geophysical Journal International, 163(3), pp. 1151-1179. Calais, E., Vergnolle, M., Déverchère, J., San'Kov, V., Lukhnev, A., Amarjargal, S. 2002. Are post-seismic effects of the m = 8.4 bolnay earthquake (1905 july 23) still influencing GPS velocities in the Mongolia—Baikal area? Geophysical Journal International, 149(1), pp. 157-168.
Calais, E., Vergnolle, M., San'kov, V., Lukhnev, Andrei., Miroshnitchenko, A., Amarjargal, S., Déverchère, J., 2003. GPS measurements of crustal deformation in the Baikal-Mongolia area (1994-2002): Implications for current kinematics of Asia.
Journal of Geophysical Research, 108(B10), p. 2501.
Chen, Q., Freymueller, J. T., Yang, Z., 2004. Spatially variable extension in southern Tibet based on GPS measurements.
Journal of Geophysical Research: Solid Earth, 109(B9), pp. 271-297.
Elliott, J. R., Walters, R. J., England, P. C., Jackson, J. A., Li, Z., Parsons, B., 2010. Extension on the Tibetan plateau: recent normal faulting measured by InSAR and body wave seismology.
Geophysics Journal International, 183(2), pp. 503-535. England P., Molnar, P., 2005. Late Quaternary to decadal velocity fields in Asia. Journal of Geophysical Research: Solid Earth, 110(B12), p. B12401.
Goldstein, R. M., Zebker, H. A., Werner, C. L., 1988. Satellite radar interferometry: Two-dimensional phase unwrapping.
Radio Science, 23(4), pp. 713-720.
Gourmelen, N., Amelung, F., 2005. Postseismic mantle relaxation in the central Nevada seismic belt. Science, 310(5753), pp. 1473-1476.
Hearn, E. H., 2003. What can GPS data tell us about the dynamics of postseismic deformation?. Geophysical Journal International, 155(3), pp. 753-777.
Hetland, E., Hager, B., 2006. The effects of rheological layering on post-seismic deformation. Geophysical Journal International, 166(1), pp. 277-292.
Ionov, D. A., O'Reilly, S. Y., Griffin, W. L. 1998. A geotherm and lithospheric section for central Mongolia (Tariat region).
Mantle dynamics and plate interactions in East Asia, 127-153. Kopylova, M. G., O'Reilly, S. Y., Genshaft, Y. S. 1995. Thermal state of the lithosphere beneath Central Mongolia: evidence from deep-seated xenoliths from the Shavaryn-Saram volcanic centre in the Tariat depression, Hangai, Mongolia.
Lithos, 36(3-4), pp. 243-255.
Kurushin, R. A., Bayasgalan, A., Ölziybat, M., Enkhtuvshin, B.,Molnar, P., Bayarsayhan, C., Hudnut, K.W., Lin, J., 1997.
The surface rupture of the 1957 Gobi-Altay, Mongolia, earthquake. Geological Society of America, Colorado, p320. Mackwell, S. J., Zimmerman, M. E., Kohlstedt, D. L. 1998. High‐temperature deformation of dry diabase with application to tectonics on Venus. Journal of Geophysical Research: Solid Earth, 103(B1), pp. 975-984.
Maggi, A., Jackson, J. A., Mckenzie, D., Priestley, K. 2000. Earthquake focal depths, effective elastic thickness, and the strength of the continental lithosphere. Geology, 28(6), pp. 495-498.
Massonnet, D., Feigl, K., 1998. Radar interferometry and its application to changes in the earth's surface. Reviews of Geophysics, 36(4), pp. 441-500.
Molnar, P., Fitch, T. J., and Wu, F. T., 1973. Fault plane solutions of shallow earthquakes and contemporary tectonics in Asia. Earth and Planetary Science Letters, 19(2), pp. 101-112. Molnar, P., Tapponnier, P., 1975. Cenozoic Tectonics of Asia: Effects of a continental collision. Science, 189(4201), pp. 419-426.
Pollitz, F. F., 2001. Viscoelastic shear zone model of a strike-slip earthquake cycle. Journal of Geophysical Research: Atmospheres, 106(B11), pp. 26541-26560.
Pollitz, F. F., 2003. Transient rheology of the uppermost mantle beneath the Mojave Desert, California. Earth and Planetary Science Letters, 215(1), pp. 89-104.
Ritz, J. F., Brown, E. T., Bourle`s, D. L., Philip, H., Schlupp, A., Raisbeck, G. M., Yiou, F., Enkhtuvshin, B., 1995. Slip rates along active faults estimated with cosmic-ray-exposure dates: Application to the Bogd fault, Gobi-Altay, Mongolia, Geology, 23(11), 1019-1022.
Ritz, J. F., et al., 2003. Late Pleistocene to Holocene slip rates for the Gurvan Bulag thrust fault (Gobi-Altay, Mongolia) estimated with 10Be dates, Journal of Geophysical Research, 108(B3), p. 2162.
Rizza, M., Ritz, J. F., Braucher, R., Vassallo, R., Prentice, C., Mahan, S., Demberel, S. 2011. Slip rate and slip magnitudes of past earthquakes along the Bogd left-lateral strike-slip fault (Mongolia). Geophysical Journal International, 186(3), pp. 897-927.
Ryder, I., 2006. Elastic and Viscoelastic Modelling of Postseismic Motion and Fault Structures. Ph.D. thesis. Doctor of Philosophy, University of Oxford
Ryder, I., Parsons, B., Wright, T. J., Funning, G. J. 2007. Post-seismic motion following the 1997 Manyi (Tibet) earthquake: InSAR observations and modelling. AGU Fall Meeting, 169, pp.1009-1027.
Ryder, I., Wang, H., Bie, L., Rietbrock, A., 2014. Geodetic imaging of late postseismic lower crustal flow in Tibet, Earth & Planetary Science Letters, 404, pp. 136-143.
Sandwell, D. T. Sichoix, L., 2000. Topographic Phase Recovery from Stacked ERS Interferometry and a Low Resolution Digital Elevation Model, Journal of Geophysical Research, 105(B12), pp. 28211-28222.
Savage, J. C., Prescott, W. H., 1978. Asthenosphere readjustment and the earthquake cycle, Journal of Geophysical Research, 83(83), pp. 3369-3376.
Savage, J. C., Svarc, J. L., Yu, S. B., 2005. Postseismic relaxation and transient creep. Journal of Geophysical Research: Solid Earth,110(B11) p. B11402.
Segall, P., Bürgmann, R., Matthews, M. 2000. Time‐ dependent triggered afterslip following the 1989 Loma Prieta earthquake. Journal of Geophysical Research: Solid Earth, 105(B3), pp. 5615-5634.
Sevkikavar, K., Tatar, O., Piper, J., Kocbulut, F., Levent, M. B., 2009. Determination of neotectonic features of the Karasu Basin (SE Turkey) and their relationship with Quaternary volcanic activity using Landsat ETM+ imagery. International Journal of Remote Sensing, 30(17), pp. 4507-4524.
Stosch, H. G., Ionov, D. A., Puchtel, I. S., Galer, S. J. G., & Sharpouri, A. 1995. Lower crustal xenoliths from Mongolia and their bearing on the nature of the deep crust beneath central Asia. Lithos, 36(3-4), pp. 227-242.
Tapponnier, P., Molnar, P. 1979. Active faulting and Cenozoic tectonics of the Tien Shan, Mongolia, and Baykal regions.
Journal of Geophysical Research: Solid Earth, 84(B7), pp. 3425-3459.
Thatcher, W., 2003. GPS constraints on the kinematics of continental deformation. International Geology Review, 45(3), pp. 191-212.
Thatcher, W., Matsuda, T., Kato, T., Rundle, J. B., 1980. Lithospheric loading by the 1896 Riku-u earthquake, northern Japan: Implications for plate flexure and asthenospheric rheology. Journal of Geophysical Research: Atmospheres, 85(85) pp. 6429-6435.
Thatcher, W., Rundle, J.B., 1984. A viscoelastic coupling model for the cyclic deformation due to periodically repeated earthquakes at subduction zones. Journal of Geophysical Research: Solid Earth, 89(B9), 7631-7640.
Vassallo, R., et al., 2007. Transpressional tectonics and stream terraces of the Gobi-Altay, Mongolia. Tectonics, 26(5) pp. 1-8. Vassallo, R., Ritz, J. F., Braucher, R., Carretier, S. 2005. Dating faulted alluvial fans with cosmogenic 10Be in the Gurvan Bogd mountain range (Gobi‐Altay, Mongolia): climatic and tectonic implications. Terra Nova, 17(3), pp. 278-285.
Vergnolle, M., Pollitz, F., Calais, E. 2003. Constraints on the viscosity of the continental crust and mantle from GPS measurements and postseismic deformation models in western mongolia. Journal of Geophysical Research Solid Earth, 108(B10), pp. 429-432.
Walker, R, Nissen, E, Molor, E, Bayasgalan, A., 2007. Reinterpretation of the active faulting in central Mongolia.
Geology 35(8), pp. 759-762.
Wen, Y., Li, Z., Xu, C., Ryder, I., Bürgmann, R. 2012. Postseismic motion after the 2001 mw 7.8 kokoxili earthquake in tibet observed by insar time series. Journal of Geophysical Research Solid Earth, 117(B8), p. B08405.