Public Infrastructure Availability on Development
Disparity
Siti Rohima
Department of Development Economics
Faculty of Economics, Universitas Sriwijaya, Indonesia
Tel: 62-822-3298-3388 E-mail: [email protected]
Saadah Yuliana
Department of Development Economics
Faculty of Economics, Universitas Sriwijaya, Indonesia
Tel: 62-812-7852-884 E-mail: [email protected]
Abdul Bashir
Department of Development Economics
Faculty of Economics, Sriwijaya University, Indonesia
Tel: 62-852-6859-9948 E-mail: [email protected]
Nazirwan Hafiz
Department of Development Economics
Faculty of Economics, Sriwijaya University, Indonesia
Tel: 62-896-8256-3970 E-mail: [email protected]
Received: October 12, 2017 Accepted: October 27, 2017
doi:10.5296/ber.v7i2.11983 URL: https://doi.org/10.5296/ber.v7i2.11983
Abstract
water on the development disparities of districts/cities in South Sumatera. This study using a quantitative approach. Technical analysis of using Williamson index and panel regression model. The results of the study found that public infrastructure such as electricity and water have negative sign and significant effect on development disparities districts/cities in South Sumatera. This means that an increase in the amount of electricity and water infrastructure can reduce development disparities. In contrast, road infrastructure has a positive effect on development disparities. It means that increasing road infrastructure increases development disparity in districts/cities in South Sumatera Province.
Keywords: Disparities of development, Infrastructure, Roads, Electricity, Water
JEL Classification: D60, H54, O18, Q52
1. Introduction
Regional autonomy policies to give the local authorities to explore the potential and source of revenue of funds for their respective regions. Likewise with the regional development is the first step to apply a regional authority in the autonomy (Fatile & Ejalonibu, 2015). Development is defined as a multidimensional process that involves a variety of fundamental changes in the social structure, social behaviour, and social institutions, in addition to the acceleration of economic growth, equitable distribution of income inequality, and poverty reduction (Todaro & Smith, 2006). Therefore, the purpose of the construction itself is to increase the economic welfare of the community. In improving people's welfare required increased economic growth and equitable distribution of income. However, rapid economic growth is not-balanced with equality, so will lead to region disparities (Lee et al, 2012; Feng, 2011).
The development disparity inter-regions is a common aspect of economic activity in a region. Basically, This disparity is caused by the difference in the natural resources and geography contained in each region (Bradshaw, 2006). As a result of this difference, the ability of the region to encourage the development process as well as different (Komarovskiy & Bondaruk, 2013). Moreover, the level of disparities inter-regions has been increasing, this whether raises the benefits of growth are being shared in an equitable manner. Rising regional inequalities have several repercussions for the economic and political stability in the country (Nagaraj et al., 2000).
Empirical evidence on the relationship between infrastructure and inequality is sparse, inconclusive, and largely anecdotal (Chatterjee & Turnovsky, 2012; Calderon & Serven, 2014). Infrastructure increases the access to productive opportunities and reduces production and transaction costs, which leads to industrial or agro-industrial development and raises the value of assets of the poor (Mopangga, 2011; Resosudarmo & Vidyattama, 2006). Which mean, infrastructure can reduce inequality?
returns in richer areas where private capital is already relatively abundant. This could be due to the complementary relationship between infrastructure, private capital, and human capital so will result in increasing income inequality. Proved infrastructure differences can explain polarised economic growth rates (Sahu et al, 2011). Just as there are studies that found a negative relationship between infrastructure development and inequality, there also exist studies that found the reverse to hold true (Brakman et al, 2002; Banerjee & Somanathan, 2007; Khandker & Koolwal, 2007).
South Sumatera province has the high economic growth, but still have development gaps. This is reflected in the GDRP of the district and city of South Sumatera Province is different. There are several regions of the city have GDRP growth rate relatively high, and there are some of the districts that have the low level of GDRP growth rate. Disparities between districts/cities in South Sumatera is quite high, as seen from the gap between districts/cities with the highest GDRP per capita and low GDRP per capita (BPS, 2015). Per capita income in South Sumatera Province is relatively higher than the per capita income district and cities in South Sumatera. GRDP per capita is highest in Musi Banyuasin and Palembang, while the lowest GDRP per capita in OKU Timur.
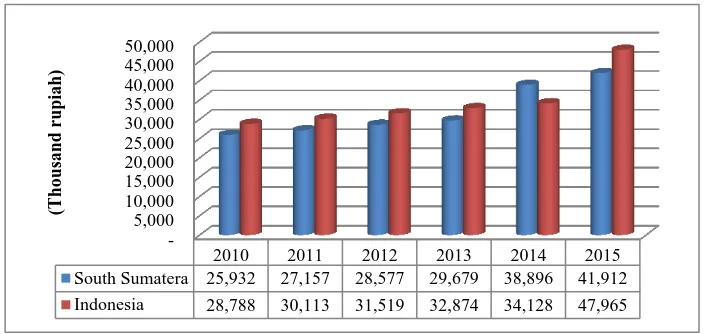
Figure 1. Per Capita Income of South Sumatera
Source: BPS, South Sumatra in Figures 2016 (processed)
During the period 2010-2015 the per capita income in South Sumatra province is likely to increase, but still lower than the national per capita income. If in 2010, the ratio of GDRP per capita South Sumatra Province to the National GDP amounted to 90.11%, and then in 2015 this ratio declined to 87.38% (Figure 1), means the economy is another area grew relatively faster than South Sumatra. This shows the influence of sector dominates the economy began to decline for the increase in per capita income in South Sumatera.
among other differences in per capita income levels and infrastructure in the region due to the lack of development spending in the region.
This study analyses the relationship between physical infrastructure and development inequality and determines the nature of the relationship and its impact on the district in South Sumatra. The major highlight of this study is to show that the impact of the availability of infrastructure development on inequality is a function of the increasing economic growth of a region. By evaluating the districts with different levels of development, this study is expected to find evidence of the impact of infrastructure development inequality in all different areas, not only to the type of infrastructure that considered, but also for the category of gross domestic regional product (GDRP). The next section presents the literature review. The third section presents the research method and model specifications in this study. The fourth section gives the estimation results of models and analysis of empirical result estimates of the implications. The last section concludes.
2. Literature Review
Chenery (1974) pointed out that the income disparity would be improved by the tricking effect and spillover effect when economic growth continues for a long period. Kuznets (1955) also argued that countries with low levels of development have relatively equal distributions of wealth. As a country develops, it acquires more capital, which leads to the owners of this capital having more wealth and income and introducing inequality. Eventually, through a variety of possible redistribution mechanisms such as trickle down effects and social welfare programs, more developed countries move back to lower levels of inequality.
Inequality within a country is not only against the people's income distribution but also happens to inter-regional development within the region. Jeffrey G. Williamson (1965) examined the relationship between regional disparities in levels of economic development. It was found that during the early stages of development, regional disparity is becoming larger and concentrated development in areas. Stage a more "mature", judging from economic growth, it appears the balance between the regions and the disparity is reduced significantly. Williamson Index to measure the inequality of development among regions. Williamson index coefficient is 0 < IW < 1, if Williamson index smaller or close to zero indicate that the smaller imbalance or otherwise more evenly and greater numbers indicate inequality widened. As for the factors of inequality of development among regions (Baransano et al, 2016), namely: (a) the difference in the content of the natural resources (b) differences in conditions demographics, (c) less smooth mobility goods and services, (c) the difference in concentration of economic activities area, (d) allocation of Inter-regional development fund.
The Indonesian government through Presidential Decree No. 42/2005 on the Committee for the Acceleration of Infrastructure Provision, such as: (1) transport infrastructure, including seaports, river or lake, airports, railways and train stations; (2) road infrastructure, including toll roads and toll bridges; (3) water infrastructure, including raw water bearer channel; (4) the water infrastructure that includes building the raw water collection, transmission networks, distribution networks, water treatment plants; (5) waste water infrastructure includes wastewater treatment plants, the collection network and the main network, and garbage facilities including transport and disposal; (6) telecommunications infrastructure, including telecommunications networks; (7) employment infrastructure, comprising the generation, transmission or distribution of electricity; and (8) oil and gas infrastructure comprising the processing, storage, transportation, transmission or distribution of oil and gas.
In addition, to the various channels through which infrastructure can impact inequality and help reduce it have been highlighted, amongst others, by Estache, (2003); Gannon & Liu (1997); Estache & Fay (1995); Jacoby (2000). Essentially, infrastructure benefits underdeveloped regions as disadvantaged individuals gain access to productive opportunities by connecting them to core economic activities. A reduction in production and transportation costs as a result of easier accessibility through roads has been a key determinant of income convergence for the poorest regions in Argentina and Brazil (Estache & Fay, 1995).
The strategy to increase economic growth, generally, will increase the economic growth and lifting guidelines public life, but can also produce a widening gap between the cities and rural areas. To reduce the gap, so it can be some strategies namely: (1) increase revenues each generation, (b) to improve the environment and basic infrastructure in rural areas, and (3) build the capacity and change in attitude (Park, 2009).
In addition, many research with a survey why infrastructure is very important in increasing economic growth and to evaluate the results of the empirical estimate the contribution of public capital and infrastructure for economic growth. The results of their research state that the impact of infrastructure investment on economic growth can produce quite a high rate of return (Lee et al, 2012; Easterly & Rebelo, 1993). The other research to investigate whether or not there is the policy change has increasing the economic growth rate permanently, and then to clarify whether investment in the information and telecommunications will increase the economic growth rate. The result of the study they find that the investment public infrastructure such as transport and telecommunication means consistently correlates of economic growth. The level of return on investment in the sector is an average of more than 50% (Easterly and Rebelo, 1993).
by Khandker & Koolwal (2007) found that expanding paved roads had a limited distributional impact on income in rural Bangladesh.
3. Research Methods
Research on the analysis of the availability of public infrastructure to development disparities of districts/city in South Sumatera province. This study using quantitative research methods. The study was conducted within the scope of 15 Districts/City in South Sumatera Province of the period 2007-2016. The data used in this research is secondary data from the Central Bureau of Statistics (BPS), and various other sources.
Income disparity in South Sumatra measured using Williamson index. Williamson Index is an index based on size deviation of per capita income and population of each region per capita national income (Sjafrizal, 2012). The index Williamson is one of the most frequently used index to see the disparities between regions. Williamson index formulated as follows:
IW =√∑ Yi − Y̅ . fi/N
Y̅ 1
Where: IW = Index Williamson;
Yi = The GDP per capita of the district/city to i;
Y = Per capita GRDP district/city;
fi = Total population of the district/city to i;
N = Total population of the district/city.
3.1 Model of Panel Regression
This study to determine whether the road infrastructure, electricity, and water have effect the development disparities in South Sumatera. In this study using the panel regression model, the value of the variable unit shows that infrastructure total (k) aggregated into the road (km), electricity (kwh) and water (m3). In the end, the research models used in accordance with the study variables are:
�� = � ��� , � ��, ��� � (2)
�����,� = � + � ����� �,�+ � �� � ���,�+ � ����� ��,� + ��,� (3)
4. Results and Discussion
Figure 2. The average of GDRP district/city in South Sumatera, 2007-2016.
Source: BPS, Statistics South Sumatera (processed)
Generally, Palembang has the first largest GDRP, and has the potential in the secondary and tertiary sectors, especially the manufacturing sector and sector of the hotel, restaurant, and trade and the second largest is Musi Banyuasin district, located in the trans-Sumatera, and has the potential of natural resources is largest, as the potential oil and gas mining in Musi Banyuasin to be the largest in South Sumatera, which puts as the source of gas in Sumatera. Other than that potential oil and gas mining in Musi Banyuasin reached more than 50% of total oil and gas potential in South Sumatera. While the region of lowest value of GDRP is Pagaralam city (Figure 2).
Figure 3. The share of GDRP district/city to GDRP total of South Sumatera, 2007-2016
Source: BPS, Statistics South Sumatera (processed)
As an economic centre in South Sumatera Province, Palembang share of GDRP is 31.84% of the economy of South Sumatera. Musi Banyuasin followed with a contribution of 15.87%. So generally the spread of the economy in South Sumatera has not been spread evenly across districts/cities. It is shown that half the economy in the province of South Sumatera comes from two directions, Palembang and Musi Banyuasin (Figure 3).
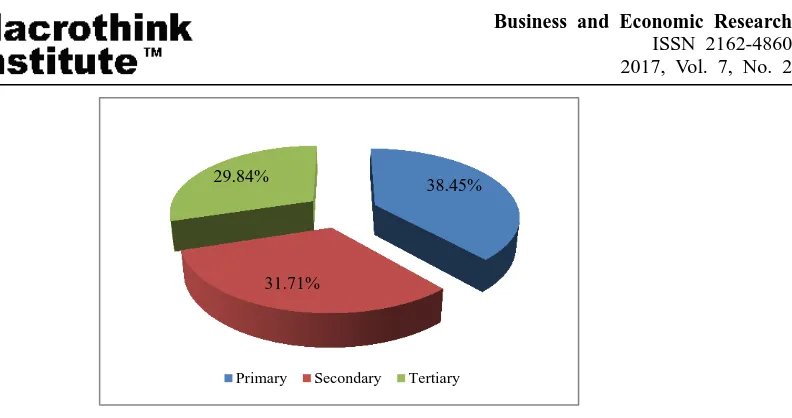
Figure 4. The economy of South Sumatera based on main sectors
Source: BPS, Statistics South Sumatera (processed)
By sector, the GDRP is the creation of value-added from every sector of the economy that in the area. Comparison value-added portion of each sector to GDRP of the area describe the structure of the local economy. Generally, the economic structure of South Sumatera still relies on primary sector. Evident from the percentage contribution of the primary sector value is 38.45% of GDRP of South Sumatera Province. The value of primary sector's contribution is high compared with other sectors, especially coming from all district/city i.e. the agriculture sector and mining and quarrying.
GDRP per capita district/city can be used to measure the level of economic welfare of a
region by dividing the value total of GDRP to population total in the region. This indicator
describes the average value-added created by society in a region as a result of the production
process. Generally, based on figure 5 most of region show income per capita has increased.
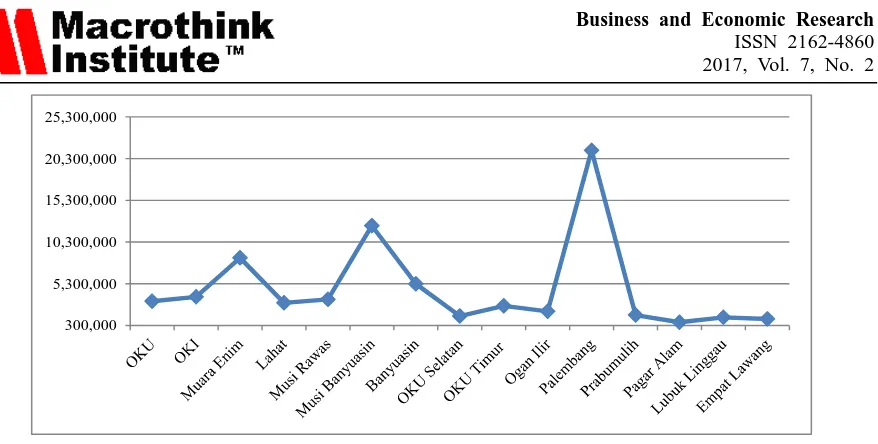
Figure 5. The average of GDRP per capita in district/city, South Sumatera, 2007-2016
Source: BPS, Statistics South Sumatera (processed)
In terms of per capita income, Musi Banyuasin in first place with the value of the average income per capita and always increase every year, the increase in per capita income caused by movements in the production of goods/services are delivered across the sector in Musi
38.45%
31.71% 29.84%
Primary Secondary Tertiary
Banyuasin and relatively large contribution of the oil and gas sector to the GRDP of the area. Compared with the city of Palembang in the next position. Fluctuations in the income per capita in Palembang within the past ten years illustrates the acceleration of development which tends massive. While the region has the lowest per capita income in 2016 is occupied by OKU Timur.
4.1 Population Growth
In general, the state of the population in the province of South Sumatera has not spread evenly across the region, where the population distribution among the districts/cities seem still pretty lame, so density to each district/city has not been evenly distributed.
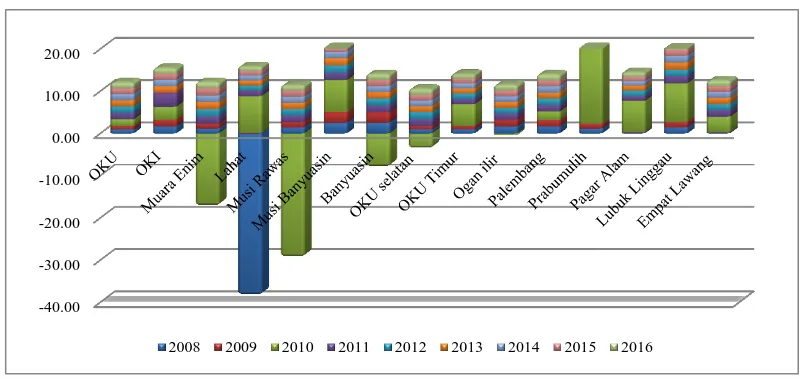
Judging from the rate of population growth among districts/cities in the last ten years is quite varied. The rate of growth of the district/city experienced the highest in the year 2007 to 2010 the growth rate illustrates the percentage even negative growth indicating a reduced number of people in the region such as the Lahat district, Muara Enim, Musi Rawas, Banyuasin and South OKU. In addition, Muara Enim, Lahat, Musi Rawas, and Banyuasin in 2007-2009 are likely to have high population levels and began to decline in the next year. This shows that population growth is not rapid and tends to be low, especially in new areas of expansion.
Figure 6. Population growth district/city in South Sumatera, 2007-2016
Source: BPS, Statistics South Sumatera (processed)
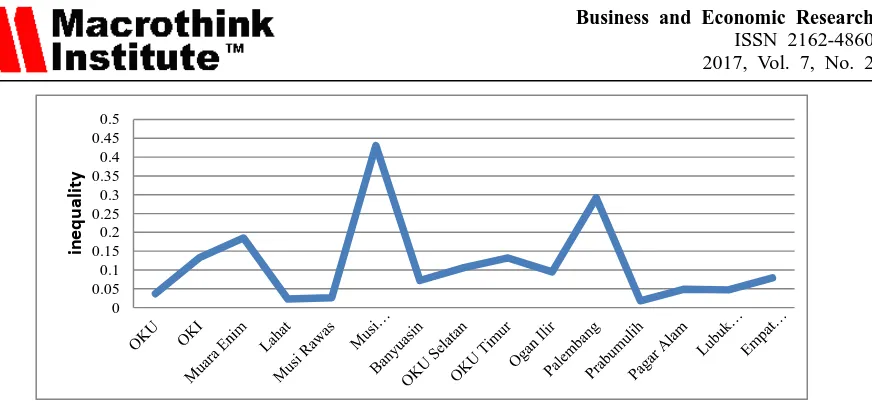
4.2 Disparities of Development
Disparities in development between districts/city in the province of South Sumatera measured by the index of inequality between regions are calculated by Williamson's theory. The results of calculations with Williamson index is indicated by numbers from 0 to 1 or 0 <IW <1.
-40.00 -30.00 -20.00 -10.00 0.00 10.00 20.00
Figure 7. The average size disparity of development district/city in South Sumatera, 2007-2016
Source: BPS, Statistics South Sumatera (processed)
Development disparities of district/city in South Sumatera province, based on figure 7 shows that the high of disparities occupied by Musi Banyuasin. This shows that the disparity of development in Musi Banyuasin higher than Palembang itself. Musi Banyuasin has the highest per capita income, but inequality in the region is relatively high compared to other districts/cities in the province of South Sumatera. This indicates that the distribution of income in Musi Banyuasin uneven. Mining and oil and gas sector itself, which is superior in the sector Banyuasin district has a capital intensive investment criteria, so that the additional capital income of a treasure greater than the percentage of revenue that comes from working, in other words, the sector is relatively small in terms of employment, while the regions with the lowest inequality value is Prabumulih.
4.3 Road Infrastructure
The road is important infrastructure to connect the area to another or from economic centre to another economic. Infrastructure becomes an important factor in the development of the region as well as the increased economic activity of society. The availability of adequate road infrastructure will be the distribution of goods and services become faster and more efficient in terms of cost and time, making it easier for investors in the attempt. The longer and better quality of a road, it will facilitate the distribution of goods and services, which in turn attract investment and increase the per capita income of a region.
0 0.05 0.1 0.15 0.2 0.25 0.3 0.35 0.4 0.45 0.5
in
e
q
u
a
li
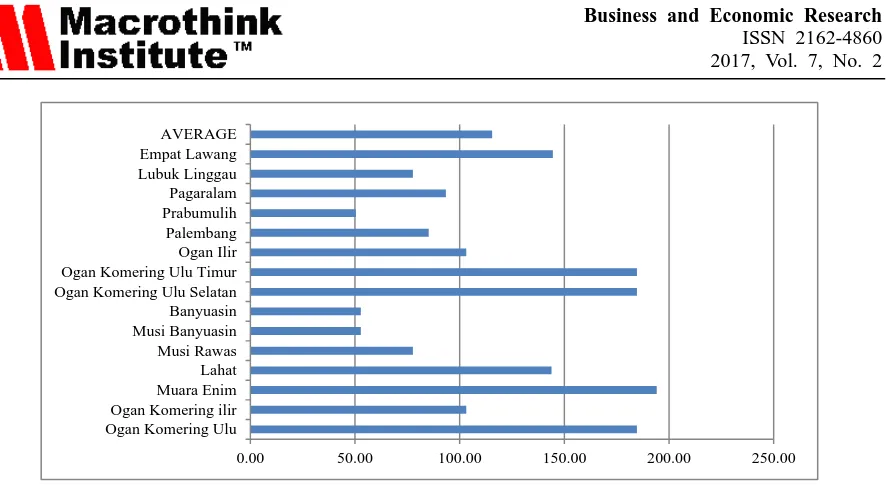
Figure 8. The average road length of district/city in South Sumatera, 2007-2016
Source: BPS, Statistics South Sumatera (processed)
The roads length available in each district/city of South Sumatera is still not evenly distributed. Seen in figure 8, shows that more than half of the district/city in South Sumatera has the road length below average. However, the longest of road length is owned by Muara Enim district. The shortest of road length is occupied by Prabumulih city of 50.35 km. Prabumulih district also damaged roads evenly connecting cities in South Sumatera. This indicates that the development of road infrastructure in South Sumatera has not been evenly distributed in each district/city. So it can affect economic activity and productivity among the districts/cities.
4.4 Electrical Infrastructure
The rapid advancement of a region, demand for electricity has become the primary needs that must be met, not only for domestic consumption but also for the industrial sector, especially economic activities. In the activities of the community at this time rely on the energy sources and electricity sufficient. Therefore, electricity demand increased from year to year in terms of both quantity and quality.
0.00 50.00 100.00 150.00 200.00 250.00
Figure 9. The average of electricity consumption district/city in South Sumatera, 2007-2016
Source: PT. PLN WS2JB; BPS South Sumatera Province in Figures (processed)
Palembang is an area that has the highest electricity consumption in South Sumatera and always showed an increase in consumption will be high enough electricity each year. Palembang city is the economy centre and development in South Sumatera with the contribution of the industrial sector that is high, so that influence of the high electricity consumption in Palembang city. The high use of electricity in Palembang city utilized for industry and households, because high population and economic activity has increased. While the area has number average lowest electricity consumption is Empat Lawang district, considering the Empat Lawang district which is still low economic growth and development, becomes a new expansion area with the still low population.
4.5 Water Infrastructure
In everyday life, clean water has a role to support the quality of life and health of society, in addition, may affect the productivity of society and the economic output of region.
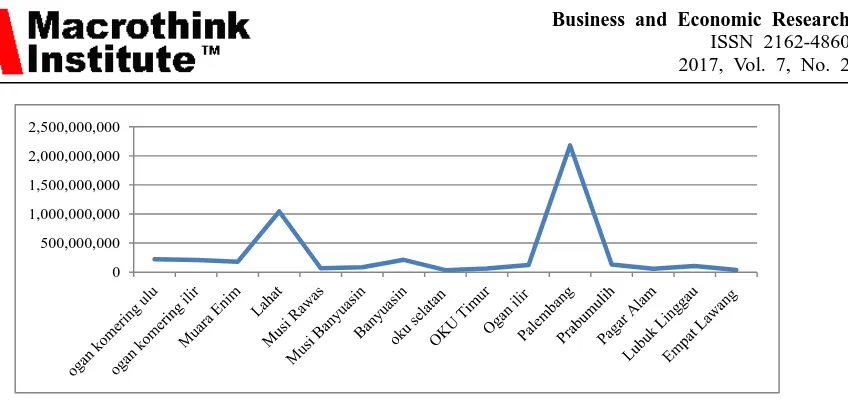
Figure 10. The average of water volume district/city in South Sumatera, 2007-2016
Source: BPS, Statistics South Sumatera (processed)
The total volume of water supplied to the district/city in South Sumatera is still not evenly 0
500,000,000 1,000,000,000 1,500,000,000 2,000,000,000 2,500,000,000
distributed in each district/city. The graph that illustrates the magnitude of the difference in volume of water delivered to each district/city. Areas have the highest amount of clean water volume contained in Palembang. While the area using the lowest water facility is Empat Lawang district. This happens because the largest freshwater use occurred in Palembang city with a high level of economic activity.
4.6 Results of Estimation Model
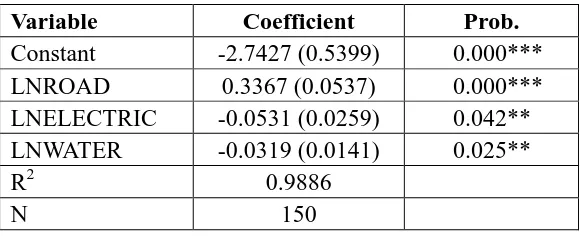
The results using a fixed effect estimation model, that the length of roads, electricity, and water are the statistically have a significant effect the disparities of district/city in South Sumatera province. The coefficient of determination (R2) in the estimation of 0.988666 showing the inequality can be explained by the variable of the road length (road), electricity consumption (electricity), and the volume of water (water) in the model amounted to 98.87%. While remaining 1.13% is explained by other variables outside the model. At a rate of 95% (5 % significance level), the probability values 0.0000 f-test is less than 0.05. This means that at least one independent variable that significantly affected the dependent variable and can be stated also that the estimation results support the feasibility of this model. Based on estimates using the panel data model with fixed effect, the obtained estimation results as the best model following:
Table 1. Result of panel regression model
Variable Coefficient Prob.
Constant -2.7427 (0.5399) 0.000*** LNROAD 0.3367 (0.0537) 0.000*** LNELECTRIC -0.0531 (0.0259) 0.042** LNWATER -0.0319 (0.0141) 0.025**
R2 0.9886
N 150
Tabel 1, show road infrastructure have positive sign and significant effect the development disparity. The level of significant is 5%, the estimated value of the parameters of the long road of 0.3367, meaning that if the roads increased by 1%, it will increase the disparity of development of 0.3367%. Generally, it can be seen that the length of the road infrastructure available in each district/city in South Sumatera province is still not evenly distributed. In addition to the long road uneven, some areas in South Sumatera province have damaged the road conditions including Prabumulih, OKU, Musi Banyuasin, and Musi Rawas. This shows that there are still obstacles in the way of infrastructure development issues in South Sumatera. Damage to roads resulting is increase in the distribution of goods and mobility of people. Damage to roads caused disruption of economic activities that have impact to low income levels and then have increasing disparities of development in South Sumatera.
inequality levels. This condition will affect the disparities. But not so with the research conducted by Calderon & Chong (2004) case study in China. Results show that the road length has negatively affected the development disparity. According to Calderon & Chong (2004), the road length will increase economic activity and facilitate the transport and mobility of economy in the region.
Furthermore, based on calculations carried out, that the electricity infrastructure has a negative relationship with the disparity of development and significant effect. The result of the estimated parameter value (regression coefficient) of the variable of electricity is -0.0531, which means that every 1% increase in electricity infrastructure will reduce disparities in the development of 0.0531%. This is in line with research conducted by Chong (2004) conducted in the State China. This is because the availability of electricity infrastructure can improve the productivity of the community, so to trigger the region's economic growth. The region's economy that is able to develop properly will improve the welfare of society so as to increase people's income as well. However, this condition is not consistent with research that has been done by Calderon & Chong (2004) and Calderon & Serven (2008) with the scope of research among the provinces in Indonesia. Stated that the positive effect on the electricity infrastructure development disparities. This is because the electrical infrastructure development inter-regional in Indonesia has not been evenly distributed, so that additional infrastructure will increase the development disparity.
Complementing the results of research on public infrastructure to the development disparity is water infrastructure. Based on the result of calculations water infrastructure has a negative sign and significant effect the disparities development. The result of estimated show the variable parameters value of water is -0.0319 means that if the amount of water increased by 1%, it will reduce disparities development of 0.0319%. Provision of water can increase the productivity and output of the economy, so expect an increase in water supply in the district/city evenly disparities will cause the lower revenue in South Sumatera. The results are consistent with research conducted by Calderon & Chong (2004) conducted in the State China. This means that water is vital to the life and welfare of the community. The more water used, the better the health level and improves productivity in work and innovates. This condition will add enthusiasm to carry out the development and increase prosperity. As research has been done by Brittain (2002), entitled "Financing Capital Expenditures" suggests that the capital city's infrastructure well maintained is very important to the economy of a municipality and the quality of life for its residents. In addition, the central government must be aware of the importance of cities as economic engines driving prosperity and national and provincial levels. The central government needs to make more efforts through legislative changes or by providing direct assistance to spur the city's economic growth.
5. Conclusion
from the disparities index is 0.62. One reason why happen the disparities development in South Sumatera province caused by the limited range of facilities and infrastructure for the community, especially those living in rural region.
Based on the model estimation on the influence of public infrastructure towards development disparity of districts/city in South Sumatera indicates that long road, electricity, and water infrastructure have an effect on development disparity. The road infrastructure has a positive sign and significant effect the development area. This is because the uneven road infrastructure between the regions and the road damage causes disruption of economic activity that affects the low income level and the high disparity of districts/cities in South Sumatera Province. In contrast, water and electricity infrastructure have a negative effect on development disparities. In other words, the availability of electricity and water infrastructure is getting better and evenly can reduce the disparity of development districts/city in South Sumatera Province.
The availability of well-maintained public infrastructure is critical to the economy of a district/city for the quality of life of its population. In addition, as the engine of economic growth and welfare of society in the region of Indonesia.
References
Badan Pusat Statistik (Central Statistics Agency). (2016). Gross Domestic Regional Product of South Sumatera Province by districts/city, 2010-2013. Palembang: BPS.
Bajar, S., & Rajeev, Meenakshi. (2015). The impact of infrastructure provisioning on
inequality : evidence from India. Global Labour University Working Paper, 35, 1-25. Switzerland: International Labour Organization.
Banerjee, A. (2004). Who is getting the public goods in India? some evidence and some speculation, in Basu, K. (ed.), India's Emerging Economy: Performance and Prospects in the 1990's and Beyond. Cambridge: MIT Press.
Banerjee, A., & R. Somanathan (2007). The political economy of public goods: Some evidence from India. Journal of Development Economics, 82, 287-314.
https://doi.org/10.1016/j.jdeveco.2006.04.005
Baransano, M. A., Putri, E. I. K., Achsani, N. A., & Kolopaking, L. M. (2016). Analysis of Factors Affecting Regional Development Disparity in the Province of West Papua. Journal of Economics and Development Studies, 4(2), 115-128.
Bradshaw, T. K. (2006). Theories of Poverty and Anti-Poverty Programs in Community Development. Rural Poverty Research Center, Working Paper, 6, 2-21.
Brakman, S., Garretsen, H., & Van Marrewijk, C. (2002). Locational competition and and agglomeration: The role of government spending. CESifo Working Paper, 775.
of Income: An Empirical Investigation. Review of Income and Wealth, 50, 87-105. https://doi.org/10.1111/j.0034-6586.2004.00113.x
Calderon, C., & Serven, L. (2008). The Output Cost of Latin America‟s Infrastructure Gap. In: Easterly, W., & Serven, L., eds., The Limits of Stabilization: Infrastructure, Public Deficits, and Growth in Latin America. Stanford University Press and the World Bank, 95-118.
Chatterjee, Santanu, & Turnovsky, Stephen, J. (2012). Infrastructure and Inequality.
European Economic Review, 56(8), 1730-1745. https://doi.org/10.1016/j.euroecorev.2012.08.003
Chenery, H. B. (1974). Redistribution with Growth, London: Oxford University Press.
Easterly, William, & Rebelo, Sergio. (1993). Fiscal Policy and Economic Growth: an Empirical Investigation, Journal of Monetary Economics, 32(3), 417-458.
https://doi.org/10.1016/0304-3932(93)90025-B
Estache, A. (2003). On Latin America‟s Infrastructure Privatization and its Distributional Effects. Washington, DC: The World Bank, Mimeo.
Estache, A., & Fay, M., (1995). Regional Growth in Argentina and Brazil: Determinants and Policy Options." Washington, DC: Mimeo: The World Bank.
Fatile, J. O., & Ejalonibu, G. L. (2015). Decentralization and Local Government Autonomy : Quest for Quality Service Delivery in Nigeria. British Journal of Economics, Management & Trade, 10(2), 1-21. https://doi.org/10.9734/BJEMT/2015/19478
Feng, Wang. (2012). The End of „Growth with Equity‟? Economic Growth and Income Inequality in East Asia. Asia Pasific Issues East-West Center, Working Paper, 101, 1-8.
Gannon, C., & Liu, Z. (1997). Poverty and Transport. Washington, DC: Mimeo: The World Bank.
Gujarati, Damodar, N. (2003). Basic Econometrics. 4th edition. McGraw-Hill International Editions.
Jacoby, H. (2000). Access to Rural Markets and the Benefits of Rural Roads." The Economic Journal, 110, 713-37. https://doi.org/10.1111/1468-0297.00562
Khandker, S., & Koolwal, G. (2007). Are pro-growth policies pro-poor? Evidence from Bangladesh. GPED Conference, p.1-32. Mimeo: The World Bank.
Komarovskiy, V., & Bondaruk, V. (2013). The Role of The Concept of “Growth Poles” for Regional Development. Journal of Public Administration, Finance and Law, 2(4), 31-42. Kuznets, Simon. (1955). Economic Growth and Income Inequality, American Economic Review, 45, 1-28.
Lee, H., Lee, M., & Park, D. (2012). Growth Policy and Inequality in Developing Asia :
Mopangga, Herwin. (2011). Analisis Ketimpangan Pembangunan dan Pertumbuhan Ekonomi di Provinsi Gorontalo, Jurnal Trikonomika, 10(1), 40-51.
Nagaraj, R., Varoudakis, A., & Véganzonès, M. A. (2000). Long-run growth trends and convergence across Indian States. Journal of International Development, 12(1), 45-70. https://doi.org/10.1002/(SICI)1099-1328(200001)12:1<45::AID-JID586>3.0.CO;2-Z
Park, Y. (2009). Analysis of Saemaul Undong: A Korean Rural Development Programme in the 1970s, Asia-Pacific Development Journal, 16(2), 113-140.
https://doi.org/10.18356/3898e112-en
Resosudarmo, B. P., & Vidyattama, Y. (2006). Regional Income Disparity In Indonesia: A Panel Data Analysis. Asean Economic Bulletin, 23(1), 31-44.
https://doi.org/10.1355/AE23-1C
Sahu, T. N., Bundhopadyay, S., & Bundhopadyay, K. (2011). Does money supply influence stock price? in infrastructure finance issues and Challenges. Edited by R.P. Pradhan. New Delhi: Macmillan, 102-118
Sjafrizal. (2008). Ekonomi Regional (Teori dan Aplikasi). Padang: Baduose Media
Todaro, M. P., & Smith, S. C. (2006). Economic Development. Translation Munandar (9th Edition). Jakarta: Erlangga
Wahyuni, Krismanti Tri. (2009). Analysis of the Effect of Economic and Social Infrastructure on Economic Productivity in Indonesia. Bogor: Faculty of Economics and Management. Institut Pertanian Bogor
Copyright Disclaimer
Copyright for this article is retained by the author(s), with first publication rights granted to the journal.