Methodology for measuring derivatives
at the Central Bank of Chile
1Valeria Orellana and Paulina Rodríguez2
1. Introduction
Derivatives are increasingly being used in financial markets throughout the world, and Chile is no exception. Economic agents use these instruments to improve the allocation of resources and to better manage risks given the fact that derivatives can reduce costs, enhance returns, and therefore maintain the financial stability of the economy.
The Central Bank of Chile is responsible for ensuring that inflation remains low and stable. Since 1999 the Chilean economy has moved to a floating exchange rate system, which fosters the development of hedge markets that help protect companies from exchange rate fluctuations. Companies use hedging operations to fix exchange rate levels and therefore limit uncertainty and volatility until the real transaction takes place.
Even though the development level of the derivatives market in Chile still falls short of that in advanced economies, it has steadily grown into a reasonably active market over the last decade, given the size of our economy.
As a result, it is necessary to support the economic agents that participate in this process by providing statistical publications of the most commonly used underlying assets, such as interest rates, commodities, and foreign exchange.
The purpose of this document is to describe the Chilean compilation process. The second section presents a brief overview of the evolution of the derivatives market worldwide and specifically in the Chilean economy. It also compares our activity with the situation in other economies. The third section describes the legal framework underlying the information requirements. Sections four to six analyze the Chilean derivatives system, from data collection to current publications, and its subsequent application in the Central Bank. It also reviews some of their advantages and disadvantages. The last section presents the conclusions of this paper.
2.
Evolution of the derivatives markets
2.1 Global market
The Bank for International Settlements (BIS) is the centre of global statistical activity in the derivatives market. It publishes figures semiannually on derivatives traded in the organized exchange markets, and every three years a worldwide survey is conducted to measure foreign exchange and derivatives activity carried out in the over-the-counter (OTC) market. In the 2007 survey, 54 countries and jurisdictions participated.
1 The views and conclusions expressed in this paper are those of the author and do not necessarily represent
the views of the Central Bank of Chile.
According to the latest survey, in 2007 global OTC derivatives turnover rose to an average of US$ 2,319 billion traded daily, with a 78% increase between 2004 and 2007 (See Graph 1). Some reasons identified by the BIS for this were the diversification strategies made by long-term investors such as pension funds, and the growth of international trade in goods and services during the period. Another factor is the increasing importance of electronic brokering platforms, which have brought efficiency to the trading process.
In terms of currency pairs, the US dollar continued to be the most traded currency, with the euro following far behind in second place; 89% of transactions had one leg denominated in US dollars compared to 35% in euros.
Graph 1 Graph 2
Global OTC derivatives market turnover FX derivatives activity OTC / GDP
Daily averages in April, billions of US dollars Times GDP
Source: BIS Source: BIS and World Bank
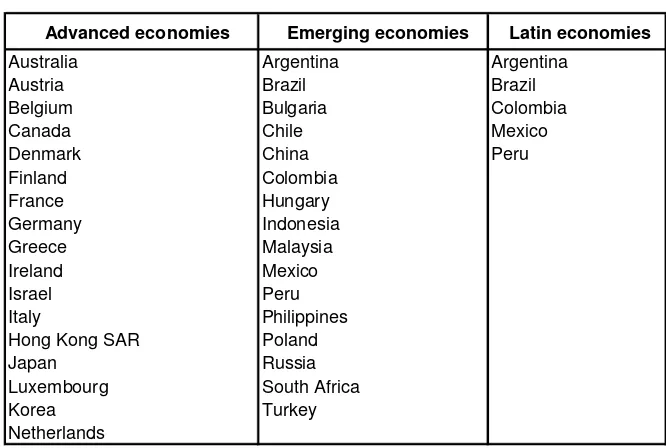
The survey data were classified into three different groups in order to identify the Chilean FX derivatives market in the international context (see Appendix 1). The criterion used in this document for comparing information among countries is depth, which is associated with the frequency of FX transactions in an economy. The ratio normalizes annual FX derivatives activity (OTC) using GDP. The results show that Chile lies between the level of the advanced economies and the emerging economies, and ranks highly compared to Latin American countries. The ratio for all groups is increasing. The main reason for this is the exceptional global growth in FX derivatives transactions shown by the BIS data (Graph 2).
2.2 Derivatives in the Chilean market
The underlying assets traded in Chile are commodities, interest rates and foreign exchanges. According to the data collected by the Central Bank of Chile, approximately US$ 726 billion were traded in 2007, of which 91% correspond to foreign exchange derivatives, 7% to commodities, and the rest is allocated to interest rate derivatives. This document will therefore focus on foreign exchange derivatives.
Banks are the main operators of the derivatives market in Chile. They are the counterparties of agents looking to hedge against exchange rate fluctuations, and speculators who take large risks, especially in anticipating future price movements, or who look for arbitrage opportunities in order to benefit from changes in local interest rates relative to foreign interest rates.
The volume of transactions has grown even faster in recent years, mainly because of the floating exchange rate system, and the hedging strategies of Chilean pension funds. The total foreign exchange turnover increased by 300% between 2001 and 2007, from US$ 165 billion to US$ 695 billion. It is worth noting that cross-border transactions increased
2,319
1998 2001 2004 2007
Foreign exchange turnover
15.4
economies economies Emerging Latin America Chile 1998 2001 2004 2007
Times
GD
by 48% between 2006 and 2007, which is explained by the turbulence in international financial markets, the appreciation of the Chilean peso, and the interest rate spread between the US and Chilean economies. As a result the total foreign exchange turnover (local plus cross-border) rose by 31% in 2007 (Graph 4).
Moreover, the amount traded in the local market by pension funds increased from US$ 7 billion in 2001 to US$ 72 billion in 2007. The notable increase of 72% of transactions for the year 2007 is a result of the increase in the foreign investment limit from 30% in 2006 to 40% in 2007 (Graph 5). In addition, the pension funds raised their total share from 7% in 2001 to 36% in 2007, without considering interbank transactions.
Graph 4 Graph 5
Annual FX derivatives Annual FX derivatives turnover in
turnover local market
Billions of US dollars Billions of US dollars
93 90 105
2001 2002 2003 2004 2005 2006 2007
Pension Funds Others Total
Source: Central Bank of Chile Source: Central Bank of Chile
Even though it is difficult to know the purpose of each operation in the derivatives market, it is useful to monitor the outstanding positions of resident companies compared to cross-border counterparties, in order to observe how the interest rate differential causes them to vary. Between 2006 and 2007, the decrease in the seller’s position in the cross-border market was due to an increase in the outstanding purchase contracts at the end of 2007, which in turn was mainly caused by the interest rate spread between Chile and United States (Graph 6).
Graph 6 Graph 7
Bank FX notional amounts outstanding Type of traded instrument in 2007
Billions of US dollars Per cent
O u trig h t f o rw a rd
Source: Central Bank of Chile Source: Central Bank of Chile.
404
2001 2002 2003 2004 2005 2006 2007 Local Cross-border Total
1.1 1.7
In Chile, outright forward contracts are the most traded financial instruments, although the share of FX swaps has increased in the last four years (Graph 7). It should be noted that currently all foreign exchange transactions reported are OTC.
3. Legal
framework
The Basic Constitutional Act of the Central Bank of Chile empowers it to define the foreign exchange market regulations and to demand statistical data from the various economic agents that participate in this market. This information is used for financial stability analysis, to track foreign exchange market activity and to compile the balance of payments and international investment position.
The statistical requirements are defined in the Compendium of Foreign Exchange Regulations, which establishes the standards applicable to foreign exchange transactions. Chapter IX of the Compendium defines the information requirements for Chilean entities regarding derivatives in the local and cross-border markets, for any underlying assets.
4. Compilation
system
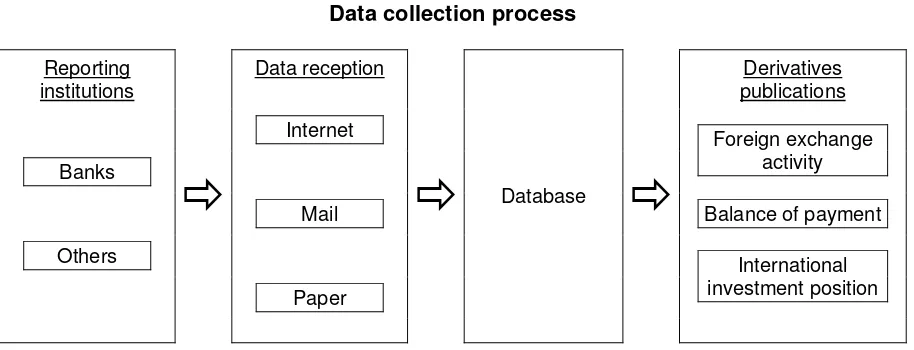
Derivatives are measured at both market value and notional amounts. This section explains the compilation of derivatives process, including reporting institutions, data collected, validation, and the valuation methodology utilized to calculate market value (Figure 1).
Figure 1
Data collection process
Reporting institutions
Data reception Derivatives publications
Internet
Banks
Foreign exchange activity
Mail Balance of payment
Others
Paper
International investment position
Ö
Ö
DatabaseÖ
4.1 Data collection system
The Central Bank of Chile (CBCh) has a mixed data collection system that combines indirect reporting (eg banks reporting data from third parties, usually known as the International Transactional Reporting System (ITRS)), and direct reporting, such as surveys. The latter has increased its relevance due to new statistical requirements.
The Statistics Collection Department is in charge of gathering these data and the requirement forms are available at http://www.bcentral.cl.
restrictions on foreign capital flows. At that time, reporters had to fulfill several requirements of providing information, which has resulted in reporting institutions have become used to reporting data to the Central Bank of Chile.
Studies of the possibility of changing the current collecting system to one with aggregated information have been made, but the conclusions are clear about an increase on the reporting burden given the fact that they would have to invest in new technology for adapting their systems to the new requirements.
4.1.1 Reporting institutions
Banks or companies that carry out transactions with derivatives such as forwards, FX swaps, options, cross-currency swaps and futures, must report their transactions if they are made in foreign currencies or if the cash settlement is made in a foreign currency.
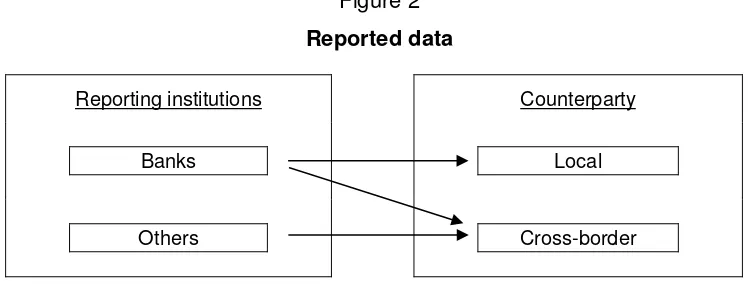
Banks report data with both local counterparties (residents) and cross-border (non-resident) counterparties. Conversely, other reporting entities report only cross-border transactions, therefore avoiding double reporting (Figure 2).
Figure 2
Reported data
Reporting institutions Counterparty
Banks Local
Others Cross-border
Currently, there are 25 banks reporting foreign exchange derivatives. Twelve of them are branches of non-resident banks and the rest are local institutions. Reports are made daily by 11:00. The contracts reported are those traded on the previous day.
Local counterparties of banks can be classified into institutional, non-financial, and financial sector excluding banks (Appendix 2, Table 2). The number of counterparties has risen during the last six years, from 750 in 2001 to 2,094 in 2007. This is mostly explained by the increase in the non-financial sector, from 877 in 2004 to 2,030 in 2007 (Appendix 2, Table 3).
On the other hand, there were 59 cross-border counterparties of banks in 2007, mainly banks and their branches (Appendix 2, Table 3). The number of this type of counterparties has been increasing since 2004, revealing a greater access to the cross-border market. Moreover, the internationalization of Chilean fixed and variable income instruments encourages the uses of FX derivatives.
Other companies reporting derivatives data (transactions with cross-border counterparties) can be classified into three groups: insurance companies, non-financial entities and investment banks. Monthly reports must be submitted to the Central Bank of Chile not later than the 10th of the month following the date of transaction.
4.1.2 Data collected
trade date, forward rate, currency buyer, currency seller, settlement currency, settlement date, valuation date and settlement (Appendix 2, Table 4).
At present, on average 8,495 contracts are received monthly from banks, which include both local and cross-border market transactions, whereas 56 are received monthly in the case of others entities with cross-border counterparties (Graph 8). Banks’ share of total turnover increased from 91% in 2001 to 96% in 2007, mainly explained by the rise in cross-border operations. In the local market, bank transactions – in terms of amounts – are mostly with other entities.
Graph 8 Graph 9
Average monthly received contracts Most traded currency pair
Contract units Per cent
O th er s
Source: Central Bank of Chile Source: Central Bank of Chile.
With respect to currency distribution, US dollars – Chilean peso are the most traded currency pair, accounting for 95% of the total. Next are US dollars–euro, and US dollar–yen, with 2.1% and 1.9% shares, respectively (Graph 9).
4.2 Validation
The reporting form on the Internet has data-entry validations to ensure that reporting entities do not enter incorrect data.
Interbank transactions have a special validation. The system checks that data reported by a bank must be the same as the data reported by its counterparty, according to the contract. For example, the amount purchased by a bank must be the same as the amount sold by the counterparty. Reporting banks can be contacted in order to amend the reported data.
Another validation tool is cross-checking data reported by the International Transactional Reporting System and the derivatives reporting forms, which are usually reported by different areas of the banks. This ensures that all operations are informed and classified under the correct transaction codes in the ITRS system; the type of settlement is also verified.
Furthermore, as data are published daily, consistency with the previous day is checked so that there are no anomalies.
4.3 Valuation methodology
The Central Bank of Chile collects notional amounts. Therefore, and in order to compile derivatives statistics for the balance of payments (BOP) and the international investment position (IIP), the market value of contracts must be calculated.
2,429 3,422
The value of a forward-type contract derives from the difference between the agreed contract (strike) price(s) and the prevailing, or expected, market price(s) on the day of the settlement, times the principal amount, appropriately discounted.
The market value of the contracts is calculated by the software database using the net present value technique. To create an interest rate curve, the system needs as inputs the risk-free interest rate of the different currencies and maturities for effective contracts at the valuation date, which are obtained from Bloomberg. The linear interpolation method is used to determine the value of missing interest rates. The market value is calculated using the exchange rate and interest rates for the selected date.
4.3.1 International investment position and balance of payments
The requirement to include statistical data on financial derivatives was first incorporated in the international manual of the System of National Accounts released in 1993 (SNA93) and the 5th Balance of Payments Manual (BPM5). These data were formerly classified within a portfolio investment subcategory. Since the financial derivatives market has grown in recent years, the International Monetary Fund established the treatment of financial derivatives as a separate functional category in 2000 to reflect its increasing importance.
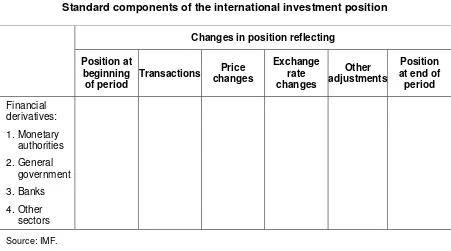
The standard components of the international investment position are established in BPM5 (Figure 3).
Figure 3
Standard components of the international investment position
Changes in position reflecting
Position at beginning of period
Transactions Price
changes
Exchange rate changes
Other adjustments
Position at end of
period
Financial derivatives:
1. Monetary authorities
2. General government
3. Banks
4. Other sectors
Source: IMF.
5.
Data uses and statistics
The data on derivatives are used to help authorities to design financial and monetary policies and to assist market participants to better monitor activity patterns in the financial system. Exchange-rate volatility in particular can affect the financial stability of economies in several ways. These effects can be observed on the balance sheets of companies through the currency denomination of assets and liabilities, as well as on the competitiveness of companies dedicated to external markets. In this context, financial derivatives are instruments available for economic agents to help them reduce their exposure to currency risk.
In order to analyze the impact on the exchange rate, outstanding positions (asset or liability) taken by the different economic agents are followed (eg the impact of raising the foreign investment limits of pension funds on the exchange rate).
Derivatives figures can also be used to analyze whether arbitrage by cross-border agents is taking place. Given the current difference between local and foreign interest rates, the Central Bank of Chile and the market are closely following local outstanding positions with non-residents.
Graph 11 shows the evolution of the net balance of the total operations of the foreign exchange derivatives market, that is, the difference between the buying and selling positions, broken down by the residence of bank counterparties. The national agents have been selling rather than buying dollars. An example of this is institutional investors, who have been protecting themselves from exchange rate risks. On the other hand, foreign agents have been buying those dollars in the forward market. This would indicate that foreign agents are incurring debts in Chilean pesos at lower interest rates than they could obtain by investing, to take advantage of the exchange rate differential and carry trade with other countries of the region (Graphs 11 and 12).
Graph 11 Graph 12
Bank FX notional amounts Local banking net outstanding position outstanding broken down by sectors
Millions of US dollars Millions of US dollars
-15,000
Jan-06 Apr-06 Jul-06 Oct-06 Jan-07 Apr-07 Jul-07 Oct-07 Jan-08 Apr-08 Total net outstanding Domestic net outstanding Net outstanding with non-residents
-20,000
Non-residents Non-institutional residents
Institutional residents Net
Source: Central Bank of Chile.
Graph 12 was published in the article “Pension funds exchange rate hedging risk and its effect on local banking”, of the Financial Stability Report for the first semester of 2008.
As a result of the hedging needs of institutional investors, banks offer exchange rate risk hedging to other agents with foreign currency selling positions, but without natural hedging
against that risk (import companies or companies that have debts in foreign currencies) in order to hedge their foreign currency buying positions. In addition, banks also offer risk hedging to non-resident investors who need to have a selling position in Chilean pesos. On average, these investors have bought US$ 7 billion in forward dollars. As a result, the difference between buying and selling positions has increased since September 2007, reaching US$ 6,790 million in April 2008.
5.1 Statistics
The Central Bank of Chile publishes derivatives statistics to increase market transparency. Derivatives statistics are published monthly in the balance of payments and quarterly in the international investment position at market value (Appendix 3). Likewise, they are used in semiannual financial stability reports, BIS reports, working papers, and are occasionally requested by members of the public.
Alternatively, turnover data and outstanding positions are published monthly in the Monthly Bulletin, with the following breakdowns:
a) Banking statistics
Turnover notional amounts are broken down by maturity, price, and average daily turnover between banks and third parties, as well as interbank operations. In addition, outstanding positions are broken down by local and cross-border market and by purchases and sales to third parties (Appendix 3).
b) Bank and company statistics
Turnover notional amounts are broken down by currency pair (domestic currency with US dollar), local and cross-border market, and counterparty (banks or companies).
Daily bank turnover data are also published in the Daily Bulletin, specifically the purchases and sales to third parties (meaning no banks), net amounts (purchases minus sales), and operations between banks (Appendix 3). It is important to mention that the Central Bank of Chile publishes only aggregated data because individual institutional data must remain confidential according to the Bank’s legal obligations.
6.
Advantages and disadvantages of the Chilean system
This section reviews the main advantages and disadvantages of the Chilean derivatives data collection system.
Advantages:
• Electronic receipt and automatic data downloading into the database minimize
operational errors and reporting lag.
• High quality of the data available. The fact that the information provided is known by
the reporting entities, since it is the same as in the contracts, ensures integrity, accuracy and reliability of the data.
• Low reporting burden as data providers just send the contract information without
• Daily publication periodicity. Thanks to daily reporting by banks, total derivatives FX
turnover can be published on a daily basis. It thereby provides useful information for market participants.
• Detailed information received enables the provision and dissemination of information
using different breakdowns. Disadvantages:
• The system requires constant efforts in order to ensure a good coverage and scope
with non-commercial banks. Checks are made by different sources to verify that all companies with derivatives abroad are reporting, because the derivatives deals that they make in the local market are reported by commercial banks. For instance, notes to the financial statements of the supervised companies are reviewed. Furthermore, as companies report other financial data such as foreign loans to the Central Bank of Chile, and those institutions have a strong likelihood to hedge currency risk, they are contacted as well.
• Transactions between two Chilean entities, when neither is a bank, are not recorded
in the same way and frequency that the other operations previously described. Annual surveys have been implemented to measure this gap. Aggregate results have shown that the missing information accounts for only 7% of the information already collected.
• The system lacks information on those transactions related to the Chilean peso,
involving two foreign entities interacting abroad. In this case, the Central Bank of Chile cannot legally demand the data, but international experiences have been reviewed, in order to survey international brokers.
7. Conclusions
In recent years, derivatives information has become an important variable for tracking Chilean FX markets, analyzing domestic financial stability, and helping policymakers. Therefore, the accuracy and quality of information collected is of great importance.
Chile has developed an efficient system for measuring derivatives statistics using detailed daily data from banks and monthly data from non-commercial banks. This information is available in over-the-counter” (OTC) contracts and is also received electronically through the Internet.
The quality of the information collected is high, and allows the Central Bank of Chile to publish reliable statistics. The detailed derivatives data collected by the Central Bank of Chile covers its information needs for policy decisions and for the analysis of financial stability. Regarding the challenges facing the Central Bank of Chile, further work is required in the future to collect data that are not currently available. In this sense, international experience in collecting derivatives data for transactions between non-residents needs to be reviewed. Furthermore, it is important to develop a better coordination with supervising authorities in order to improve the quality of data on derivatives.
The impact of the international financial reporting standards (IFRS) on data collection must be taken into account, in order to verify whether those standards will require changes in the way data are collected currently.
Appendix 1
Table 1
Country group list
Advanced economies Emerging economies Latin economies
Australia Argentina Argentina
Austria Brazil Brazil
Belgium Bulgaria Colombia
Canada Chile Mexico
Denmark China Peru
Finland Colombia
France Hungary
Germany Indonesia
Greece Malaysia
Ireland Mexico
Israel Peru Italy Philippines
Hong Kong SAR Poland
Japan Russia
Luxembourg South Africa
Appendix 2
Foreign exchange derivative reporting form
Institutional sector Non-financial sector Financial sector excluding banks
Pension funds Electricity, gas and water
Wholesale and retail trade, hotels and restaurants Financial intermediation and business services
Others
excluding banks Total
2001 27 695 28 750 19
CLP 15,540,000,000 518 0 06/08/2008 35
Non-deliverable 30,000,000 outright
forward US dollar Bank USA 12345 02/07/2008
Option premium Name Country Currency buyer purchasedAmount Currency seller
Trade date Number
of days Instrument
Purchases Sales
Forward rate Counterparty
data Contract number
Settlement
Appendix 3
2. Monthly bulletin tables
Banks’ outright forward turnover (CLP–USD)* Millions of US dollars
Up to 7 days 8–30 days 31–42 days Over 42 days
Period % of Price % of Price % of Price % of Price Price
2008 Amount the total CLP/USD Amount
the total CLP/USD Amount
the total CLP/USD Amount the total CLP/USD Amount
CLP/USD January 12,019 20.1 480.67 15,949 26.7 481.01 14,088 23.6 480.06 17,614 29.5 483.99 59,670 481.60 February 12,127 20.3 466.45 16,816 28.2 467.57 7,505 12.6 466.45 10,541 17.7 473.17 46,989 468.36 March 13,737 23.0 442.48 17,854 29.9 441.60 14,671 24.6 442.56 15,162 25.4 447.97 61,425 443.60 April 14,721 24.7 447.55 16,401 27.5 447.59 13,859 23.2 449.63 13,881 23.3 449.10 58,862 448.42 May 12,719 21.3 470.97 13,497 22.6 472.25 13,864 23.2 472.39 10,494 17.6 476.25 50,574 472.80
* For obtaining the amounts, interbank trading is divided by two to eliminate double-counting. Contract maturity period
Total turnover Spot position and banks’ outright forward position
Millions of US dollars
Period
January -5,988 30,212 21,292 18,886 27,378 22,577 11,326 -6,086 5,240 -749 February -6,475 30,610 19,029 20,166 23,760 22,994 10,444 -4,731 5,714 -761 March -7,128 34,122 17,517 19,922 24,225 25,614 14,200 -6,708 7,492 364 April -7,337 34,276 13,280 19,838 20,926 25,918 14,438 -7,646 6,792 -545 May -9,077 35,660 12,640 19,285 20,479 24,270 16,375 -7,839 8,536 -540
Spot position
Total position *Purchases to third parties *Sales to third parties Interbank
(only local Outright forward positions by counterparty Outright forward
positions by market
Outright forward position
Banks’ transactions Millions of US dollars
Period %
2008 Third parties Interbank Total (CLP/USD) Third parties Interbank Total CLP/USD Spot January 2,187 530 2,718 99.81 1,297 1,604 2,901 481.01 479.46 February 1,759 526 2,285 97.93 1,001 1,606 2,607 467.57 466.67 March 2,405 705 3,109 98.77 1,326 2,671 3,996 441.60 442.13 April 2,053 649 2,702 99.02 1,362 1,830 3,192 447.59 447.51 May 1,937 608 2,545 100.00 1,351 1,645 2,996 472.25 471.00
3. Daily bulletin table
FX transactions with local and cross-border market Millions of US dollars
Period 2008
January 63,110 100 177 0 33,856 29,431 63,287
February 49,594 98 993 2 31,335 19,252 50,587
March 63,230 99 748 1 38,640 25,338 63,978
April 61,411 99 583 1 37,638 24,356 61,994
May 52,458 99 303 1 33,826 18,935 52,760
Local
FX transactions with cross-border market Millions of US dollars
Period 2008
January 48,589 90.7 5,009 9.3 25,99353,597 88.3 3,438 11.7 29,431 February 42,706 91.2 4,136 8.8 16,68646,842 86.7 2,565 13.3 19,252 March 41,742 92.6 3,354 7.4 23,56945,096 93.0 1,770 7.0 25,338 April 34,228 92.6 2,723 7.4 21,80536,951 89.5 2,551 10.5 24,356 May 33,057 92.7 2,592 7.3 17,07735,649 90.2 1,858 9.8 18,935
Period 2008
January 5,092 59.4 3,480 40.6 8,572 1,423 90.5 149 9.5 1,572 February 5,180 59.0 3,604 41.0 8,784 846 60.2 558 39.8 1,404 March 5,123 44.9 6,288 55.1 11,411 1,698 36.2 2,987 63.8 4,685 April 5,187 44.1 6,578 55.9 11,765 1,576 62.3 954 37.7 2,531 May 5,594 47.3 6,241 52.7 11,835 1,772 69.8 768 30.2 2,540 Total Banks OthersPercentage Percentage Total Percentage Others Percentage
Others Percentage
Foreign currency against foreign currency
Outstanding position Turnover
Percentage Total Turnover
Local currency against foreign currency
Total Banks Percentage Others Banks Percentage
Outstanding position
Banks
Local market Cross-border market Spot market
Forward market
References
Bank for International Settlements (1998, 2001, 2004 and 2007): Triennial central bank survey: foreign exchange and derivatives market activity.
Alarcón, F, Selaive, J and JM Villena (2004): “Mercado Chileno de Derivados Cambiarios”, Serie de Estudios Económicos 44, Banco Central de Chile.
Alarcón, F and JM Villena (2004): “El Mercado Cambiario Chileno”, Serie de Estudios Económicos 43, Banco Central de Chile.
Zurita, S and L Gómez (2003): “Normativa de los Mercados Derivados en Chile”, Estudios Públicos 89, summer.