Gadjah Mada International Journal of Business May-August 2010, Vol. 12, No. 2, pp. 231–255
Murti Lestari
Faculty of Business, Duta Wacana Christian University
Lincolin Arsyad
Faculty of Economics and Business, Universitas Gadjah Mada
This study analyzes the responses of performances of Bank Mandiri, Bank Danamon, and Bank Permata to merger strategy. This paper harnesses the quantitative approach with structural break analysis method and impulse response function. The plausible findings indicate that the merger of Bank Permata produces a better performance response in comparison to the consolidation of Bank Mandiri and the merger of Bank Danamon. The merger of Bank Permata does not result in performance shocks, and the structural break does not prevail either. On the other hand, the consolidation of Bank Mandiri and the merger of Bank Danamon result in structural breaks, particularly in the spread performance. In order to return to the stable position, the mergers of Bank Mandiri and Bank Danamon require a longer time than does the merger of Bank Permata. This research indicates that for large banks, the mergers and acquisitions (retaining one existing bank) will deliver a better performance response than will the consolidations (no existing bank).
THE RESPONSE OF PERFORMANCE TO
MERGER STRATEGY IN INDONESIAN
BANKING INDUSTRY
Analyses on Bank Mandiri, Bank Danamon, and
Bank Permata
Introduction
Merger is one of the strategies to expand a business, including a banking business (Martin 1994: 293-295; Garton et al. 2005), because by executing a merger strategy the business could decrease the average costs (Basanco et al. 2004: 73-79) derived from either the economies of scale or the econo-mies of scope. In addition, in the event of shocks, merger could also become a survival strategy. Therefore, in several countries, economic shocks have re-sulted in a wave of mergers (Koetter 2005; Koskela and Stenbacka 2000; Carletti et al. 2006).
However, in a managerial way, it is not easy to execute mergers, acqui-sitions, and other corporate actions. There are several technical problems which render mergers unable to yield positive performances for the compa-nies, either in the forms of efficiency, innovation, or profitability. Several stud-ies show that in the post-merger period, companies will need an extensive phase for rebuilding process such that the positive performances expected from the merger strategy can be realized. During the rebuilding process, it is com-mon to find merged companies that fail. Fortune magazine observed in 1988 that of the mergers in the United States in the mid of 1980s, one-half to two-thirds had failed. That failure was mea-sured based on the companies’ finan-cial performances, meaning that the merged companies showed poorer fi-nancial performances compared to
acquisitions. In this study, poorer per-formances by the banking industry were indicated by a decrease in the third-party funds or deposits (Fulmer and Gilkey 1988).
According to Fulmer and Gilkey, there is a fundamental theory in human capital that an employee will psycho-logically suffer a shock as a result of changes in the organization. Fulmer and Gilkey argue that this human ele-ment is rarely considered in the pre-merger studies so that most pre-merger failures can be traced from human resource problems. A study on 150 mergers and large acquisitions in the United States during the mid 1980s shows that almost 50 percent of senior executives from acquired companies will leave their organizations one year after mergers and 75 percent of them will leave their organizations within three years after the mergers. This finding indicates that in the post-merger period, there are many complicated managerial problems, preventing a merger from immediately producing positive performances. Moreover, mis-management during the post-merger period can also result in merger fail-ures.
mances are originated from difficult circumstances resulted from the changes in corporate culture. Accord-ing to the analysis, the larger the corpo-rations that merge, the larger is the probability of conflicts. Consequently, the probability of performance de-creases after mergers will also be greater.
In the case of a transnational merger, post-merger managerial diffi-culties should be greater. Steensma et al. (2004) conducted a study on an international venture capital company. Their study finds that venture capital companies or transnational mergers are relatively unstable. There are two important factors that cause the un-stableness: (1) social exchange and (2) learning perspective. In order to return to a stable position, a unique time line is required in each factor.
Based on this theory, it can be assumed that in general, a specific time line is required so that mergers can result in good performances. Manage-rially, this period is called the “rebuild-ing after the merger,” and there is no standard for how long it would take. Each merger requires a unique time line, depending on several components such as human resources, culture, and the organizations per se.
In the banking industry, the analy-sis of the response of performance to consolidation, merger and acquisition strategies have been widely conducted. Research have utilized various ap-proaches which result in a variety of conclusions. One of the studies was conducted by Calomiris and
Pornrojnangkool (2005). The findings show that merger and acquisition do not necessarily improve efficiency, measured by a decrease in average costs. Taking the case of merger and acquisition between Fleet and Boston Bank in New England, Calomiris and Pornrojnangkool conclude that in the post-merger period, credit/loan market in general becomes more monopolistic. However, for small medium enter-prises’ (SMEs) loans, there is a de-crease in interest rate that might be derived from the economies of scale. Nevertheless, if seen from its cost structure, it turns out that merger does not significantly reduce average costs. Another study which observes banking mergers in Europe (Koeter 2005) demonstrates similar conclusions. Using the stochastic frontier analysis, Koeter concludes that the banking mergers in Europe do not fully improve efficiency. In fact, the difference be-tween the cost efficiency of merged banks and that of non-merged banks is not significantly different. However, when the performance is measured using profitability, merger does increase profits, especially for banks.
years have shown no clear pattern of performance responses toward the mergers.
For the case of Indonesia, there are several studies with different ap-proaches. One study was conducted by Mardanugraha (2005). Using the parametric cost approach to analyze the case of Bank Mandiri merger, Mardanugraha concludes that the bank merger in Indonesia has certainly de-creased the efficiency level although it has been able to increase the stability. Another study was conducted by Samosir (2003), who also researched the merger of Bank Mandiri. Utilizing the financial ratio approach, Samosir’s conclusion is not very much different from Mardanugraha’s, i.e., the merger of Bank Mandiri has indeed reduced its financial efficiency and performance. Predicated upon the aforemen-tioned discussion, it seems that merg-ers do not immediately result in good performances. Rather, an extensive process is required. Mergers can even fail because of managerial process. This study purports to analyze the re-sponse of performance to merger strat-egy in Indonesian banking industry. The structure of this paper is organized as follows. Section 1 introduces the ideas, section 2 reviews the banks being studied, sections 3 and 4 are the methodology and analysis, and section 5 concludes.
Overviews of Bank Mandiri,
Bank Danamon, and Bank
Permata Mergers
In 1997-1998, the Indonesian bank-ing industry experienced a crisis which was started by the closures of 16 pri-vate commercial banks. This phenom-enon made people panic, and triggered an economic crisis. Afterwards, the government commenced on a new stage in developing Indonesian banking in-dustry by taking several steps to re-capitalize the banking industry. Those steps include: (1) providing liquidity assistance; (2) forming an Indonesian
Bank Restructuring Agency/Badan
Penyehatan Perbankan Indonesia (BPPN), one of whose tasks is to take over non-performing loans (NPL); and (3) performing mergers of several banks. The main objective of these policies is to build a strong framework for the banking industry such that the industry can act as a powerful develop-ment tool.
acquisi-tions executed, as one of the efforts to recapitalize the damaged banking in-dustry caused by the 1997-1998 eco-nomic crisis. In this period, there were three phenomenal bank mergers, i.e., the merger of Bank Mandiri, the merger of Bank Danamon, and the merger of Bank Permata.
Bank Mandiri is a bank resulting from the merger of four state banks, i.e., Bank Dagang Negara, Bank Bumi Daya, Bank Pembangunan Indonesia, and Bank Ekspor Impor. Based on the Government Regulation (Peraturan Pemerintah) (PP) No. 28/1999, this kind of incorporation is called a consoli-dation, where the four banks were dissolved and a new bank was formed. The merger process of Bank Mandiri began in October 1998 as a part of banking restructuring programs. Al-though the process had started since 1998, Bank Mandiri was not operating until July 1999. The merger of Bank Mandiri is an interesting merger since it is a merger of four established banks. Two other phenomenal mergers after the economic crisis were the merger of Bank Danamon and the
merger of Bank Permata. Bank
Danamon emerges a result of the merger of 11 banks with two stages of merger in which Bank Danamon is retained as the existing bank. In the first stage of merger which was car-ried out in 1999, Bank Danamon ac-quired Bank PDFCI. In the second stage of merger in 2000, eight banks were merged, i.e., Bank Tiara, Bank
Duta, Bank Rama, Bank Tamara, Bank Nusa Nasional, Bank Pos Nusantara, Bank Jaya Internasional, and Bank Rasyid Salim. Thus, the current Bank Danamon is the incorporation of 11 banks, which is Danamon plus PDFCI and plus other eight banks in the second stage of merger. Compared to other mergers from the organizational side, the merger of Bank Danamon is a large merger although the individual banks that merged are relatively small.
Quite different from Banks Mandiri and Danamon, the merger of Bank Permata is a merger of relatively small banks, i.e., Bank Bali, Bank Uni-versal, Bank Prima Express, Bank Artamedia, and Bank Patriot. In the merger process, Bank Bali was ap-pointed as the platform bank since of the five banks, Bank Bali was rela-tively large and existent. Then, the four banks were merged into the platform bank, and the name of the five merged banks was changed to be Bank Permata. This merger was performed as an implementation of the govern-ment decision in September 2001. How-ever, the actual merger was not carried out until May 2002.
Methodology
Impulse Response Function
Method
In order to measure the response of performance to merger strategy observed in the consolidation of Bank Mandiri, the merger of Bank Mandiri, and the merger of Bank Permata, this study employs an econometric method by estimating the impulse response function (IRF) model. The IRF ap-proach is chosen because this method delivers better results in measuring responses compared to other methods such as Taylor or Maclaurin series (Cerra and Saxena 2008).
To estimate the IRF, this study uses the indirect vector autoregressive (VAR). IRF traces the responses of dependent variable in the VAR system to shocks from the error term in that system (Gujarati 2003: 853-854; Enders 2004: 272-277). The models of struc-tural VAR estimated in this study are as follows:
with:
Yt: banks’ performances
Xt: dummy; 1 if post-merger (acquisi-tion), 0 if pre-merger(acquisition)
t : error term
Since Xt is a dummy, the estima-tion in the SVAR models uses the probit model as the dependent variable as described in the following equations (3) and (4).
From the SVAR models, in order to detect the response of performance to merger and acquisition strategies, the following IRF models are esti-mated:
with:
Yt: banks’ performances
Xt: 1 if post-merger(acquisition), 0 if pre-merger(acquisition)
t: errors from models (1) and (2)
According to theory, the associa-tion between merger and performance is a one-way relation, i.e., performance does not affect merger; hence, 21= 0.
For that reason: Yt + 12Xt-i= 1o +
iYt-1 +
iXt-1 + 1t...(1)k
i=1 k
i=1
21Yt + Xt-i= 2o +
iYt-1 +
iXt-1 + 2t...(2)k
i=1 k
i=1
Yt=co +
(c1j1t-j +c2j2t-j)+e1t...(3)k
j=1
k
j=1
Pr(Xt=1)= F[do +
(d1j1t-j +2t = e2t...(5)
1t = e1t + 12 e2t...(6)
The IRF model developed in this study estimates the response of perfor-mance to merger and acquisition strat-egies. For this objective, several mea-surements of performances are em-ployed. Theoretically, the performance measurement of a company (an indus-try) can be analyzed using several variables (Martin 1994; 14-38). First, the number of produced outputs. Larger outputs mean the company has better performance since it indicates effi-ciency from the economies of scale. Second, the spread between output selling price and input buying price. Lower spread of the prices means better performance. Third, the aver-age costs. Lower averaver-age costs indi-cate a higher efficiency which means better performance. Fourth, profit. In a perfectly competitive market, higher profit depicts efficiency in cost minimi-zation so that higher profit means bet-ter performance.
On the basis of the theory, this study uses Martin’s concepts and Dymski’s approaches (2002) to mea-suring performance by using these measurements: (1) the size of disbursed credits as the measurement of output performance; (2) the spread between time deposit rate and saving deposit rate as the measurement of input and output price deviation; (3) OEOI, the ratio between the operational expenses and the operational income as the mea-surement of average costs; and (4)
profit before taxes. For the merger variable, this study uses a dummy vari-able which takes the value of 1 if it is the post-merger or acquisition period, and 0 otherwise.
Data Examination and the
Analysis of Structural Break
To employ the estimation, the pe-riod taken is from quarter 1 of 1993 to quarter 1 of 2009. This period selection is based on the objective of this study, which is to observe the effects of merger on performance. Three impor-tant mergers in Indonesia prevailed in the period: the merger of Bank Mandiri in 1999, the merger of Bank Danamon in 2000, and the merger of Bank Permata in 2002. Therefore, the period taken must be before 1999 and after 2002.
Based on the sampling period and the estimation method, this study uses time series data. Statistically, time se-ries data include four components, i.e., trend (T), seasonal (S), cyclical (C), and irregular (I). With these compo-nents, the time series data often have an unstable pattern, so the average value (mean) and variance are not constant. In econometrics, the data to be estimated must meet the require-ments of constant mean and variance, i.e., E(Yt)= , and Var (Yt)= E(Yt
-)2=. With these requirements, an
of a spurious or chaotic regression, and the violation of classical assumptions. Therefore, the initial step of the estima-tion process in this study is to test the data stationarity.
The testing of data stationarity has developed for a long time. Dickey-Fuller approach is the most popular approach. Dickey-Fuller unit root test is used on the condition of non-struc-tural break. This test consists of Dickey-Fuller test (DF Test) and Augmented Dickey-Fuller test (ADF test). In their developments, the DF and ADF tests are considered too simple, and can lead to a bias (wrong) statistical conclusion because they do not accommodate the structural changes in variables, whereas, in fact, most of all economic variables (especially macro variables) contain structural break elements. Structural changes, statistically, occur when a stationary data series experi-ences shifting in its average value (mean) permanently (Enders 2004: 200-202).
On the basis of a widely occurred structural break, unit roots testing which is able to capture structural changes is developed. One test with this method was developed by Perron and Vogelsang (1992) and Perron (1997), which is widely known as the Phillips-Perron test or PP test (Enders 2004: 207). The null hypothesis of the PP test is the data contain unit roots or are not stationary, and its alternative hypoth-esis is the data do not contain unit roots or are stationary.
Another stationarity test which is able to capture the structural changes is a test developed by Kwiatkowski, Phillips, Schmidt, and Shin or known by the KPSS test. The null hypothesis of the KPSS test is the data do not contain unit roots or are stationary, and its alternative hypothesis is the data con-tain unit roots or are not stationary. The Kwiatkowski model (Kwiatkowski, et al.: 1992) is basically a refinement of the DF and PP method. According to Kwiatkowski, the methods that make an initial assumption (null hypothesis) of data contain unit roots are actually based on a very weak argument. There-fore, he argues that if the null hypoth-esis of the DF or PP test is confirmed, it must be supplemented by the rejec-tion of the null hypothesis in the KPSS test, which states that the data are stationary.
The test of stationarity was then improved by Zivot and Andrews in their study on the impacts of oil price shocks on the U.S. economy (Zivot and Andrews 1992). In their paper, they criticize the unit roots test with PP and KPSS approaches since the tests could produce incorrect statistical con-clusions, especially when the variables contain structural changes.
Perron only reveals that the structural changes in data are gathered from previous information that has happened. According to Zivot and Andrews, this is a weakness that must be addressed. To complement Perron’s analy-sis, Zivot and Andrews include three variables that can capture the struc-tural changes: (1) dummy mean, (2) dummy trend, and (3) mean or dummy regime. In their model, Zivot and Andrews label the variables as “shift in mean,” “shift in trend,” and “shift in regime.” The equations estimated to capture the structural changes are as follows.
1. Shiftin Mean (Structural Changes in Intercept)
in which DUt is a dummy mean variable which serves to capture the structural changes in intercept (á). 2. Shift in Trend (Structural Changes
in Trend)
in which DTt is a dummy trend variable which serves to capture the structural changes in trend (t). 3. Shift in Regime (Structural Changes
in Intercept and Trend)
in which DUt and DTt are dummy regime variables which serve the structural changes in intercept () and trend (t).
With this refinement, Zivot and Andrews model is able to detect whether in a certain period of time one variable experiences structural breaks without information of previous exist-ing structural breaks.
Not only is Zivot and Andrews approach able to test unit roots, but it also could detect when a variable ex-periences structural changes. Thus, an extensive interpretation as to whether a shock on a variable can lead to a significant shock can be made. This kind of interpretation is very important economically, considering that in time series data, the influences of irregular elements have been less able to be examined, or even to be detected.
Although Zivot and Andrews ap-proach is the most advanced unit roots test, this study is focused on the DF, PP, and KPSS approaches to examin-ing the data stationarity. This is based on the consideration of the limitation of program tools. However, Zivot and Andrews approach is still performed, not to test the data stationarity, but to observe whether there are structural changes (structural break) in bank per-formance as a result of merger. This
analysis is performed to complement the IRF analysis on the mergers of Bank Mandiri, Bank Danamon, and Bank Permata. By doing this analysis, the authors hope that this study can contribute a more comprehensive in-terpretation of merger strategy in Indo-nesian banking industry.
Results and Analysis
The data stationarity testings us-ing the DF, PP, and KPSS approaches find that the data of performance vari-ables for the three banks used in the estimations are generally stationary in level.
Structural Break Analysis
The observation of structural breaks with the ZA test for each vari-able in each bank can be seen in the Table1.
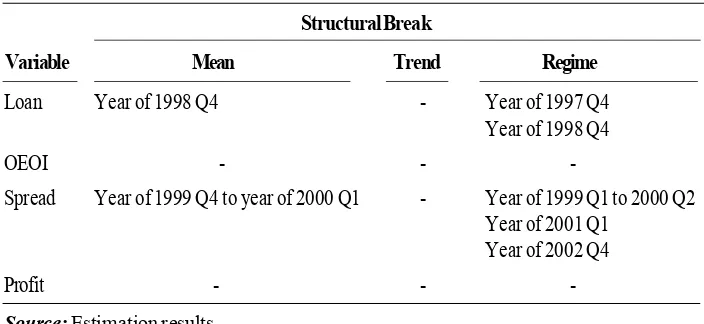
The Table 1 shows that there was a structural break from quarter 4 of 1997 to quarter 4 of 1998 in the time
series data of Bank Mandiri’s loans. If associated with events occurring at that time, it may be concluded that the 1997-1998 crisis has caused a struc-tural break to the credit/loan variable of Bank Mandiri. Meanwhile, the merger phenomenon in July 1999 did not cause a structural break to the loan variable of Bank Mandiri. Two other variables did not show any sign of structural break during the observation period (Q1 1993 until Q1 2009), implying that the 1997-1998 crisis and the merger phenomenon did not lead to a structural break in both variables. On the other hand, the spread variable experienced several structural breaks from Q4 of 1999 to Q1 of 2002. It can be con-cluded that the structural breaks are the response to the merger phenom-enon that occurred in July 1999 or Q3 of 1999. This means that the merger phenomenon can cause structural breaks to the performance variables of Bank Mandiri, particularly the spread variable.
Table 1. Structural Break Tests on Performance Variables of Bank Mandiri
Structural Break
Variable Mean Trend Regime
Loan Year of 1998 Q4 - Year of 1997 Q4
Year of 1998 Q4
OEOI - -
-Spread Year of 1999 Q4 to year of 2000 Q1 - Year of 1999 Q1 to 2000 Q2
Year of 2001 Q1 Year of 2002 Q4
-Similar to Bank Mandiri, Bank Danamon’s performance variables also experienced some structural breaks. Details of the structural breaks periods experienced by Bank Danamon during the observation period can be seen in Table 2.
Table 2 shows that the credit/loan variable experienced a structural break from quarter 3 of 1997 to quarter 1 of 1998. Meanwhile, two other variables, i.e., OEOI and profit did not show any sign of structural breaks during the observation period. The spread
vari-able experienced a structural break from quarter 1 to quarter 3 of 2000. This indicates, similar to the case of Bank Mandiri, that the spread variable of Bank Danamon experiences a struc-tural break as a response to the merger event that occurred in 2000, while three other variables do not respond the merger event. From the data observa-tion, the structural breaks to the loan variable are more a response to the crisis phenomenon than to the merger phenomenon.
Table 2.Structural Break Tests on Performance Variables of Bank
Danamon
Structural Break
Variable Mean Trend Regime
Loan Year of 1997 Q3 to year of - Year of 1997 Q3 to year of
1998 Q1 1998 Q1
OEOI - -
-Spread Year of 2000 Q1 to Q2 - Year of 2000 Q2 to Q3
Profit - -
-Source: estimation result
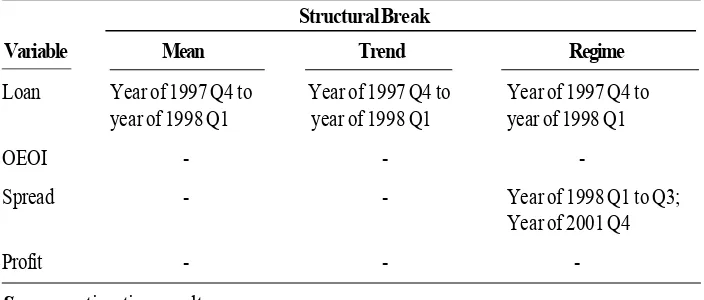
Table 3: Structural Break Tests on Performance Variables of Bank Permata Structural Break
Variable Mean Trend Regime
Loan Year of 1997 Q4 to Year of 1997 Q4 to Year of 1997 Q4 to
year of 1998 Q1 year of 1998 Q1 year of 1998 Q1
OEOI - -
-Spread - - Year of 1998 Q1 to Q3;
Year of 2001 Q4
Profit - -
Compared to the cases of Bank Mandiri and Bank Danamon, the struc-tural breaks prevalent in Bank Permata show a quite different pattern, espe-cially when associated with the merger event of Bank Permata in early 2002. The detailed observations of structural breaks in Bank Permata can be seen in Table 3.
Table 3 shows that the credit/loan variable of Bank Permata experienced structural breaks in the period of late 1997 to early 1998. Meanwhile, the spread variable experienced structural breaks from early 1997 to Q3 of 1998. These structural breaks reappeared in the end of 2001. The two other vari-ables, i.e., OEOI and profit, did not show any sign of structural breaks in the period of observation. The findings of structural breaks tests indicate that the performance variables of Bank Permata are not responsive to the merger event of the bank in early 2002.
This may indicate that Bank Permata is more sensitive to the shock of the 1997-1998 crisis than to the merger phenomenon in the 2000s.
Impulse Response Function
(IRF) Analysis
The IRF analysis is basically in-tended to observe the response of a variable when a shock occurs. In this study, merger is considered a shock to a bank, and hence, performance vari-ables will provide responses to the merger shock. The IRF diagrams in the subsequent part illustrate the responses of performance variables when a merger shock in the size of one stan-dard deviation occurs.
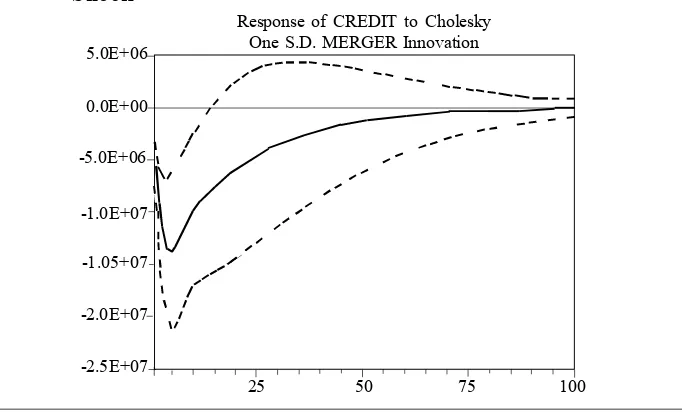
IRF Estimation for Bank Mandiri a. IRF of Credit Performance. IRF estimation of the credit/loan perfor-mance is shown in Figure 1.
Figure 1. Response of Bank Mandiri’s Credit Performance to Merger Shock
Response of CREDIT to Cholesky One S.D. MERGER Innovation 5.0E+06
0.0E+00
-5.0E+06
-1.05+07
Figure 1 depicts that if there is one standard deviation in merger shock, Bank Mandiri’s credit performance experiences a decrease in the initial period. After five periods (five quar-ters), credit shows a turning point and increases. It can also be seen from Figure 1 that as a result of one standard deviation in merger shock, Bank Mandiri needs an extensive phase of approximately 80 periods or 20 years to return to its stable condition as before the merger.
When associated with the charac-teristics of the banks merged into Bank Mandiri, i.e., Bank Dagang Negara, Bank Pembangunan Indonesia, Bank Ekspor Impor, and Bank Bumi Daya, the merger of Bank Mandiri is a merger of existed banks with quite significant strengths. Therefore, if there is a merger shock, it will take an extensive time to stabilize. This is consistent with the
organizational theories that the merger of several large corporations requires a longer time to rebuild after the merger due to significant adjustment issues of organizational culture and human re-sources compared to the merger of small companies.
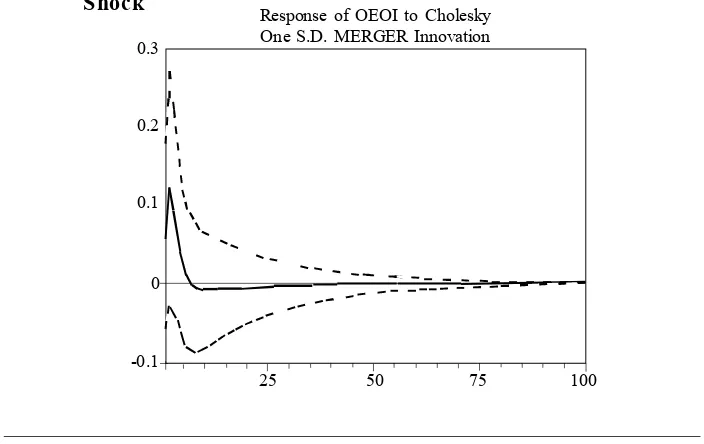
b. IRF of OEOI Performance. Some-what different from the credit perfor-mance, the OEOI variable in response to the merger shock requires less time to return to normal. The IRF estimation results of Bank Mandiri’s OEOI per-formance response to one standard deviation in merger shock can be seen in Figure 2. Figure 2 shows that in the event of a one standard deviation in merger shock, OEOI increases in the initial period, which means there is inefficiency, and after the merger con-tinues for about two quarters (half a year) the increase reaches its peak, and then the OEOI decreases.
Figure 2.Response of Bank Mandiri’s OEOI Performance to Merger Shock Response of OEOI to Cholesky
One S.D. MERGER Innovation
25 50 75 100
The decrease continues and then reaches a stable condition after the merger runs for about 26 quarters or six-and-a-half years. From this obser-vation, conclusion can be drawn that in response to the merger, the OEOI’s performance reaches the stable point faster than does the credit variable.
If OEOI is used as an indicator of bank efficiency, the response of Bank Mandiri’s OEOI performance to the merger provides a quite unique effi-ciency indicator. During the post-merger period, Bank Mandiri shows a worsening efficiency response; the OEOI strengthens (a positive reaction) then declines, and after six quarters (one-and-a-half years) of merger, the OEOI shows a negative reaction. This means that one-and-a-half years after the merger, Bank Mandiri’s OEOI undergoes an increase in efficiency performance due to the negative
re-sponse of OEOI. OEOI reaches a stable condition faster than does credit/ loan, indicating that the internal health performance of Bank Mandiri is rela-tively unaffected by the merger com-pared to its external performance in the form of credits.
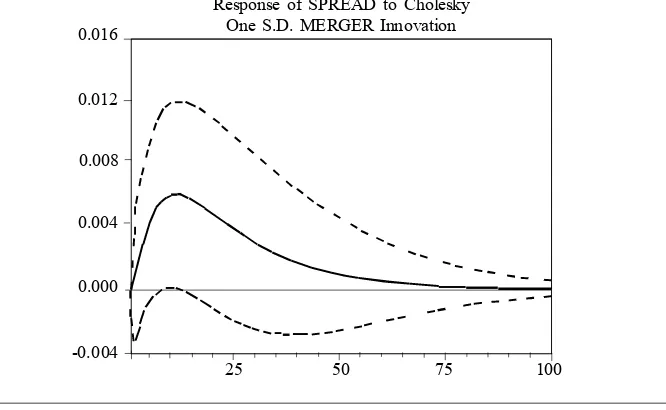
c. IRF of Spread Performance. Sub-sequently, it is found that the response of spread performance to the merger of Bank Mandiri corresponds with that of credit/loan variable. The response of spread performance variable to the merger shock can be seen in Figure 3 in which the reaction of spread to one standard deviation in merger shock is shown. The spread increases in the beginning, and it reaches its climax after 10 quarters (two-and-a-half years). It then decreases and reaches a stable position after 75 quarters or about 18 years. Unlike the OEOI, the reaction of spread is always positive. If
Figure 3.Response of Bank Mandiri’s Spread Performance to Merger Shock
Response of SPREAD to Cholesky One S.D. MERGER Innovation
spread is used as an indicator of effi-ciency, then the merger of Bank Mandiri decreases the efficiency until it reaches a stable condition.
This fact is very different from the case of OEOI performance, but rela-tively similar to the credit/loan perfor-mance. In the post-merger period, in order to achieve a stable condition, the credit variable will take approximately 20 years but is not responsive with respect to spread reduction. Under these circumstances, it can be con-cluded that if there is one standard deviation in merger shock, the credit and spread variables of Bank Mandiri will experience negative reactions until they achieve a stable condition.
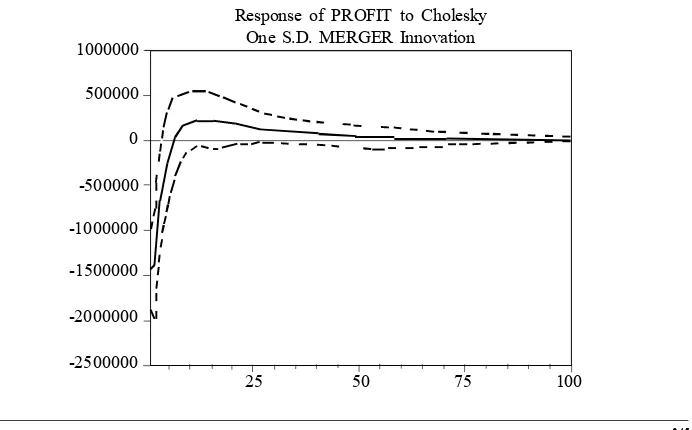
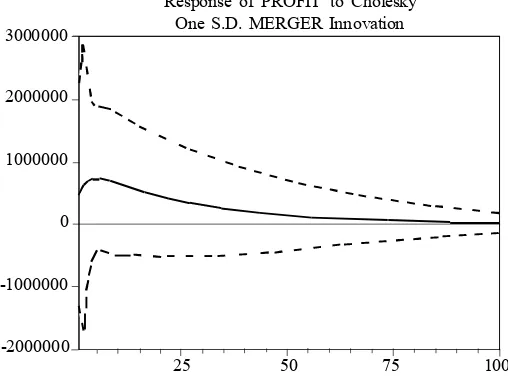
d. IRF of Profit Performance. The response of Bank Mandiri’s profit per-formance to merger shock shows a similar pattern when compared with
OEOI variable. Figure 4 below shows the reaction of Bank Mandiri’s profit performance to one standard deviation in merger shock. The profit variable reacts negatively in the beginning to the merger shock. However, unlike credit/ loan variable, this decline only lasts shortly. After two quarters (half a year), the decrease reaches its bottom and the profit variable begins increas-ing, and it achieves a positive point after the merger runs for six quarters. Furthermore, the profit movement is always positive and achieves a stable condition after 60 quarters (15 years). Compared to the credit and spread variables, the profit variable in response to the merger shock only requires a relatively short time to reach a stable condition.
If profit and OEOI are used as efficiency indicators of a bank’s
inter-Figure 4. Response of Bank Mandiri’s Profit Performance to Merger
Shock
Response of PROFIT to Cholesky One S.D. MERGER Innovation
25 50 75 100
-2500000 -2000000 -1500000 0 500000 1000000
nal health, then the similarity of profit’s and OEOI’s responses to the merger shock implies that the merger of Bank Mandiri is responded positively by the bank’s internal health. Meanwhile, if credit and spread are used as the indi-cators of external performance, the merger of Bank Mandiri is responded negatively until the bank reaches its stability in the post-merger period.
Results of IRF Estimation for Bank Danamon
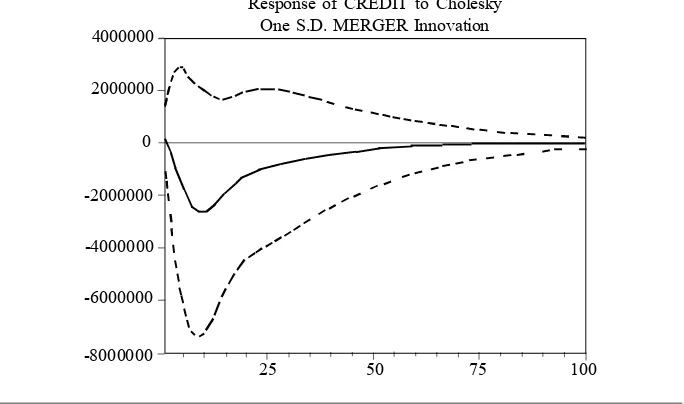
a. IRF of Credit Performance. The response of Bank Danamon’s perfor-mance to merger shock is relatively equivalent to that of Bank Mandiri. The pattern can be seen in Figure 5, which shows that if there is one standard deviation in merger shock, Bank Danamon’s credit/loan performance will impoverish or have a negative value in the initial period. After 10 quarters (two-and-a-half years), the
decline reaches its pit, and it then starts improving. Nevertheless, this increase never reaches a positive level, and it reaches the stable condition only after the merger runs for 76 quarters (19 years).
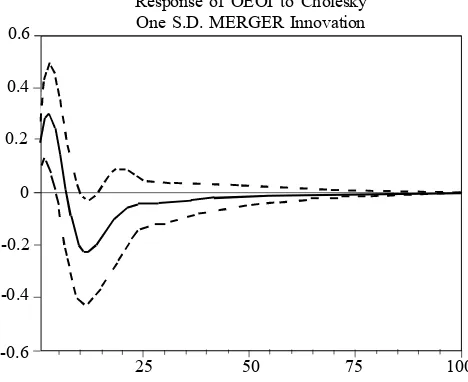
b. IRF of OEOI Performance. Dif-ferent from the credit/loan perfor-mance, the merger shock to Bank Danamon is followed by a more dy-namic response of OEOI performance. Details of the response of OEOI per-formance to one standard deviation in merger shock are described in Figure 6, showing that in the beginning, the OEOI increases and reaches its peak after the merger runs for five quarters. Afterwards, the OEOI declines and reaches its bottom 12 quarters after the merger. OEOI eventually reaches its stable condition after 40 quarters (10 years) of merger.
Figure 5. Response of Bank Danamon’s Credit Performance to Merger
Shock
Response of CREDIT to Cholesky One S.D. MERGER Innovation
-6000000 -4000000 0 2000000 4000000
The pattern of OEOI indicates that by using the OEOI indicator, the merger of Bank Danamon delivers a faster efficiency reaction compared to using the credit indicator. If OEOI is harnessed as an indicator of bank effi-ciency and internal bank health, then the merger of Bank Danamon yields a good internal efficiency since OEOI already shows a negative response to the merger shock within the period of six quarters (one-and-a-half years). c. IRF of Spread Performance. Simi-lar to the OEOI variable, the response of spread performance to the shock also has an expectedly good pattern. Figure 7 shows the response of spread performance variable to one standard deviation in merger shock. In the be-ginning, the response of spread to merger shock is positive (inefficient), but after two quarters (half a year) the response sees a turning point. It never
reaches a negative level after arriving at the stable condition when the merger has run for 50 quarters (12.5 years).
d. IRF of Profit. Slightly different from the case of Bank Mandiri, the profit performance of Bank Danamon never responds negatively to the merger shock. Graphically, the response of profit performance to the merger shock for Bank Danamon can be seen in Figure 8.
Since the beginning period, the response of profit has always been positive. After five quarters, the re-sponse reaches the climax and then the stable condition, which is after the merger runs for 80 quarters (20 years). Compared to that of Bank Mandiri, this pattern is quite different as Bank Danamon’s profit never produces a negative reaction such as found in Bank Mandiri.
Figure 6. Response of Bank Danamon’s OEOI Performance to Merger
Shock
Response of OEOI to Cholesky One S.D. MERGER Innovation
25 50 75 100
-0.6 -0.4 -0.2 0.2 0.4 0.6
Figure 7. IRF of Bank Danamon’s Spread Performance to Merger Shock
Figure 8. IRF of Bank Danamon’s Profit Performance to Merger Shock
Response of PROFIT to Cholesky One S.D. MERGER Innovation
25 50 75 100
Response of SPREAD to Cholesky One S.D. MERGER Innovation
25 50 75 100
-0.010 -0.005 0 0.010 0.015 0.020
0.005 0.025 0.030
IRF Estimation Results for Bank Permata
a. IRF of Credit Performance. The detailed response of credit performance to merger shock for Bank Permata is
The response of Bank Permata’s credit performance undergoes a dif-ferent pattern from those of Bank Mandiri and Bank Danamon. If Bank Mandiri and Bank Danamon respond
-2000000 0 1000000
performances until the stable condi-tion, the negative response of Bank Permata’s credit performance is only temporary, only for eight quarters (two years). After two years, the credit performance delivers a positive re-sponse until reaching the stable condi-tion in less than 15 years.
This pattern of credit performance is quite interesting since Bank Permata is a resulting merger of relatively small banks compared to Bank Mandiri and Bank Danamon. This pattern indicates that the merger of small banks could deliver positive credit performance rela-tive to the merger of large banks. If Figure 9. IRF of Bank Permata’s Credit Performance to Merger Shock
Response of CREDIT to Cholesky One S.D. MERGER Innovation
25 50 75 100
-2000000 0 1000000
-1000000 2000000 3000000
Figure 10. IRF of Bank Permata’s OEOI Performance to Merger Shock
Response of OEOI to Cholesky One S.D. MERGER Innovation
25 50 75 100
discussed within the managerial theory perspective, this is very possible as the merger of small corporations in general leads to less profound organizational conflicts so that the merger will deliver faster positive performance. In the case of Bank Permata, it seems that the consolidation after merger runs so fast that the bank management can immediately increase its credits/loans aggressively.
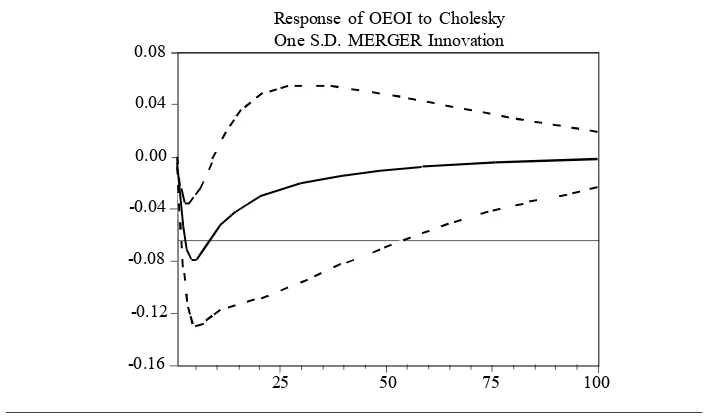
b. IRF of OEOI Performance. In line with the credit performance, the re-sponse of Bank Permata’s OEOI per-formance to the merger shock is nega-tive. As seen in Figure 10, the response of OEOI performance to one standard deviation in merger shock is always negative until it reaches the stable con-dition. This indicates that the merger of Bank Permata is reacted by a de-crease in OEOI performance or an efficient reaction. The stable condition is attained within a relatively long
pe-riod of time, i.e., 20 years. Since the OEOI’s response leads to an indication of efficiency, the long duration is prob-ably caused by the development of managerial innovations that improve efficiency.
c. IRF of Spread Performance. It seems that the response of spread performance to merger shock has the same pattern as that of OEOI perfor-mance. Figure 11 shows the response of spread performance to one standard deviation in merger shock for Bank Permata. As can be seen in the figure, the spread performance never reaches a positive level until it obtains the stable condition. In other words, an increase in spread never happens in responding the merger, implying that the merger of Bank Permata has created spread ef-ficiency. Somewhat different from the OEOI, the spread performance only requires a relatively short time, which is more than 12.5 years, to reach the Figure 11. IRF of Bank Permata’s Spread Performance to Merger Shock
Response of OEOI to Cholesky One S.D. MERGER Innovation
stable condition. With the response of performance always leading to effi-ciency direction, the length of time required to achieve the stable condition is expected to be much longer due to management innovations that always benefit or improve efficiency.
d. IRF of Profit Performance
The response of profit perfor-mance to merger shock for Bank Permata tends to provide an indicator that is consistent with the responses of other performances. The response of profit performance to one standard deviation in merger shock for this bank is shown in Figure 12. As can be observed in the figure, the profit vari-able never responds negatively to the merger shock. This is in accord with the response of other performance variables, where the credit/loan, OEOI, and spread variables always deliver the responses of efficiency.
Under these circumstances, it is reasonable that the profit never gives a negative response. Similar to OEOI, the profit variable also requires an extensive period to achieve the stable condition, which is more than 20 years. The conjecture is that it is caused by the managerial innovation processes that always improve efficiency.
Discussion
Based on the definition and con-cept shown in the Government Regula-tion No. 28/1999, the incorporaRegula-tion of Bank Mandiri is called a consolidation whereas the incorporations of Bank Danamon and Bank Permata are con-sidered mergers. The analysis of struc-tural breaks shows that the three merged banks, i.e., Bank Mandiri, Bank Danamon, and Bank Permata, have a vast array of patterns in responding the external shock of 1997-1998 crisis and Figure 12. IRF of Bank Permata’s Profit Performance to Merger Shock
Response of PROFIT to Cholesky One S.D. MERGER Innovation
25 50 75 100
the internal shock of mergers. The crisis shock seems to bring a similar shock that leads to structural breaks to the credit/loan variable of the three observed banks and to the OEOI vari-able for Bank Permata.
Different from the crisis shock, the merger shock does not lead to unified structural breaks to all perfor-mance variables of the three observed banks. The merger shock only causes structural breaks to the spread vari-ables of Bank Mandiri and Bank Danamon. The other three variables, i.e., credit, OEOI, and profit, of the three banks do not experience struc-tural breaks as a result of merger shock or crisis shock. Particularly for Bank Permata, the merger shock does not produce structural breaks to all ob-served variables.
Based on the patterns of struc-tural breaks occurrences, when spread is used as the indicator of external efficiency, then the mergers of Bank Mandiri and Bank Danamon create a shock to the external efficiency, lead-ing to structural breaks. Meanwhile, this phenomenon does not occur in the merger of Bank Permata since there is no structural break to all performance variables as a response to the merger. The IRF analysis seems to sub-stantiate the findings obtained from the structural break analysis. The IRF analysis, in general, finds that Bank Mandiri and Bank Danamon have a similar pattern. In their responses to the merger shock, the credit variables of Bank Mandiri and Bank Danamon
is a continuously negative response until they reach stability. Meanwhile, the response of Bank Permata’s credit variable to the merger shock is nega-tive in the beginning and turns posinega-tive not long afterwards until it reaches stability. The periods into stability also differ; the credit stabilities for Bank Mandiri and Bank Danamon are at-tained 20 years after the merger shock, while Bank Permata could achieve the credit stability in less than 15 years.
variable of Bank Permata shows a positive response, despite initially hav-ing a negative response. In managerial perspective, the merger of Bank Permata is inclined to strengthen its structure with less significant internal problems. Therefore, its management can immediately and aggressively make loans, leading to stability in a much quicker process.
The same thing happens to the spread variable. For Bank Mandiri and Bank Danamon, the spread variable responds positively to the mergers, and never responds negatively until it reaches stability. The positive response means that there is an increase in spread in the post-merger period, and it signals an indicator of inefficiency in producing outputs (loans). This phe-nomenon does not occur in Bank Permata.
Another interesting finding is the response of profit variable. The re-sponse of profit for Bank Mandiri is initially negative (decreasing income), but after eight quarters (two years) it becomes positive. This pattern of re-sponse is slightly different from that for Bank Danamon. The response of Bank Danamon’s profit never reaches the negative level, meaning that its reac-tion to the merger shock is always in the form of increasing profits.
If associated with the backgrounds of mergers, it appears that there are distinctions in the merger patterns of Bank Mandiri and Bank Danamon. The merger of Bank Mandiri is a con-solidation; four banks are merged with no trace of existence. On the other
hand, the unification of Bank Danamon is basically a merger; Bank Danamon still exists while the other banks are merged into it. It seems that this dis-tinction leads to the differences in profit performance; merger generates prof-its more quickly than does consolida-tion. When these results are inter-twined with organizational theory, it seems reasonable that organizations that get into the merger process are not as strong as those involved in the con-solidation process. Thus, merger has indeed a better profit response.
For Bank Permata, the response of spread variable to the merger yields efficiency. Similarly, the responses of other variables, i.e., OEOI and profit, also show an indication of efficiency in the post-merger period. Based on these findings, we may conclude that the merger of small banks is more likely to obtain a response of efficiency than the merger and consolidation among large banks and the merger of many banks.
Conclusions
perfor-mance response than do the consolida-tion of Bank Mandiri and the merger of Bank Danamon. The merger of Bank Permata does not cause performance shocks that lead to structural breaks, whereas the consolidation of Bank Mandiri and the merger of Bank Danamon produce structural breaks, especially in the spread performance. There are differences in the re-sponses of performances to merger shocks for the three observed banks. The differences are very likely due to the differences in backgrounds and characters of the banks involved in the mergers. The IRF analysis shows that in order to return to the stable condition,
the mergers of Bank Mandiri and Bank Danamon need a longer time than the time required by the merger of Bank Permata. This implies that the merger of small banks needs a relatively short period to return to the stable position. In addition, to be stable, the merger does not suffer from decreasing perfor-mance. In contrast, for large banks, the process toward stability takes a longer time and experiences a stage of perfor-mance decreases. For the merger of large banks, the mergers and acquisi-tions (retaining one existing bank) will deliver better performance responses than will the consolidations (no existing bank).
References
Allen, D., and Boobal-Batchelor. 2005. The role of post-crisis bank mergers in enhancing efficiency gains and benefits to the public in the context of developing economy: evidence from Malaysia. Working Paper. Edit Cowan University and Monash University.
Besanco, D., D. Dranove, M. Shanley, and S. Schaefer. 2004. Economics of Strategy (3rd ed.).
John Wiley & Sons.
Calomiris, C. W., and T. Pornrojnangkool. 2005. Monopoly-creating bank consolidation? The merger of fleet and Bank Boston. NBER Working Paper Series No. 11351: 1-35. Carletti, E., P. Hartmann, and S. Ongena. 2006. The economic impact of merger control: What
is special about banking?” Working Paper. European Central Bank.
Cerra, V., and S. C. Saxena. 2008. Growth dynamics: The myth of economic recovery. American Economic Review 98 (1): 439-457
Dymski, G. A. 2002. The global bank merger wave: Implications for developing countries. Working Paper. Department of Economics, University of California.
Enders, W. 2004. Applied Econometrics Time Series (2nd ed.). John Wiley & Sons, Inc
Gorton, G., M. Kahl, and R. Rosen. 2005. Eat or be eaten: A theory of mergers and merger waves. Working Paperseries (11364). The National Bureau of Economic Research. Gujarati, D. N. 2003. Econometrics (4th ed.). McGraw-Hill, New York
Gujarati, D. N. and D. C. Porter. 2009. Econometrics (5th ed.). McGraw-Hill, New York
Koetter, M. 2005. Evaluating the German bank merger wave. Discussion Paper Series 2: Banking and Financial Studies (12). Deutsche Bundes Bank.
Koskela, E., and R. Stenbacka. 2000. Bank merger and the fragility of loan market. Finnish Economic Papers 13 (1): 3-18.
Kwiatkowski, D., P. C. Phillips, P. Schmidt, and Y. Shin. 1992. Testing the null hypothesis of stationarity against the alternative unit root. Journal of Econometrica 54: 159-178. Mardanugraha, E. 2005. Efisiensi perbankan Indonesia dipelajari melalui fungsi biaya
parametrik. Disertasi (unpublished).
Martin, S. 1994. Industrial Economics: Economic Analysis and Public Policy (2nd ed.).
Macmillan Publishing Company, New York.
Perron, P., and P. C. B. Phillips. 1988. Testing for a unit root in time series regression. Biometrika 78 (2): 335-346.
Perron, P. and T. J. Vogelsang, 1992. Nonstationarity and level shift with an application to purchasing power parity. Journal of Business and Economic Statistics 10: 301-320. Perron, P. 1997. Further evidence on breaking trend functions in macroeconomics variables.
Journal of Econometrics, Vol. 80, pp. 355-385
Samosir, A. P. 2003. Analisis kinerja Bank Mandiri setelah merger dan sebagai bank rekapitalisasi. Kajian Ekonomi dan Keuangan 7 (1).
Steensma, K. H., J. Q. Barden, C. Dhanaraj, M. Lyles, and L. Tihanyi. 2004. The influence of power, learning, and conflict on the internalization of international joint venture. Academy of Management Best Conference Paper: 1-6
Weber R. A., and C. F. Camerer. 2003. Cultural conflict and merger failure: An experimental approach. Management Science 49 (4): 400-415.