* corresponding author: [email protected]
The correlation between the intensity of
benzene exposure and complete blood count
in the oil and natural gas company workers
in East Kalimantan
Idha Arfianti Wiraagni1*, Iwan Dwiprahasto2, Ngatidjan2
1Department of Forensic and Medicolegal, 2Department of Pharmacology and Therapy,
Faculty of Medicine, Universitas Gadjah Mada, Yogyakarta, Indonesia
ABSTRACT
Benzene is one of the dangerous chemical substances which can cause some health disturbances. Meta-analysis shows that people who are exposed to benzene have a leukemia risk of 1.4 times more than the ones who are not. The employees who are exposed to benzene for a long time have a probability to receive the toxic effect from benzene. This study was conducted to evaluate the relationship between the intensity of benzene exposure and blood count of employees in the oil and natural gas company in East Kalimantan. This research was conducted to 897 employees with case control design. The control group consisted of 521 subjects, whereas the case group consisted of 376 subjects. The subjects were 39.91±10.90 years old, with the working term between 1 to 36 years. Data were obtained from routine medical check-up and health risk assessment in 2007 – 2010. The independent variable namely benzene exposure and the dependent variable namely result of blood count, were analyzed by using chi-square bivariat analysis. Intensity of benzene exposure was measured as OVM (Organic Vapour Monitor) for external dosage and SPMA (S-phenylmercapturic acid) for internal dosage. The intensity of benzene in 2007 was 1.07± 5.5 ppm (OVM) and average of SPMA was 11.54±5.28 ìg/g creatinine. The intensity of benzene in 2009 was 4.15±13.6 ppm (OVM) and SPMA was 55.90±43.6 ìg/g creatinine. The employees who were exposed to benzene had a risk of having a decrease of either hemoglobin, erythrocyte, thrombocyte, or leukocyte 1.71 times (95% CI, 1.18–2.48) compared with the control, although this reduction was still in the normal range (p= 0.004). In conclusion, there was no relationship between the intensity of benzene exposure with the low blood count of the employees.
ABSTRAK
benzena rata-rata pada tahun 2009 adalah 4,15±13,6 ppm (OVM) dan 55.90 ± 43,6 mg/g creatinine (SPMA). Karyawan yang terkena benzena memiliki risiko untuk mengalami penurunan dari salah satu komponen darah berikut yaitu hemoglobin, eritrosit, trombosit, atau lekosit 1,71 kali (95% CI: 1,18-2,48) dibandingkan kontrol, meskipun degradasi ini masih dalam kisaran normal (p=0,004). Namun, tidak terdapat hubungan antara intensitas paparan benzene dengan rendahnya hasil hitung jenis darah.
Keywords: benzene exposure - complete blood counts - oil and gas earth - mining - toxic effect
INTRODUCTION
Benzene is a chemical substance that is widely used in industrial setting, ranging from solvent to gasoline additives. Benzene is found in the air out of the emissions from cigarette smoke, motor vehicle exhaust, burning coal and oil, and gasoline service stations.1Although benzene is widely used in industrial setting, it has a toxic effect on the system of hematology, reproduction and neurology. Workers who are overexposed chronically can be inflicted to anemia, leucopenia, and thrombocytopenia. The peripheral blood morphology shows some immature leukocyte such as band, meta-mielocyte, meta-mielocyte, or mieloblast.2
Moreover, benzene is a cancer-causing carcinogen in workers exposed to high levels of workplace air.3Hundreds of leukemia cases caused by benzene exposure have been reported from some industries, such as shoes industry, paint industry, and charcoal industry.4 The occurrence of leukemia caused by benzene needs a long time exposure. Adele et al.5 reported that it needed 50 years of benzene chronic exposure with average 71.8 ppm/day for someone to suffer leukemia. However, epidemiological study shows that the leukemia cases increase gradually among the workers who work in high levels of benzene exposure.
Benzene is one of the best studied of the known leukemia. However, the mechanism of
benzene-induced leukemia has not been well postulated. Several hypotheses have been proposed by some authors. It seems likely that benzene has multiple effects consisting one or more of the current hypotheses. The most probable mechanism of benzene-induced leukemia is through its phenolic metabolites acting in concert to produce DNA damage. This leads to mitotic recombination, chromosome translocations, and aneuploidy. These genotoxic events will, in turn, cause the activation of protooncogenes, loss of heterozygosity, and inactivation of tumor suppressor genes. If this takes place in the bone marrow stem, a leukemic clone with selective growth advantage can arise. Epigenetic effects of benzene on the bone marrow stroma can then assist in the establishment of a leukemic clone.6,7
MATERIALS AND METHODS
This was an observational study using case control design. This study was conducted on the employees of an oil and natural gas company in East Kalimantan who were exposed to benzene. Secondary data were obtained from routine medical check-up and health risk assessment. All the employees of the oil and natural gas company were involved in this study after applying the inclusion and exclusion criteria. The inclusion criteria for the study was any permanent and active employees who had routine medical check-up data and complete health risk assessment in the last 4 years. The exclusion criteria was subjects who had undergone acute bleeding, had been hospitalized, had been diagnosed to have TBC, typhoid fever, diabetes mellitus, stroke or non-leukemic viciousness, when interviewed.
A total of 897 employees were selected in this study. After being matched, they were divided into two groups referred to as case group (521 subjects) and control group (376 subjects). The case group was employees who had been exposed to benzene in the workplace. They worked as operator, production operator and mechanic. The control group was employees who were not exposed to benzene in the workplace.
Dependent variables in this study were blood count results (hemoglobin, leukocyte number, platelet number, and erythrocyte number). Independent variables were benzene exposure intensity, benzene degree, self protective equipment usage, and S-phenylmercaptopuric acid (SPMA) degree. Additional variables were age, gender, body mass index, smoking habit, SGOT degree, SGPT, and blood creatinine.
Benzene exposure in the workplace air was classified as highly exposed and low exposed.
The measurement of benzene exposure was conducted by using equipment SKC 575 Series Passive Sampler which was known as OVM (organic vapors measurement). Internal dosage was calculated with urine S-phenylmercapturic acid (SPMA). The SPMA degree was measured by using GC-MS system, in the end of the shift, after 8 hours of working. If the degree was e” 25 ìg/g creatinine, it was classified as high
exposure.8
Blood count including hemoglobin, leukocyte number, platelet number, and erythrocyte number, was counted by using automatic counter. Disorder of blood element was determined when the assessment result was not in a normal range in the routine hematology assessment. Bicytopenia was a degradation of 2 out of 4 parameters of complete blood count such as leucopenia and anemia, leucopenia and erythropenia, thrombocytopenia and anemia, or combination of other degradations. It was considered as abnormal if there were size, form, and color which should not exist, such as band form that was more than 10%, metamielocyte, reactive limphocyte, or mieloblast.8-11
Data was analyzed with univariate and bivariate analysis. Univariate analysis was conducted to analyze data with interval/ratio scale. Bivariate analysis used chi-square test when both dependent and independent variable were categorical data (nominal/ordinal). All statistical analysis was considered significant at p < 0.05.
were not analyzed in detail because there was not any quantitative measurement for both gases. This research protocol has been approved by the Medical and Health Research Ethics Committee, Faculty of Medicine, Universitas Gadjah Mada, Yogyakarta.
RESULTS
Research subject was 39.91±10.90 years old, with the youngest was 21 and the oldest was 59 years old. The working term of the employees varied between 1 to 36 years. The average of BMI for 4 years was in the normal category. Some of the smoking employees (66.4%), consumed various number of cigarettes, from 1 to 24 cigarettes per day. The average of SGOT, SGPT, urea, creatinine, for 4 years was in the normal range.
There were 213 people who were exposed to benzene, whereas 684 people were not exposed to it. The number of bachelor employees was only 9.9% from the total employees. Majority of the workers were male (94.5%) and the number of non-bachelor employees was 87.9%. Working areas were spread in several locations namely A, B, C, D, E and F. The mining which had the most employees was the B location, i.e. 185 people. Although bicytopenia occurrence was observed in the company, its occurrence was the lowest (0.1-0.3%), while anemia occurrence was the highest (20.6%), followed by erythropenia (15.9%), thrombocytopenia (4.3%), leucopenia (1.6%).
Benzene exposure can cause degradation of one of the complete blood count such as erythropenia, leucopenia, anemia, or thrombo-cytopenia. This research analyzed the degradation tendency of one of the peripheral blood counts for 3 years in succession although it was still in a normal range. It aimed to keep
being on guard against the degradation of complete blood count up to under normal limit, even bicytopenia or pancytopenia. Employees who were exposed to benzene had a risk to have a degradation of one of the complete blood count for 3 years in succession, i.e. 1.71 times higher (95% CI: 1.18 – 2.48) compared to those who were not exposed to benzene (p < 0.05). A bivariate analysis was performed to another additional variable that could influence the degradation of blood count. All results do not have a significant relationship (p > 0.05).
Some complete blood count results showed that there were abnormalities, such as bicytopenia, anemia, thrombocytopenia, leucopenia, and erythropenia. Bicytopenia consisted of 3 kinds of abnormalities i.e. leucopenia and thrombocytopenia, leucopenia and erythropenia, or erythropenia and thrombo-cytopenia. Leucopenia and thrombocytopenia risk and erythropenia and thrombocytopenia risk between the exposed and the unexposed group, still could not be concluded due to the insufficient number of sample in bicytopenia case that was exposed to benzene. Leukopenia and erythropenia risk for the group that was exposed to benzene 1.61 (95% CI: 0.15-17.83) times higher than those who were not exposed, however it was not statistically different (p > 0.05).
for 1 year was 20.7% and for 2 years in succession was 1.1%. Anemia risk for 1 year in the benzene exposed group was 1.20 (95% CI: 0.24–3.16) times higher than those who were not exposed, however it was not statistically different (p > 0.05). Anemia risk for 2 years in succession in the benzene exposed group was 2.16 (95% CI: 0.61–7.74) 2.16 (95% CI: 0.61 – 7.74) times higher than those who were not exposed, however it was not statistically different (p > 0.05). Erythropenia case for 1 year was 15.9% and for 2 years in succesion was 0.5%. Erythropenia risk for 1 year in the benzene exposed group was 1.15 (95% CI: 0.76-1.73) times higher than those who were not exposed, however it was not statistically different (p > 0.05). Erythropenia risk in benzene exposed group was 2.15 (95% CI: 0.36– 12.96) times than those who were not, however it was not statistically different (p > 0.05).
Benzene exposure intensity in this research was measured with OVM and SPMA. OVM is an equipment to measure benzene external dosage that is received by employees. SPMA is benzene internal dosage that was measured from the employee’s urine after being exposed to benzene. The result of benzene intensity measurement could be concluded well, if OVM and SPMA measurement were performed entirely to employees who were exposed to benzene and to some employees who were not exposed to benzene as a control. Then, the result was analyzed and related to some blood disorders occurrence.
In this research, OVM and SPMA measurement was performed in the year 2007 and 2009. Sampling was performed randomly in each location, however the number of sample examined was relatively low compared to the total employees that were exposed to benzene. Therefore, the number of OVM and SPMA were not sufficient to be analyzed and the relationship between benzene exposure intensity with blood count disorder could not be concluded. Some toxicology causality principles, such as the absence of the causal relationship between the dosage amount and disorder level, and the level of relationship strength between cause and effect, also could not be concluded in this research.
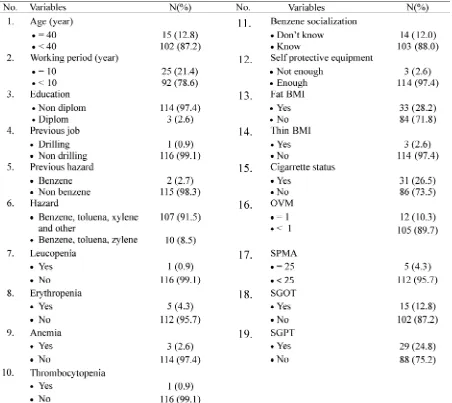
The research subjects of OVM and SPMA in the year 2007 were 117 employees. Research subjects had an average age of 29.38 ± 8.43 years. Working term of the employees was various, between 1 to 32 years. SPMA degree in urine was various from 0.8 to 47 ìg/g creatinine, although the average was normal, i.e. 11.54 ± 5.28 ìg/g creatinine. Benzene degree from OVM was varied from 0.1 to 52.3 ppm, the average was above normal, i.e. 1.07 ± 5.5 ppm. The average of BMI was in normal category, i.e. 23.38 ± 3.10. Some of the smoking employees, with the number of cigarette consumed varied from 1 to 20 cigarettes per
day. Complete description of base
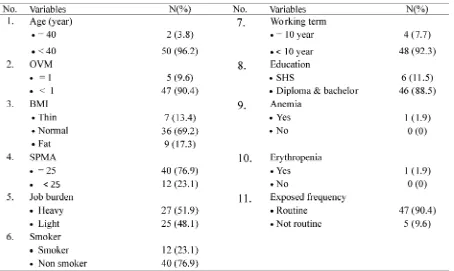
The research subjects of OVM and SPMA were 52 employees. The average age of the research subjects was 25.62 ± 6.51 years. SPMA degree in urine was various from 12 to 412 ìg/g creatinine, the average was above normal, i.e. 55.90 ± 43.6 ìg/g creatinine. Benzene degree from OVM was various from 0.1 to 59.5 ppm, the average was above normal,
i.e. 4.153 ± 13.600 ppm. BMI average was in a normal category, i.e. 22.39 ± 3.52. The average of benzene exposed duration was 111.98 ± 120.00 minutes, the fastest was 3 minutes and the longest was 480 minutes. The complete description of base characteristic proportion was showed in TABLE 2.
TABLE 1. Proportion of subject base characteristic for OVM (organic vapour monitor) and SPMA
TABLE 2. Proportion of subject base characteristic for OVM (Organic Vapour Monitor) and SPMA
(S-phenylmercapturic acid) in 200910
Some complete blood count revealed blood disorders such as anemia, thrombocytopenia, leucopenia, and erythropenia. Bivariate analysis was performed to analyze the relationship between benzene degree (OVM and SPMA) with the blood disorders. Due to the insufficient number of OVM and SPMA samples, the relationship between benzene exposure intensity and the disorders of blood count could not be concluded.
Relationship between the high degree of SPMA and OVM, with the occurrence of leucopenia, anemia, and thrombocytopenia was not statistically different (p > 0.05). Risk of leucopenia, anemia, and thrombocytopenia in the group with high SPMA and OVM compared to the low group still could not be concluded due to insufficient the number of samples in leucopenia, anemia, and thrombocyto-penia case with high OVM and SPMA.
Five erythropenia cases in the research subject were observed in this study. The relationship between the high SPMA degree, with the occurrence of erythropenia was not statistically significant (p > 0.05). Erythropenia risk in the group with high SPMA compared to the low group cannot be concluded due to insufficient number of sample in erythropenia case with high SPMA degree. Erythropenia risk in the group with high OVM was 2.30 (95%CI: 0.24-22.40) times than the low OVM, however it was not different statistically (p > 0.05).
erythropenia was not statistically significant (p > 0.05). The risk of anemia and erythropenia in the high SPMA and OVM group compared to the low group could not be concluded due to the insufficient number of samples.
Benzene exposure can cause degradation of one of complete blood count result, such as erythropenia, leucopenia, anemia, or thrombo-cytopenia. Moreover, it can also cause bicyto-penia, pancyto-bicyto-penia, or disorders or peripheral blood morphology. In this research, the degradation of one of peripheral blood morphology tended to increase during 3 years obsevartion consecutively. However, the complete blood count value was still in a normal range. The tendency of degradation of one of peripheral blood morphology was analyzed for 3 years in succession, although it was still in a normal range. This aims to keep the guard on the decrease of complete blood count to below the normal limit, even bicytopenia or pancytopenia.
Intensity of benzene exposure in this research was measured with OVM (external dosage) and SPMA (internal dosage). The result of the benzene intensity measurement could be concluded well, if the measurement OVM and SPMA was performed entirely to the employees who were exposed to benzene and to some employees who were not exposed to benzene as a comparison. In this research, the measure-ment of OVM and SPMA was performed in 2007 and 2009. Sampling was performed randomly in each location, although the number of sample checked was still small compared to the total employees who were exposed to benzene. The number of OVM and SPMA sample was not sufficient, so the relationship between the benzene intensity with blood count disorders still could not be concluded. Some toxicology causality principles, such as the absence of cause-effect relationship, dosage response relationship, temporality, level of disorders
impacted, level of relationship strength between cause and effect, could not be concluded in this research.
The occurrence of blood count degradation, like anemia (20.6%), leucopenia (1.6%), thrombo-cytopenia (4.3%), erythropenia (15.9%), bicytopenia (0.1-0.3%) also happen-ed, although for 1 year only, the number was few and insignificant. Bivariate analysis pointed out that the relationship between benzene exposure and the appearance of erythropenia, thrombocytopenia, leucopenia, and anemia was not statistically significant (p > 0.05). It means that chronic benzene exposure in the production process in an oil and natural gas company in East Kalimantan, has not caused the number degradation of erythrocyte, leukocyte, platelet, and haemoglobin. Bivariate analysis analyzed that the relationship between benzene exposure and the appearance of bicytopenia could not be concluded, because the sample number in bicytopenia case was not sufficient. Employees that were exposed to benzene had risk to have degradation of one of complete blood count for 3 years in succession (still in a normal range) was 1.71 times higher (95% CI: 1.18 – 2.48) compared to those who were not exposed to benzene (p < 0.05).
DISCUSSION
This research result is in accordance to Collinset al.12 research, where there were not any differences of the blood cell number between two groups of employees who were exposed to benzene 0.01-0.04 ppm and the employees who were not exposed to benzene. According to WHO13, a study result shows that chronic benzene exposure 0.009-1.4 ppm does not cause the occurrence of blood count result degradation.
employees in a company in Semarang with benzene degree in the air of the work place was around 7-17 ppm with average duration of work 8.25 years.14Therefore, there was degradation of erythrocyte number without leukocyte and platelet number degradation. Lanet al.15showed that employees of shoes factory in China who were exposed to benzene <1 ppm had lower leukocyte and substantial platelet number compared to control group.
Askoy16 reported that there was pan-cytopenia and leukaemia case of factory’s workers in Turkey as the result of benzene exposure 150-210 ppm and sometimes reaching 650 ppm, after working for 2-35 years. Rothman et al.17showed that there was degradation of erythrocyte, leukocyte, platelet, and hemoglobin to benzene exposed workers in China with the exposure level 1-328 ppm.
Further explanation to employees that experience degradation of erythrocyte, leuko-cyte, platelet, bicytopenia, even pancytopenia as a result of low concentration of benzene chronic exposure (<1 ppm), shows certain genotype varieties, i.e. polimorphism enzim myeloperoksidase (MPO-463GG), NAD(P)H quinone oxidoreductase (NQO1-465CT), CYP2E1, GSTM1, and GSTT1.15The genotype variety causes someone to be more vulnerable to have benzene toxication, although being exposed to benzene with low concentration (<1ppm). In this research, genotype variety check up of MPO-463GG, CYP2E1, GSTM1, GSTT1 and NQO1-465CT was not conducted. For this reason, it could not be explained whether the absence of degradation of blood count result to chronic benzene exposed employees, was caused by the absence of gen variants.
Another factor that can affect the appearance of disorders as the result of benzene exposure is the high benzene exposure concentration. The higher the benzene exposure dosage, the higher
the possibility of the disorder appearance is. Next factor is exposure period. The longer the benzene exposure, the higher the possibility of disorder appearance is—the period is very various, from 5 to 25 years. Less K3 application also affects the problem. The example of less K3 application is because the company still underestimates the danger of benzene, there is not any policy about benzene, and employees do not wear breath protector equipment properly.13,17
In this research, the measurement of OVM and SPMA was performed randomly in 2007 and 2009. Sampling was done randomly in each location, but the sample number checked was still small compared to the total employees who were exposed to benzene. The sample number of OVM and SPMA was not sufficient to be analyzed. The complete blood count of subjects that was checked by OVM and SPMA was certainly not conducted completely. The following discussion describes OVM and SPMA exclusively, and is not related to research subject in peripheral complete blood count that is discussed in another chapter. Therefore, the relationship between benzene intensity with blood count disorder still could not be concluded.
Value limit for benzene according to ACGIH8 is 0.5 ppm (1.6 mg / m3) for working in average for 8 hours a day and 40 hours a week. Indonesian government decides NAB Benzene is 10 part per million (ppm) according to Letter Release from the Minister of Labors dan Transportaton and Cooperative Nomot SE 01/Men/1997 about the number of value limit of chemical substances. Australia, Denmark, Finlandia, Japan and Netherland tend to decrease NAB benzene from 10 ppm to 1 ppm. This research uses NAB 1 ppm standard.
than normal, i.e. 1.07±5.5 ppm, while the proportion of abnormal OVM value was 12 (10.3%) people. Benzene degree from OVM 2009 was various from 0.1 to 59.5 ppm, whereasthe average was more than normal, i.e. 4.153+13.6 ppm. The proportion of abnormal OVM was 5 (9.6%). The measurement was performed once only in the year 2007 and 2009. The measurement in year 2007 and 2009 showed that the average of benzene degree was above NAB, which had possibility to cause bad effect to the employees.
Some other researches show different degree in every measurement. Based on Collins et al.12 research, workers were exposed to
benzene in the range 0.01-1.4 ppm compared those who were not exposed. Research by Lan et al.15showed that shoes factory workers in China were exposed to benzene <1 ppm. Tusmiyati14reported that workers in Semarang worked with benzene degree in the air of work area was around 7-17 ppm.13Aksoy16reported that there was benzene exposure 150-2210 ppm and sometimes reaching 650 ppm after working for 2-35 years. This variety of benzene degree depends on several things, like the type of job, the kind of benzene source in the work field, the kind of measurement equipment, the measurement method, etc.
SPMA degree in urine sample which was taken in the end of working hour can be an indicator of reliable benzene exposure for one shift working with exposure concentrate reaching 0.1 ppm.18-21Biological exposure limit that is allowed or Biological Exposure Indices (BEI) for benzene using biomarker SPMA in urine in the end of working shift for 8 hours working period was 25 mg /g creatinine.
SPMA degree of 2007 in urine was various from 0.8 to 47 ìg/g creatinine, although the average was normal, i.e. 11.54+5.28 ìg/g creatinine. Proportion of abnormal SPMA value in 2007 was 5 (4.5%). In contrast, SPMA value
in 2009 in urine was various from 12 to 412 ìg/ g creatinine, while the average was more than normal, i.e. 55.90±43.6 ìg/g creatinine, with abnormal value of 40 (76.9%).
Proper K3 application enables the number of benzene that enter the workers’ body in a safe level, which can be proved from the result of normal urine SPMA measurement in 2007.21 Although chronic benzene exposure in the company is beyond NAB, benzene that could enter the body was not much (under normal level), especially because proper breath protector usage (respirator), thus it did not cause blood count degradation in the workers who were exposed to benzene in the oil and natural gas company in East Kalimantan. Respirator that could be used by employees in the company was half mask or full mask which was equipped cartridge as chemical fume absorber. Besides, there was a warning board about the danger of benzene, toluene, xilene which was placed around benzene, toluene, and xilene sources.
Measurement method factor, such as: contaminated sample when storing, sample delivery to laboratorium, and placement of sampling equipment in breath zone can also affect it.
CONCLUSION
This research showed that employees who are exposed to benzene have risk of degrada-tion of either hemoglobin, erythrocyte, platelet, or leukocyte 1.71 times higher compared to those who are not exposed to benzene, however it is still in normal range and not statistically sig-nificant. Moreover relationship between ben-zene exposure intensity and the low blood count result has not been found.
Some advices that can be given are that the complete blood count check up and OVM, and SPMA need to be performed to all employees who are exposed to benzene. In addition, entire socialization about benzene program to employees needs to be conducted, as well.
ACKNOWLEDGEMENTS
The authors express gratitude to all people who helped in the process of this thesis completion. Many thanks for all lecturers and supporting staffs who always guide, educate, and help the authors to finish this thesis. The authors also express sincere gratitude to all directors and employees in the oil and natural gas company in East Kalimantan who have allowed, helped, and facilitated the authors in the data collection process.
REFERENCES
1. Agency for Toxic Substances and Disease Registry
(ATSDR). Toxicological profiles for benzene (Draft for public comment). Atlanta: Public Health Service, 2007.
2. Scott RM. Chemical hazard in the workplace.
Michigan: Lewis Publishers, 1989.
3. Mc. Donald TA, Holland NY, Skibola C, Duramad
P, Smith MT. Hypothesis: phenol and
hydroquinone derived mainly from diet and gastrointestinal flora activity are causal factors in leukaemia. Leukemia 2001;15(1):10-20.
4. Khalade A, Maritta SJ, Jaakkola JK, Eero P.
Exposure to benzene at work and the risk of leukaemia: A systematic review and meta-analysis. Environ Health 2010; 9:31-7.
5. Adele SC, Quinn M, Consonni D, Zappa M.
Exposure to benzene and risk of leukaemia among shoes factory workers. Scand J Work Environ Health 2003; 29(1):51–9.
6. Smith MT. The mechanism of benzene-induced
leukemia: a hypothesis and speculations ont he sauses of leukemia. Environ Health Perspect 1996; 104(Suppl 6):1219-25.
7. Au WY, Priscilla B, Caguioa, Chuah C, Hsu SC,
Jootar S, et al. Chronic myeloid leukaemia in Asia. Int J Hematol 2009; 89(1):14–23.
8. American Conference Govermental Industrial
Hygienist (ACGIH). Threshold limit values for chemical substances and physical agents and biological exposure indices. Cincinnati: ACGIH Secretary, 2007.
9. World Health Organization. Benzene, toulena,
xylenes. Geneva: International Programme on Chemical Safety, 2005.
10. Williams DM. Pancytopenia, anemia aplastic and pure red cell aplasia. In: Lee GR, Bithell TC, Foerster J, Athens JW, Lukens JN, editors.
Wintrobe’s Clinical Hematology. 9th ed.
Philadephia: Lea and Febiger, 1993:1233-63.
11. Occupational Health File. Health risk assessment file. Kalimantan Timur: Health and Safety Departement, 2010.
12. Collins JJ, Conner P, Friedlander BR. A study of the hematologic effects of chronic low-level exposure to benzene. J Occup Med 1991; 33(5):619-26.
13. World Health Organization. Benzene, toulena, xylenes. Geneva: International Programme on Chemical Safety, 2000.
14. Tusmiyati T. Faktor-faktor risiko keracunan benzene pada tenaga kerja di CV. Laksana Semarang [Tesis]. Yogyakarta: Fakultas Kedokteran Universitas Gadjah Mada, 1998.
15. Lan Q, Zhang LG,Vermeulen R, Weinberg RS,
Docemeci M, Rappaport SM,et al.Hematotoxicity
16. Aksoy M. Hematotoxicity and carcinogenicity of benzene. Environ Health Perspect. 1989; 82:193-7. 17. Rothman N, Smith MT, Hayes RB, Li GL, Iron RD. Dosemeci M. An epidemiologic study of early biologic effects of benzene in Chinese workers. Environ Health Perspect. 1996; 104:1219–25. 18. Yaris F, Dikici M, Akbulut T, Yaris E, Sabuncu H.
Story of benzene and leukaemia: epidemiologic approach of Muzaffer Aksoy. J Occup Health. 2004; 46 (3):244-7.
19. Qu Q, Cohen BS, Shore R, Chen LC, Li G, Jin X, et al. Benzene exposure measurement in shoe and
glue manufacturing: A study to validate bio-markers. Appl Occup Environ Hyg 2003; 18(12): 988-98.
20. Lauwerys RR dan Hoet P. Industrial chemical exposure, guideline for biological monitoring. 3rd
ed. New York: Lewis Publishers, 2001.