CURRENCY EXCHANGE RATE FORECASTING USING ARTIFICIAL NEURAL NETWORKS
BACKPROPAGATION METHOD
Difana Meilani, Andalas University – Padang, Indonesia Ivan Richardo, Andalas University – Padang, Indonesia
ABSTRACT
Since 1997, the rupiah currency has a tendency to change at any time since the economic crisis that hit Indonesia. One of the currencies of the most widely traded on international exchange market is the U.S. dollar. This paper will forecast the exchange rate by using back propagation neural networks. Variables that affecting currency exchange rates is inflation, gross national product and interest rates. After performing data processing with the help of software VB.net forecasting results and forecasting program will be displayed online using PHP to construct the webpage.
Keywords: currency exchange rates forecasting, back propagation, webpage design
INTRODUCTION
Currency exchange rate is the ratio of a country's currency with another country's currency. Currency is also a macro-economic variables that very important, because exchange rates can maintain economic stability in a region or country (Muhammad, 2010). One of the currencies of the most widely traded in the international exchange market is the U.S. dollar. In Indonesia, Dollar was used as one
indicator in designing the State Budget. Since 1997, the rupiah currency has a tendency to change at any time since the economic crisis that hit Indonesia.
done by the Jakarta Stock Exchange, but not shown on the Jakarta Stock Exchange website, so to be able to know the value of forecasting should come directly to that agency. So do not close the opportunity for DISKOPERINDAG to display the currency rates in their sites, because who visit this site are overseas businesses which of course it needed information about changes in currency exchange rates so that they can determine the best time to do business.
The problems that arise then is how to make predictions based on the exchange rate stochastic processes (probabilistic) with high accuracy. In this case the necessary phenomenon of the dependence on time are realized in a stochastic model (Box, 1994). Artificial neural networks can identify the pattern of the forecasting system data exchange rate of rupiah against the U.S. dollar can be done by the method of approach to training Based on learning skill it has, then the neural network can be trained to study and analyze the patterns of past data and trying to find a formula or function that will link the pattern of past data with the desired output. These network functions describing the dependence of the current data the previous data values. Back propagation is one of the methods of artificial neural networks that can be applied
well in the field of forecasting (Siang, 2005).
ARTIFICIAL NEURAL NETWORK Artificial neural networks are information processing systems that have characteristics similar to biological neural networks (Siang, 2005). Artificial neural networks are computing systems that are based on modeling of biological system (neurons) via the approach of computational properties of biological (Sekarwati, 2005). Artificial neural networks are computational systems model that can simulate the workings of biological neural networks (Subiyanto, 2002).
BACK PROPAGATION
BACK PROPAGATION TRAINING As with other neural networks, the network feed forward training is done in order to calculate the weights so that at the end of the training will be obtained weights are good. During the training process, the weights iteratively adjusted to minimize error that occur.
Error is calculated based on the mean squared error (MSE). The mean squared error is also used as the basis for calculating the performance of the activation function. Most of the training for feed forward network using a gradient of activation function to determine how to adjust the weights in order to minimize the performance. This gradient is determined by using a technique called back propagation.
Basically, the standard back propagation training algorithm will move the weight with a negative gradient direction. The basic principle of back propagation algorithm is to improve the network weights with the direction that makes the activation function to be falling rapidly
Back propagation training includes three phases as follows.
1. Phase 1, the forward propagation. Input pattern is calculated forward from the input screen to display output using the specified activation function.
2. Phase 2, the backward propagation. The difference between the network output with the desired target is the error that occurred. Errors that occur that dipropagasi retreat. Starting from the line that relates directly to units in the output layer.
3. Phase 3, the weight changes.
Modification of weights to reduce the error that occurred. All three phases are repeated until the termination condition continues to be met.
Training algorithm for backpropagation networks with one hidden layers (with the binary sigmoid activation function) is as follows.
a. Step 0
Initialize all weights to small random numbers.
b. Step 1
If the termination condition has not been met, go to step 2-8.
c. Step 2
For each pair of training data, perform steps 3-8.
d. Step 3 (steps 3-5 is a phase 1)
Each input unit receives the signal and passes it to the hidden units above it. e. Step 4
ji n
i i j
j v xv
net z 1 0 _ j net z j j e net z f z _ 1 1 ) _ (
f. Step 5
Calculate all network output in the output unit yk (k = 1, 2,..., m).
kj p
j j k
k w z w
net y 1 0 _ k net y k k e net y f y _ 1 1 ) _ (
g. Step 6 (steps 6-7 is a phase 2)
Calculate the factor α based on the error output unit in each unit of output yk (k = 1, 2,..., m). ) 1 ( ) ( ) _ ( )
( k k k k k k k
k t y f y net t y y y
Which tk = output target
δ k is a unit of error that will be used in a weight change of the layer below it. Calculate the change in weight wkj at learning rate α
p j m k z a
wkj k j, 1,2,..., ; 0,1,...
h. Step 7
Calculate the factor α hidden units based on the error at each hidden unit zj (j = 1, 2, ..., p). kj m k k j w net 1 _
Factor δ hidden units
) 1 ( _ ) _ (
_ j j j j j
j net f z net net z z
Calculate the weight change rate vji.
n i p j x a
vji j it, 1,2,..., ; 1,2,...,
i. Step 8 (phase 3)
Calculate the weights of all the changes. Changes in weight of the line leading to the output unit. ). ,..., 1 , 0 : ,..., 2 , 1 .( ) ( )
(new w old w k m j p
wkj kj kj
Changes in weight of the line leading to the hidden units ). ,..., 1 , 0 : ,..., 2 , 1 .( ) ( )
(new v old v j p i n
vji ji ji
The parameter α is the rate that determines the speed of understanding iteration. Value of α lies between 0 and 1 (0
≤ α ≤ 1). The larger the α the price, the
fewer iterations are used. But if the price α is too large, it will damage the pattern is correct so that understanding to be slow. One training cycle that involves all patterns are called epoch
SELECTING AND USING THE
relationship between forecast data with actual data through a percentage of the actual data and indicators of positive or negative on error (error) is ignored. Model accuracy is measured in relative terms using the PE and be seen also from its MSE value. PE values, MAPE and MSE obtained from the equation below
PE % 100 ) ˆ ( x y y y PE t t t Which
yt = actual value at time t. yt = forecast value at time t.
MAPE n n PE MAPE 1 with,
n = number forecast |PE| = absolute PE values MSE n i t t n i
i y y
n e n MSE 1 1 2 ) ˆ ( 1 1 Which
yt = actual value at time t. yt = forecast value at time t.
FACTOR ARE AFFECTING
CURRENCY EXCHANGE
Variables that affect the monetary value of the rupiah against the U.S. dollar is the
difference between Indonesia and the U.S. real income, the difference between Indonesia and the U.S. inflation, foreign interest rates and the U.S. Indonesia (Tri Wibowo, 2005).
MySQL and PHP
MySQL (My Structured Query Language) is one type of database server that is very famous. Popularity due to MySQL using SQL as a base to access its database. In addition, MySQL is Open Source (every person has the authority to access and use it for non-commercial use) on various platforms. MySQL RDBMS including types (Kadir, 2008).
In addition to installation and use of which is free of MySQL still has some advantages. As a fast data access and able to meet the needs of its users. However, MySQL does not have all the markers for a relational database, the MySQL developers to continue to make improvements each time so that later the current shortage of MySQL can be minimized.
makers of web applications HMTL pages present a dynamic and interactive to quickly and easily generated server.
PHP makes the application development process becomes easier as strengths, namely: 1. Script (program code) is integrated with an HTML file, so that developers can concentrate directly on the appearance of web documents.
2. No compiling and linking process. 3. Object-oriented (object oriented).
4. Syntax programming easy to learn, much like C and Perl.
5. Integration into a very wide range of database servers. Writing a web that connects to the database becomes very simple. Database supported by PHP: Oracle, Sybase, mSQL, MySQL, Solid, ODBC, PostgreSQL, etc
COLLECTING DATA
This phase aims to obtain data required in the processing of data to be carried out in accordance with the problems faced. Data collected are:
a. The rupiah against the U.S. dollar from January 2006 - December 2010 obtained from the website http://www.bi.go.id
b. Difference in Indonesia and U.S. real income obtained from their respective
websites and http://www.budget.gov
http://www.wikipedia.com
c. Difference in Indonesia and the U.S. inflation rate obtained from the respective websites and http://www.inflationdata.com
http://www.bi.go.id
d. And foreign interest rates Indonesia America from January 2006 - November 2010 respectively obtained from the website
http://www.global-rate.com and
http://www.bi.go.id
The data used as input data is weekly. It is based on research conducted Zhang and Hu. They stated that if the use of monthly data, artificial neural networks in forecasting foreign exchange rates will not show an increase in performance when compared with linear methods. But if you use weekly data, neural network performance will be better than the linear method (Zhang and Hu, 1997).
DATA PROCESSING
In data processing forecasting divided in two ways, namely by including variables that affect exchange rates and without entering variables that affect exchange rates. Forecasting uses the help of software VB.Net.
At this stage the data in the normalization of the range [0.1 to 0.9]. This data is normalized default by changing the range to [0.1 0.9] with the following equation.
xi‘ = 0,8 x (xi– min x) + 0,1
max x– min x
xi = the ith data
min x = minimum data from period 1 to 261 x max = maximum data from period 1 to 261
xi '= normalized value
DESIGNING NEURAL NETWORK
STRUCTURE
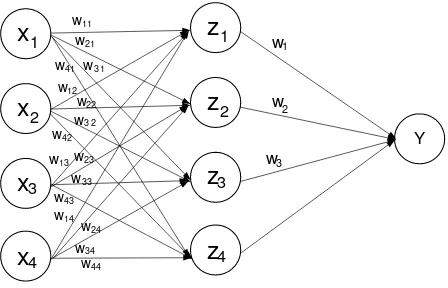
Structure of artificial neural networks are used in forecasting exchange rates are: 1. The number of layers used is 3 layer 1 input layer, one hidden layer and an output layer.
2. Number of hidden layers used is 1.
3. The number of neurons in the layer in 1, 2, 3 and 4 is a method of trial and error to see the smallest error value, while for forecasting without inserting the variables that influence wear only one neuron.
4. Activation function used is the binary sigmoid.
After all the artificial neural network structure is formed, continue to forecast
exchange rates. Used for forecasting VB.Net programming language. Phase weighting to initially use a small random number, so natinya artificial neural network system will repair itself how much actual weight for each - each of these variables during the training period. The following figure artificial neural network structure. Figure 1-5 is all of the artificial neural network structure used in this paper.
Y
x
1
w11
z1 w
1
Figure 1. Structure Incorporating Neural Networks without Affecting
Variables
x
x
x3
1
2
x4
w11
w12
z1 w1
w13
w14
Y
x x x3 1 2 x4 w11 w21 w12 w22 z1 z2 w 1 w2 w13 w23 w14 w24 Y
Figure 3. Structure of Neural Networks with Variable Affecting Insert and 2 Hidden Neurons x x x3 1 2 x4 w11 w21
w3 1
w12 w22
w3 2
z1 z2 z3 w1 w2 w3 w13 w33 w23 w14 w34 w24 Y
Figure 4. Structure of Neural Networks with Variable Affecting Insert and 3 Hidden Neurons x x x3 1 2 x4 w11 w21
w3 1
w12 w22
w3 2
w1 w 2 w3 w13 w33 w23 w14 w34 w24 Y z z z3 1 2 z4 w44 w43 w42 w41
Figure 5. Structure of Neural Networks with Variable Affecting Insert and 4 Hidden Neurons
FORECASTING RUPIAH EXCHANGE RATES AGAINST THE U.S. DOLLAR
WITH NEURAL NETWORKS
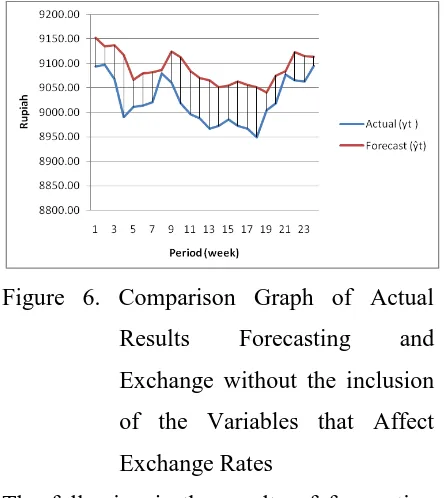
to 24 pairs of data. The following is a graph of the test results of forecasting
Figure 6. Comparison Graph of Actual Results Forecasting and Exchange without the inclusion of the Variables that Affect Exchange Rates
The following is the results of forecasting for 5 periods
Table 1. Currency Forecast without Inclusion Variable that Affect
FORECASTING RUPIAH EXCHANGE RATES AGAINST THE U.S. DOLLAR WITH NEURAL NETWORKS AND
ENTERING VARIABLES THAT
AFFECT EXCHANGE RATES
This Forecasting method is not much different from the forecast without entering the variables that influence, the difference is
that we include variables that affect exchange rates and we should try as much as what the neurons that will be used in the hidden layer. Then we set the variable as follows:
a. Exchange rate = x1
b. Difference in inflation = x2 c. Difference in interest rates = x3
d. Difference in Gross National Product = x4
Continue with the training, but in this training must be tried by the number of neurons in the 1 layer of neurons, 2 neurons, 3 neurons and 4 neurons.
The following chart shows the comparison of forecasting results and the actual value of the currency exchange rate 1 neuron in hidden layers.
Figure 7. Comparison of forecasting results and the actual value of the currency exchange rate 1 neuron in hidden layers.
The following is the results of forecasting for 5 periods 1 neuron in hidden layers.
1 9095,00
2 9147,20
3 9172,43
4 9190,45
5 9203,55
Forecast (Rupiah) Period
Table 2. Currency Forecast Inclusion Variable that Affect 1 neuron in hidden layers
The following chart shows the comparison of forecasting results and the actual value of the currency exchange rate 2 neurons in hidden layers.
Figure 7. Comparison of forecasting results and the actual value of the currency exchange rate 2 neuron in hidden layers.
The following is the results of forecasting for 5 periods 2 neuron in hidden layers.
Table 3. Currency Forecast Inclusion Variable that Affect 2 neuron in hidden layers
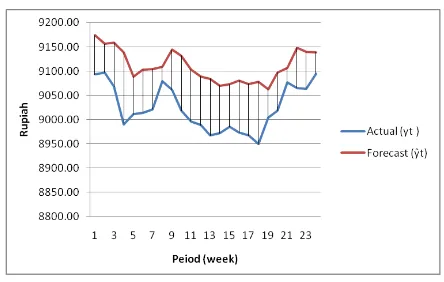
The following chart shows the comparison of forecasting results and the actual value of the currency exchange rate 3 neurons in hidden layers.
Figure 8. Comparison of forecasting results and the actual value of the currency exchange rate 3 neuron in hidden layers.
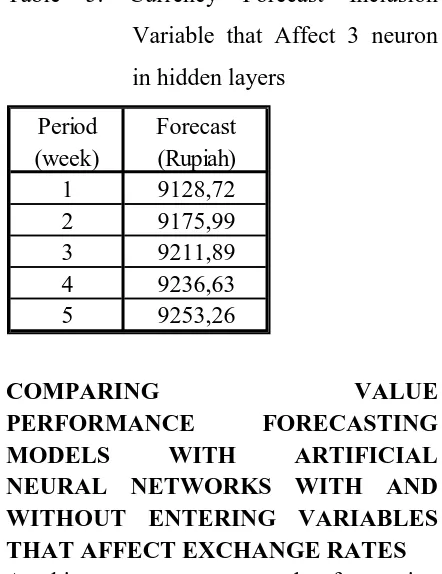
The following is the results of forecasting for 5 periods 3 neuron in hidden layers.
1 9159,12
2 9130,88
3 9179,07
4 9204,44
5 9229,44
Period (week)
Forecast (Rupiah)
1 9135,94
2 9185,89
3 9170,61
4 9208,05
5 9233,14
Period (week)
Table 4. Currency Forecast Inclusion Variable that Affect 3 neuron in hidden layers
The following chart shows the comparison of forecasting results and the actual value of the currency exchange rate 4 neurons in hidden layers.
Figure 9. Comparison of forecasting results and the actual value of the currency exchange rate 3 neuron in hidden layers.
The following is the results of forecasting for 5 periods 4 neuron in hidden layers.
Table 5. Currency Forecast Inclusion Variable that Affect 3 neuron in hidden layers
COMPARING VALUE
PERFORMANCE FORECASTING
MODELS WITH ARTIFICIAL
NEURAL NETWORKS WITH AND WITHOUT ENTERING VARIABLES THAT AFFECT EXCHANGE RATES At this stage to compare the forecasting performance of the rupiah against the U.S. dollar and enter without entering variables that influence. Valuation rules used is the value of Percentage Error (PE), Mean Absolute Percentage Error (MAPE) and Mean Square Error (MSE)
1 9116,44
2 9157,83
3 9189,57
4 9214,88
5 9211,47
Period (week)
Forecast (Rupiah)
1 9128,72
2 9175,99
3 9211,89
4 9236,63
5 9253,26
Forecast (Rupiah) Period
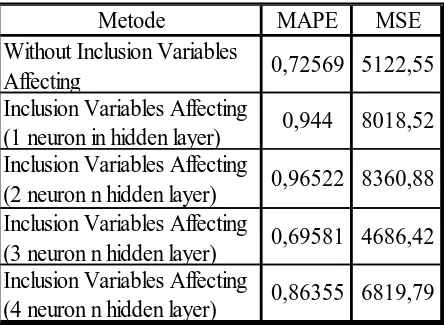
Table 6. Comparison of forecasting results
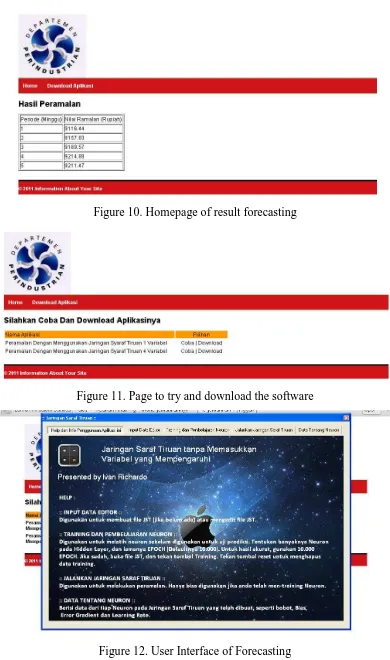
Designing a Web Page to Display Output From Calculation Designing web pages using PHP software. This web page displays the results of forecasting exchange rates has been done as well as provide access to people in order to attempt to use artificial neural network forecasting program, as well as giving people access to download the application.
CONCLUSIONS AND RECOMMENDATIONS
MAPE approach used to assess the performance of trained networks because MAPE know exactly signify the relationship between forecast data with actual data through a percentage of the actual data and indicators of positive or negative on error (error) is ignored. Model accuracy is measured in relative terms using the PE and be seen also from its MSE value.
For the test data obtained Mape smallest value of 0.69581%. This illustrates that the network with 3 neurons in a sprinkling can study the data well based on 24 data patterns are used. This value is much smaller than the value Mape from another network, so the network can see this is a significant relationship between variables. It is already quite good because it is usually small Mape value of 10% could be acceptable. This means that network all networks is acceptable but it is best to network with 3 neurons in the network.
Performance comparison between artificial neural networks by incorporating artificial neural network variables and by including variables that influence can be compared to the value of PE and its MSE. From these results can be analyzed that turned out, despite entering the variables that influence, does not guarantee that the forecasts made will be better than without entering the variables that influence. Can be seen from the results of the assessment rules are used that neural networks are designed without entering a variable that affects better than some of the artificial neural network that uses variables that influence.
From the test results can be (table 8.) Can be seen that the difference in the value of forecasting results and the actual data is not
Metode MAPE MSE
8018,52 0,944
4686,42 0,69581
8360,88 0,96522
Without Inclusion Variables Affecting
Inclusion Variables Affecting (1 neuron in hidden layer) Inclusion Variables Affecting (2 neuron n hidden layer) Inclusion Variables Affecting (3 neuron n hidden layer) Inclusion Variables Affecting (4 neuron n hidden layer)
5122,55 0,72569
too large. It is proved that artificial neural networks that use variables that affect and 3 neurons in the can to forecast the exchange rate well. So the artificial neural network forecasting results using variables that affect and 3 neurons can be said to show the results of forecasting for 5 periods ahead. The use of 5 periods ahead even this is useful for predicting the highest and lowest value of the currency exchange rate fluctuations is.
Figure 10. Homepage of result forecasting
Figure 11. Page to try and download the software
Figure 12. User Interface of Forecasting
REFERENCES
Box, G. E. P., Jenkins, G. M. (1994). Forecasting
and Control. New Jersey: Prentice Hall.
Dadashzhadeh, Muhammad. (2010).
Microcomputer Based-Decision Support for
Facilities Planning. International Journal of
Green Computing.
Dorsey, Robert E. and John D Johnson. (2010).
Microcomputer System and management.
International Journal of Green Computing.
Kadir, Abdul. (2001). Dynamic Web
Programming Basics Using PHP. Yogyakarta:
Andi Offset.
Kemal Sekarwati Ade, Herman Agustiawan.
(2005). Stock Price Prediction Using Neural
Networks. Master's Thesis. Gunadarma
University, Indonesia.
Makridakis, Spyros., Syeven C. Wheelwright.,
And Victor E. McGee. (1999). Forecasting
Methods and Applications. Jakarta: Binarupa
script.
Muhammad, Mahater. (2010). Comparison of
Backpropagation Artificial Neural Network and
Method of Arima (Box-Jenkins) As a Method of
Forecasting Currency Rupiah against the U.S.
dollar. University of North Sumatra, Indonesia.
Mulyono, Sri, (2000), Forecasting Stock Prices
and Exchange Rates: Box-Jenkins Techniques.
Economics and Finance Indonesia, Vol. XLVIII
No.2
Office of Management and Budget. (2011).
Washington, DC. : U.S Government Printing
Office
Sexton, Randall S. Beyond Backpropagation:
using simulated annealing for training neural
network. International Journal of green
Computing.
Siang, Jong jack. (2005). Artificial Neural
Networks Using Matlab and pemogramannya.
Yogyakarta: Andi Offset.
Subiyanto. (2000). Application of Artificial
Neural Networks as an Alternative Method of
Short-Term Load Forecast. Accessed on
December 10, 2010. From
http://www.elektroindonesia.com/elektro/ener
29.html-42k-Wibowo, Tri and Amir. (2005). Factors Affecting
Exchange Rate Euro. Journal of economic
studies and financial.
Zhang, G., Pattuwo, B.E., and Hu, M.Y. (1997).
Forecasting with Artificial Neural Networks. The
State of the Art: Elsevier International Journal of