Corporate Social Performance of Indonesian State-Owned and Private Companies
Hasan Fauzi, Azhar A. Rahman, Mostaq Hussain, Adnan A. Priyanto
ABSTRACT
The objectives of this study are to analyze the difference of corporate social performance between State-owned and private companies in Indonesia, and also to analyze the correlation between the corporate social performance (CSP) and the corporate financial performance by using company size, and institutional ownership as control variables. The population of this study is Indonesian state owned and private companies in the year of 2001-2004. Purposive sampling was used in this study, and final samples are 461 companies.
The CSP or CSR (Corporate social responsibility) score is measured by content analysis of corporate annual report using seven item developed by Michael Research Jantzi Research Associate, Inc. The data is tested by independent t-test to determine the mean difference and by using partial correlation test to know the correlation between the corporate social performance and financial performance.
The results of this study are that there is no significant difference mean of corporate social performance between state-owned and private owned companies in Indonesia. In addition, the correlation test indicates that there is no association between corporation social performance and financial performance both in SOCs and POCs.
Introduction
Baron (2000) defines altruism as action of people or group to voluntarily help somebody else
regardless of the motives of the action or vested interest. A company has a role and responsibility
to its environment and stakeholders. The stakeholder model states that the success of a company
(Ullman, 1984). If a company fails to do so, it faces problems raised by the constituents of
stakeholder). Coffrey and Wang (1998) use the term corporate altruism to call the action of
pro-social behavior conducted by business entity. During the last three decades, corporate altruism
has received significant attention. Some studies describe that pro-social behavior is about how a
company behaves in different countries. Moir (2001) contended that the hope for a company to
be more responsible for its community and environment became debatable recently. Morimoto et
al., (2004) emphasized the increasing pressures on companies to be more socially responsible.
Several studies have been conducted on corporate social performance in the context of developed
countries (e.g., see, Wardock and Grave, 1997; Preston and O’Bannon, 1997; Mahoney and
Roberts, 2007); however, similar studies in developing countries setting are rare. The indexes for
corporate social performance, as provided by Kinder Lydenberg Domini (2008) and also Jantzi
Research Incorporated (2008) in developing countries are not available yet. Indonesia is no
exception. Therefore, this research attempts to focus on Indonesian state-owned companies
(SOCs) and private companies (POCs).
According to Republic of Indonesia (Law No. 19) ( 2003) on state-owned company,
companies in Indonesia can be classified into state-owned company (SOCs), private-owned
company (POCs), and companies under cooperative scheme (COCs). In SOCs, all stakes come
from separated state asset, and are the economic actors contributing to Indonesian economic
system. In operationalizing the business, SOCs, POCs, and COCs support each other based on
democratic economy system (Republic of Indonesia, 2003). Currently, SOCs have served any
sector of business line. Therefore, most of Indonesian people use the SOC’s products and
services. As stipulated in the law, the SOC’s are ordered by the government (owner) to conduct
services not offered by POCs and COCs for economy viability. Thus, the issue is raised about the
role of stakeholders including shareholder in affecting the Indonesian companies’ policy to
conduct corporate social responsibility, and how the social responsibility is reported to
stakeholders?
Since 1998, changes have occurred in SOCs in order to be more transparent and accountable.
It has happened when Indonesian Government created the Ministry of State-Owned Companies.
According to Abeng (1999), the strategy of restructuring, profitability, and privatization was
needed to manage the SOCs well. Restructuring strategy was implemented by setting the holding
of SOCs. Amongst 150 SOCs, the companies are classified into 10-12 holding. The objective of
such setting is to place a business focus based on certain business goals. The concept of Abeng
(1999) is to set the super holding SOC, with Republic of Indonesian President as Chairman,
under which the giant holding of SOCs was operated. The giant holdings will be then the
world-class economic actors indicated by Fortune 500 list as one of the indicators. The idea almost
succeeded in 1999 when team restructuring batch II, supported by some world class consultants,
McKinsey, Booz Allen and Hamilton, Price Waterhouse & Coopers, Andersen, Ernst & Young,
and AT Keanery), completed a blue book for restructuring per industry sector (Nugroho and
Siahaan, 2005). The Indonesian government had the concepts of restructuring and privatizing
SOCs to make them the world-class companies, and thus to be profitable.
In short, it can be said that some endeavors to improve the SOCs, blue print on SOCs reform
had been set up in 1998-1999, and a master plan for SOCs had been developed during
2002-2006, and the law No. 19 (2003) had been approved by the lawmakers. The efforts to transform
the SOCs toward modern and professional business institutional have been conducted by the
order to manage the SOCs well (Soedjais, 2005); that is, considering the required condition and
given situation, the SOCs have a role (as corporate and good citizen) in taking corporate social
responsibility. Therefore, it is interesting to observe empirically how social responsibility (which
is often called social performance) is practiced in SOCs in comparisons with POCs as well as to
analyze the relationship between corporate social performance and financial performance. This
study has been focused on POCs to be compared to SOCs due to the same legal system as and
the similarity of business nature to the SOCs. Differentiating factor between them is ownership
only. COCs have different legal system from SOCs and POCs. The legal system for SOCs and
POCs is Corporation (called “Perseroan” in Indonesian term), while COCs, as stipulated in the
Indonesian cooperative law (Republic of Indonesia, 1992), must use the cooperative legal system
(called “Koperasi” in Indonesian term). Thus, the objectives of this chapter are to discover
difference of corporate social performance in state-owned and private companies, and correlation
between corporate social performance and financial performance in SOCs and POCs
Corporate Social Performance
Concept of corporate social performance (CSP), in which environmental aspect is included, is
synonymous with corporate social responsibility (CSR) and socially responsible behavior. They
are used interchangeably in empirical research. Sometimes, concept of CSP is subsumed under
the umbrella of CSR, and sometimes the reverse (Wood, 1991; Carroll, 1979, 1999; Barnett,
2007). Generally the term social and environment are covered in the concept of CSP including
the aspect of environment in measurement construct. However, due to the growing importance
social performance. However, the concept of performance measurement focuses on three Ps:
profit (financial), people (social), and planet (environment).
So far there have been four main models in understanding CSR construct: Carroll’s (1979),
Wartick and Cochran’s (1985), Wood’s (1991), and Clarkson (1995). Carroll defined CSR as
the intersection at a given moment in time of three dimensions: Corporate Social Responsibility
(CSR) principles should be apprehended at four separate levels (economic, legal, ethical and
discretionary); the sum of the social problems that a firm faces (i.e., racial discrimination, etc.);
and, the philosophy underlying its responses, which can range anywhere along a continuum
going from the firm’s anticipation of such problems to the outright denial. Wartick and Cochran
(1985) adjusted this model, re-sculpting its final dimension by borrowing from the strategic
management of social issues.
Wood (1991) proposed a renewed CSP model that soon became an omnipresent yardstick in
the construct’s theoretical development (Gerde and Wokutch, 1998). In line with earlier studies,
the authors define CSP as a business organization’s configuration of the principles of social
responsibility, processes of social responsiveness, and policies, programs, and observable
outcomes as they relate to the firm’s societal relationship (Igalens and Gond, 2005). The second
orientation was based on a more pragmatic observation of how hard it is to apprehend CSP using
the preceding typologies, and applying Stakeholder Theory as a framework to model CSP, which
would then be defined as a firm’s ability to manage its stakeholders in a way that is satisfactory
to them (Clarkson, 1995). Igalens and Gond (2005) summarize CSR models in Table 1.
Authors Definition of CSP CSP Dimensions Product safety; Safety at work; Shareholding problems for each of the main stakeholder categories it distinguishes: Employees;
Competitors
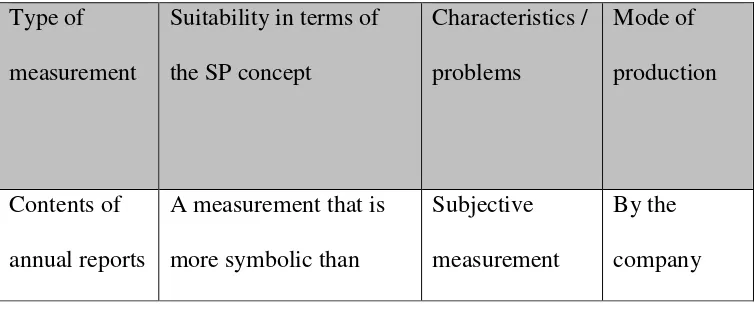
Approach to Measuring CSP
There have been five approaches to measuring Corporate social performance: (1) Measurement
based on analysis of the contents of annual reports, (2) Pollution indices, (3) Perceptual
measurements derived from questionnaire-based surveys, (4) Corporate Reputation indicators,
and (5) Data produced by measurement organizations (Igalens and Gond, 2005). In the first
approach, CSR is measured using content of corporate annual report. This method of measuring
CSR is focused on the disclosure in the annual report. According to the second approach,
measurement of CSR is focused on one dimensions of CSR (i.e., environment.) This method
generally is concerned with external party. Corporate Reputation indicator is an approach to
measuring CSR using reputation indicators as perceived by external parties of company. Data
produced by measurement organizations is a result of measurement approach of CSP conducted
by external agency using multidimensional measurement. Igalen and Gond (2005) summarize the
approaches in Table 2.
Table 2: Approach to Measuring CSP
Type of
measurement
Suitability in terms of
the SP concept
Characteristics /
problems
Mode of
production
substantive (discourse)
Measures just one of the
ambiguous
The approach to CSP measurement classified by Igalen and Gond (2005) is not so clear as
an approach strategy to measuring as they merely indicate source of data (as in content of annual
report and questionnaire as well as in other classifications). In the context of the approach to
CSP measurement, one will expect to have clear idea on some approaches to measuring CSP. To
resolve complication of the classification of the approach to CSP measurement four types of
measurement strategy proposed by Orliztky (2003) can be used. They are: (1) disclosure, (2)
reputation rating, (3) social audit; CSP process; and observable outcome, and (4) managerial
CSP principle and value. The disclosure approach uses content analysis method of documented
materials such as annual report. The objective of this approach is to find certain attributes
contained in the documents that are considered to reflect a company’s socially responsible
behavior. This approach has been used by the previous studies (see for example Andersson and
Frankie, 1980; Fredman and Jaggi, 1981 and 1986). The reputation rating approach to measuring
multi-reputation of the company. Previous studies using this approach are many (Cochran and Wood,
1984; Spencer and Taylor, 1987; 1987; McGuire et al., 1988; Simerly, 1995; Sharfman, 1996;
Belkaoui, 1997; and Turban and Greening, 1997). The next category of measurement method for
CSP is social audit, CSP process, and observable outcome. This is a systematic process in which
the third party assesses a company’s behavior of CSP, normally using multi dimension measures
to have a ranked index of CSP. The third party includes KLD (Kinder Lydenberg Domini) and
CEP (Council on Economic Priorities). This approach has been used previously ( Wartick, 1988;
Turban and Greening, 1997; and Russo and Fouts, 1997). Their approach of measuring CSP is
using managerial CSP principle and value. Under this approach, survey has been carried out to
assess a company’s activities using values and principles of CSR developed initially by Caroll
(1979) and extended by Aupple (1984). The values and principles of CSR include four
dimensions: economy, legal, ethics, and discretionary. The previous studies adopting this
approach include Ingram and Frazier (1980); Aupple et al (1985); Freeman and Jaggi (1986);
Cowen (1987); O’Neal et al. (1989); and Hansen and Wemerfelt, (1989). Cochran and Wood
(1984) contended that there are two generally accepted methods to measure CSP: content
analysis, and reputation index. Based on their argument, the last three classifications of Orliztky
et al. (2003) fall in the reputation index method. In line with Cochran and Wood (1984),
Margolis et al (2001 and 2003) use other term for the two generally accepted methods: (i)
subjective and (ii) behavior indicators. Subjective indicators refer to reputation index method of
Cochran and Wood (1984) and the last three classifications of Orliztky at al. (2003), while the
behavior indicators represent content analysis method of Cochran and Wood (1984) and
disclosure strategy of Orliztky et al. (2003). Furthermore, some measures for CSP have been
attributes of reputation (often called fortune measure); five aspects focusing on key stakeholders
and three pressure variables (often called KLD measure); quantitative measure of environmental
aspect (often called TRI measure); quantitative aspect of company philanthropy (often called
Corporate philanthropy measure); and, return of six social measure on customer, employee,
community, environment, minority, and non US stakeholder (often called best corporate citizen).
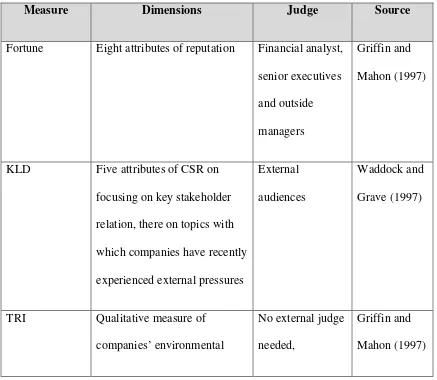
For some approaches, it may be possible to use similar measurement but with different judgment
or evaluation, the overall CSR measurement may result in different perspective. Itkonen (2003)
summarizes different perspective of CSR in Table 3.
Table 3: Types of Corporate Social Performance Measure
Measure Dimensions Judge Source
Fortune Eight attributes of reputation Financial analyst,
senior executives
and outside
managers
Griffin and
Mahon (1997)
KLD Five attributes of CSR on
focusing on key stakeholder
relation, there on topics with
which companies have recently
experienced external pressures
External
audiences
Waddock and
Grave (1997)
TRI Qualitative measure of
companies’ environmental
No external judge
needed,
Griffin and
discharge to water, air and
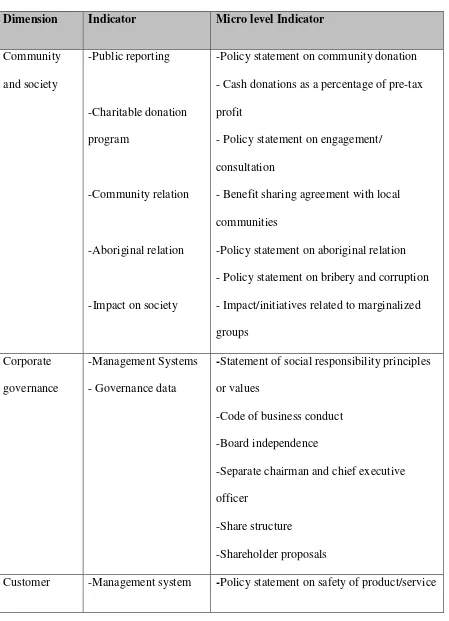
Michael Jantzi Research Associate, Inc. (long partner with KLD), in their study on social and
environment performance and their relation to financial and institutional ownership, and included
the following variables: community and society, corporate governance, customer, employee,
environment, human rights, controversies business activities. Their modified measures of social
Table 4: Dimensions of CSP
Dimension Indicator Micro level Indicator
Community
and society
-Public reporting
-Charitable donation
program
-Community relation
-Aboriginal relation
-Impact on society
-Policy statement on community donation
- Cash donations as a percentage of pre-tax
profit
- Policy statement on engagement/
consultation
- Benefit sharing agreement with local
communities
-Policy statement on aboriginal relation
- Policy statement on bribery and corruption
- Impact/initiatives related to marginalized
groups
Corporate
governance
-Management Systems
-Governance data
-Statement of social responsibility principles
or values
-Code of business conduct
-Board independence
-Separate chairman and chief executive
officer
-Share structure
-Shareholder proposals
-Impact on customer -Policy statement on the treatment of
customers
-systems/programs to ensure product safety or
fair treatment of customers
-Public reporting on employee issues
-education and development
-ownership program
-Policy on employee diversity
-public reporting on diversity issues
-Policy on occupational health and safety
-Employee wellness programs
-Description of relations
-No. of strikes/lockouts in the last five years
-Employee controversies
-Formal Environmental Management System
-Environmental policy
-Systems to measure and monitor
environmental performance
-Audits
-Other Environmental
Data
- The company's environmental reporting
-Resource use
- Pollution control
-Environmental penalties over the last five
years
-Environmental liabilities
-Total environmental expenditures
Human rights -Exposure to Human
Rights Issues
-Management Systems
-Impact and Initiatives
-Exposure related to countries in which the
company operates
-Human rights policy/code of conduct
-Systems/programs to manage human rights
issues
-Community engagement
-Implication in the abuse of human rights
Controversies
Business
Activities
-Alcohol
-Gambling
-Genetic Engineering
-Tobacco
-Use of animal
-Level of involvement (% of annual revenues)
-Nature of involvement
Corporate Financial Performance1
Basically it is also the responsibility of management to improve the financial performance. Component of stakeholder like investor, creditor, and labor are very concerned about the performance. The higher financial performance leads to the increase in wealth of the stakeholders. In addition, based on the slack resource theory (Waddock and Graves in Dean, 1999), improving financial performance make the companies has more opportunities to improve social performance in all aspects.
There are many measures used to represent the financial performance. They include three categories: ROA and ROE (Waddock and Graves, 1997; Mahoney and Roberts, 2002), profitability in absolute term (Stanwick and Stanwick, 1987), and multiple accounting based measure with the overall index using the score of 0 –10 (Moore, 2001). Using score of 0-10 to have overall index of financial performance raises a problem of objectivity of scoring process and of validity of the end result of index.
Corporate financial performance (CFP) can also be measured using three alternative approaches: (1) market based measure, (2) accounting-based measure, and (3) perceptual measure (Orliztky et al, 2003). Under the first approach, the market value of a company derived from stock price of the company is used to measure CFP. This approach reflects notion that primary stakeholder of the company is shareholder. Some researchers using this approach include Cochran and Wood, 1984; Shane and Spicer, 1983; Preston, 1978; Vance, 1975; Simerly, 1994. Accounting-based measure is one to measure CFP derived from a company’s competitive effectiveness and a competitive internal efficiency as well as optimal utilization of assets, for some certain measures. Measures such as net income, ROA, and ROE are some examples of this approach. This approach has been in previous studies by Simerly, 1994; Turban and Greening, 1997; Waddock and Grave, 1997; Russo and Fouts, 1997.
The Relationship between CSP and CFP 2
relationship between CSP and CFP: direction and causality of the relationship (Preston and The
importance of the relationship between CSP and CFP states that social responsibility is an
important corporate duty. Given the importance of the CRS in corporate decision-making, the
relationship between CSP and financial performance is an important topic (McGuire et al.,
1988). In practice, social performance requires some costs that may reduce financial
performance. As a result, the question arises, which should come first—social performance or
financial performance. Justification to explain the importance is thus needed by management.
There are two important issues in the O’Bannon, 1997). The direction of the relationship
refers to positive, negative or neutral. The positive direction of the relationship between CSP and
CFP occurs when increase in CSP leads to the increases in CFP. The change in CSP leading to
the change in CFP in different way is negative direction of the relationship. If a change in CSP
does not affect the change in CFP, then neutral effect in the direction of the relationship occurs.
The causality of the relationship denotes if CSP or CFP is independent or dependent variable. In
this case, two possibilities exist: CSP as independent variable and CFP as independent variable.
If CSP is an independent variable, it affects CFP. If CSP is a dependent variable, CFP affects
CSP.
The positive link between CSP and CFP can be explained in three ways (Waddock and
Grave, 1997). First, firms trying to lower its implicit cost by acting socially irresponsibly, its
explicit cost will increase and, in turn, result in competitive disadvantage (decrease in profit).
Second argument of Waddock and Graves (1997) is using the better management theory.
2
According to this theory, socially responsible firms improve relationship with their stakeholders.
The relationship improves competitive advantage and, in turn, increases financial performance.
This argument is equivalent to the social impact and synergy hypothesis of Preston and
O’Bannon (1997). The last argument used by Waddock and Graves (1997) for positive
relationship is the slack resource theory. According to this theory, firm’s financial resource will
determine activities in social responsibility, because given the resource, the firm has more
chances to invest in socially responsible activities. This argument is comparable to the fund
hypothesis of Preston and O’Bannon (1997).
Explanation of the negative CSP-CFP link is based on neoclassical economic theory which
states that socially responsible firms’ costs are considered unnecessary, and thus can lead to a
competitive disadvantage; that is, a decrease in companies’ profit and shareholder wealth
(Preston and O’Bannon, 1997; Waddock and Garve, 1997). Neutral link between CSP and CFP
exists as the relationship is by coincidence (Waddock and Grave, 1997). Argument for this link
is that a company acting socially responsibly to customer can have different demand curve as
compared to less responsible companies. Therefore, the activities are the only way to attain
differentiation, and thus do not impact on company’s profit (McWilliam and Siegel, 2001). The
relationships of CSP and CFP are summarized in Table 5.
Table 5: Positive, Negative, and Neutral Direction of the Relationship of CSP and CFP
Study Sample CSR
Measure
Control
Variables
Worrell, Davidson
Frooman (1997) Meta-analysis of 27 event
studies
Roman, Hayibor
and Agle (1999)
Reconstruction the literature
study of Griffin and Mahon
1997), 4 studies added
Orlitzky (2001) Meta-analysis of 20 studies Firm size
Orlitzky and
Benjamin (2001)
Meta-analysis on the
relationship and risk
Ruf et al. (2001) Multiple industries
496 firms
KLD Firm size,
industry
Murphy (2002) S&P 500 Best Corporate
Citizens
Simpson and
Kohers (2002)
Banking industry, 385 banks Community
Reinvestment Act
Rating
Industry
Griffin and Mahon,
Moore (2001) U.K. supermarket industry, 8
companies
CSP and CFP, which is not positive and the same under all conditions. The use of contingency
perspective is needed to understand under which condition the relationship will be valid
(Hedesström and Biel, 2008). That is why Fauzi (2008b) proposes a proposition on corporate
performance explaining that the relationship between CSP and CFP can be contingent upon four
variables: (1) business environment, (2) business strategy, (3) organization structure, and (4)
Griffin and Mahon (1997) raised another issue of causality of the relationship between CSP
and CFP. In an effort to meet the stakeholder’s expectation, company should try to improve CSP
from time to time in light of economic/financial condition. However, the question on the priority
arises; that is, which one (CSP and financial performance) come first. Waddock and Graves
(1997) and Dean (1999) put forward two theories to answer the question: Slack resource theory
and good management theory. Under the slack resource theory, a company should have a good
financial position to contribute to the corporate social performance. Conducting the social
performance needs some fund resulting from the success of financial performance. According to
this theory, financial performance comes first. Therefore, CFP is independent variable to affect
CSP. A good management theory holds that social performance comes first. Based on the theory,
CSP is an independent variable resulting in CFP. A company perceived by its stakeholders as
having a good reputation will make the company easier to get a good financial position through
market mechanism.
Hypotheses Development
1. The Difference of CSP between SOCs and POCs
Rudjito (2005) states that one of the problems resulting in SOCs to have inferior business
performance in past was the drawback in the direction of SOCs’ policy. Since the ministry of
SOCs had been set up, the direction of the SOCs policy is clear and it became clearer when the
Law No. 19, 2003 (Republic of Indonesia, 2003) has been passed. One of the functions of the
Ministry of SOCs is to emphasize the role of the government as the owner of SOCs (different
from the role of the government as the regulator). The Law No.19 (Republic of Indonesia, 2003)
roles, political interventions in SOCs will be minimized. As a result, SOCs can work
professionally based on the principles of good corporate governance. In addition, the increasing
demand, resulting from global situation, for SOCs to be corporate citizen is the also the condition
the SOCs are facing (Soedjais, 2005). Given the positive direction in managing SOCs, it is
expected that the factors can encourage the SOCs to improve their performance in different
dimensions; that is social, environment, and financial. Therefore, it is hypothesized that:
H1: There are no differences in social performance of SCOs and POCs.
2. The Relationship Between CSP and CFP3
Based on the literature review, the relationship between corporate social performance and
corporate financial performance could be positive, negative, or neutral. But most of the result of
studies indicated the positive relationship and very few provided the negative and neutral
relationship (Worrell at al., 1991; Preston et al., 1997; Waddock et al., 1997; Frooman, 1997;
Roman et al., 1999; Orliztky, 2001; Orlizky et al., 2001; Rufel et al., 2001; Murphy, 2001;
Simpson et al., 2002; Griffin et al., 1997; McWilliam et al., 2000 and 2001; Moore, 2001).
Griffin & Mahon (1997) reviewed 51 studies discussing the relationship between CSP and
CFP from the 1970’s through the 1990’s. The Griffin & Mahon’s study (1997) mapped the issue
of direction of the relationship betweenCSP and CFP for the periods. In the 1970s, there were 16
studies reviewed with 12 of which had positive relationship. During the period of the 1980s and
1990s, the positive direction of the relationship accounted for 14 of 27 studies and seven of the
eight studies, respectively. Negative results were supported by only one study in the 1970s, 17
3
studies in the 1980s, and 3 studies in the 1990s. Inconclusive findings were found by four studies
in the 1970s, five studies in the 1980s, and no finding in the 1990s. It should be noted that one or
more studies could have one or more findings in the work of Griffin and Mahon (1997).
As the study of Griffin & Mahon (1997) was not all inclusive, there are additional studies
contributing to the direction of the association between CSP and CFP relationship in the 1990s.
During this period, positive direction of the relationship has been supported by Worrell et al.
(1991), Preston & O’Bannon (1997), Waddock & Graves (1997), Frooman (1997), and Roman et
al. (1999). Negative results are supported by Wright & Ferris (1997). Furthermore, in the 2000s,
there are some researchers adding to the debate on the link between CSP and CFP with different
perspectives of methodology. Positive results were supported by the works of Orlitzky (2001),
Orlitzky & Benjamin (2001), Ruf et al. (2001), Konar & Cohen (2001), Murphy (2002), Simpson
& Kohers (2002), Orlitzky et al. (2003), and Mahoney & Roberts (2007). Patten (2002) found a
negative correlation. Researchers such as McWilliams & Siegel (2000 and 2001) and Moore
(2001) found inconclusive results. Fauzi (2004) using content analysis of annual reports of
companies listed on the New York Stock Exchange for the period of 2004 also provided support
for inconclusive results
In a more recent work, Margolis & Walsh (2003) also mapped studies investigating the
relationship between CSP and CFP. They followed the works of Griffin & Mahon (1997) but
used a wider time period (1972 – 2002) resulting in analysis of 127 published studies. Of these
studies, 70 studies (55%) reported having a positive relationship, seven studies suggested a
negative rela tionship, 28 studies supported inconclusive results, and 24 studies found the
relationship went in both directions. Gray (2006), in his review of studies investigating the
longitudinal data analysis, they found evidence to the contrary. Hill et al. (2007) investigated the
effect of corporate social responsibility on financial performance in terms of a market-based
measure and found positive results in the long-term.
Given that discussion, it is expected to have concern that the relationship between corporate
and financial performance is positive. Hence, it is proposed that:
H2: There is positive relationship between corporate social performance and financial performance.
There are other variables affecting corporate social performance such as company size and
institutional ownership.
Company Size
According to Waddock and Graves (1997) and Itkonen (2003), company size is related to
corporate social performance; that is, bigger companies behave in a more socially responsible
manner than smaller ones. In addition, company size can have a relationship with institutional
ownership; that is, bigger companies get more attention from the external stakeholder groups
than smaller companies, and so, they need to respond to them. Orlitzky (2001) demonstrates that
size is a factor in the relationship. Further, CSP is related to the firm size, because, in the
beginning, entrepreneurial strategies focus on the basic economic survival and not on ethical and
philanthropic responsibilities. Based on the arguments, is expected that the size of the company
can be related to CFP, resulting from, for example, the economies of scale.
For companies to have low risk, they should consider and manage social responsibility.
Consequently, a company with low CSP will have adverse impact in terms of risk. Lawsuits
against cigarette manufacturers and water and air polluters are some examples of companies in
which low CSP has caused high financial risk (Orlitzky and Benjamin, 2001; Itkonen, 2003).
Institutional Ownership
Institutional ownership is generally a large investment in a company, and so, the investor has less
ability than individual investor to move quickly without affecting the company's share price
(Pound, 1988). Therefore, it is related to company's financial as well as overall performances
(Johnson and Greening, 1999; Mahoney and Robert, 2003). To have a company's stake,
institutional investors normally consider return and risk. A company with low CSP faces high
risk to be pressured, and in turn, will endanger their investment. Therefore, they prefer to look
for a company with higher CSP as the choice improves their potential return. The higher the
CSP companies have, the more institutional ownership in those companies. In that case, CSP
is a means to reduce the risk of investment.
Methodology
Data and Sample Selection
Population of this study is state-owned companies and private-owned companies. Sampling
method used is purposive sampling. The sample was based on the following criteria: (1) POCs
have been registered in Jakarta Stock Exchange (JSX) during 2001-2004; (2) SOCs, registered in
JSX, are treated as SOCs, and those that are not registered are listed in the SOCs list; and, (3)
Measurement of CSP
CSP is measured and calculated through content analysis for each company following the
approaches of both by Kinder, Lydenberg Domini (KLD), an United States based independent
rating company and by Michael Jantzi Research Associate (MJRA), an independent rating
company in Canada. Both these companies measure several dimensions of the CSP to arrive at a
total measure of CSP. These dimensions include community issues, diversity in the workplace,
employee relations, environmental performance, international issues, product and business
practices, and other variables concerning compensation, confidentiality, and ownership in other
companies.
Both positive and negative social responsible information was collected through examining the
CAR (Corporate annual report), company corporate social reports, along with information
obtained from the capital market directory, Jakarta stock exchange websites, other websites and
other electronic news of sampled companies. The CSP for each company was assessed on a scale
of -2 to +2 for each rating. A -2 rating for any dimension indicates major concern, -1 indicates a
notable concern, 0 indicates no notable or major strength and concern, +1 indicates a notable
strength and +2 indicates a major strength. A composite CSP score was then calculated by
summing the scores of each dimension for each company. Table 6 reports the dimensions of
CSP.
Table 6: Dimension of CSP
Dimension Strength Concern
Community Issues • Generous giving
• Innovating giving
• Lack of consultation/
• Community consultation/
• Woman on board of directors
• Women in senior management
• Work/ family benefit
• Minority/women contracting
• Lack of employment equity
initiative
• Beneficial product and service
• Environment management
• Negative impact of operation
• Negative impact of products
• Environment
• Sourcing practice
• Poor environmental
management/ performance
• Human rights
• Burma
• Sourcing practice
Product and
Business Practice
• Beneficial products and service
• Ethical Business Practice
• Product safety
• Pornography
• Marketing practices
• Illegal business practices
Other • Limited compensation
• Confidential proxy voting
• Ownership in companies have
• Excessive compensation
• Dual-class share structure
• Ownership in other
companies
Measurement of Financial Performance
Following the works of Waddock and Graves (1997) and Roman et al. (1999), Return on Assets
(ROA) and Return on Equity (ROE) were used to measure a firm’s financial performance. ROA
is defined as the ratio of net income after tax to total assets, and ROE is defined as the ratio of
net income after tax to outstanding shares. Information on ROA and ROE was collected from
the CAR.
Measurement of Control Variables
There are three approaches to measure company size in literature: (1) Total asset (Tsoutsoura,
2004; Fauzi, 2004); (2) The number of people employed (Simerly and Li, 2001); and, (3) Annual
follows the measure used by Mahoney and Robert (2007) with the argument that total asset is
“money machine” to generate sales and income.
Based on the literature survey, the institutional ownership variable, as used by Mahoney et al.
(2007), is measured by the number of institutions owning the company shares.
Sample Characteristics
Tables 7-10 report sample characteristics and descriptive data.
Table 7: The Number of Sample of SOCs
Description Number
Total annuals provided by SOCs in 2001-2004
Annual report not eligible for samples
Annual eligible for samples
47
(10)
37
The number of annual report collected from SOCs is 47. Of the total samples, 10 (21%) annual
reports are not eligible for reasons such as damaged files, too short contents, leaving the number
of 37 samples (79%).
Table 8: The Number of POCs’s Samples
Total annual report provide by POCs in 2001-2004
Annual repors not eligibles for samples
Number of annual report eligible efor samples
508
(84)
424
The numbers of POCs supplying annual report were 424. Amongst the Samples, 84 (17%)
annual reports are not eligible for sampling. As a result, total samples for both SOCs and POCs
are 461 companies. Descriptive statistics are presented by computing mean and deviation
standards of CSR, ROA, total assert, risk management, and institutional ownership between
state-owned companies and private-owned companies
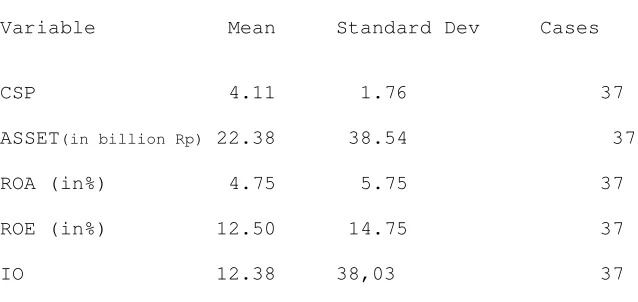
Table 9: Statistics of Descriptive –SOC
Variable Mean Standard Dev Cases
CSP 4.11 1.76 37
ASSET(in billion Rp) 22.38 38.54 37
ROA (in%) 4.75 5.75 37
ROE (in%) 12.50 14.75 37
IO 12.38 38,03 37
Notes:
CSP= Corporate Social Performance indicates score of SOCs’ CSP measured by using the dimension of MJRA
ASSET= Total asset as stated in SOCs’s balance sheet
ROA=Return on Asset computed by dividing SOCs’ net income by total asset ROE=Return on Equity computed by dividing SOCs’ net income by total asset
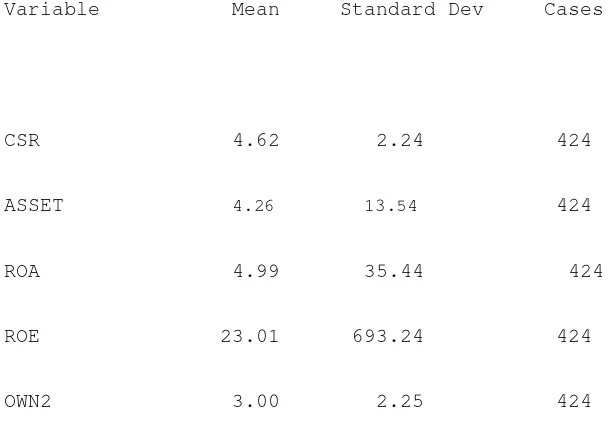
Table 10: Statistics of Descriptive-POCs
Variable Mean Standard Dev Cases
CSR 4.62 2.24 424
ASSET 4.26 13.54 424
ROA 4.99 35.44 424
ROE 23.01 693.24 424
OWN2 3.00 2.25 424
Notes:
CSP= Corporate Social Performance indicates score of POCs’ CSP measured by using the dimension of MJRA
ASSET= Total asset as stated in POCs’s balance sheet
ROA=Return on Asset computed by dividing POCs’ net income by total asset ROE=Return on Equity computed by dividing POCs’ net income by total asset
IO=Institutional Ownership indicated by the number of POCs’ shares owned by institutional owner
Results
For H1, t-test analyzed the differences between SOCs and POCs. Table 11 reports the statistics.
Table 11: Testing Mean Difference of CSP/CSR’s Score
Description SOCs POCs
CSP Mean 4.11 4.62
Deviation standard 1.86 2.24
Difference 0,37 0,37
Table 11 shows no significant mean diferrence between social performance in SOCs and POCs.
As result, the hypothesis (H1), stating that there is mean difference in social perfomance of
SOCs and POCs, cannot be accepted.
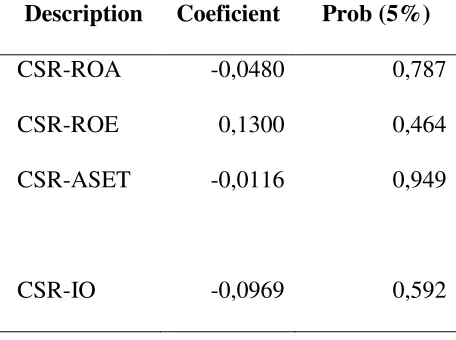
Table 12 indicates the result of correlation test between social performance and financial
performance at SOCs situation. It is found that (as shown in the table, using the three control
variables for both measures of financial performance), there is no a significant corelation
between social performance and financial performance.
Table 12: The Correlation Test between Social Performance and Finacial Performance at SOCs
Description Coeficient Prob (5%)
CSR-ROA -0,0480 0,787
CSR-ROE 0,1300 0,464
CSR-ASET -0,0116 0,949
CSR-IO -0,0969 0,592
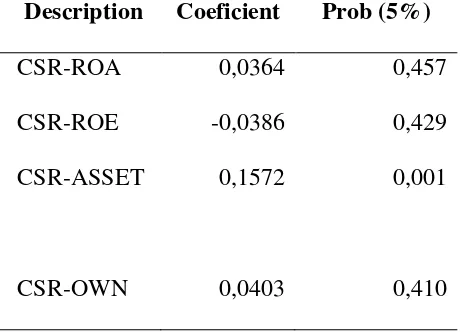
Table 13 shows the correlation test between corporate social performance and financial
performance at POCs. As indicated in the table, it is found that there is no significant correlation
Table 13: Correlation Test Between Social Performance and Financial At POCs
Description Coeficient Prob (5%)
CSR-ROA 0,0364 0,457
CSR-ROE -0,0386 0,429
CSR-ASSET 0,1572 0,001
CSR-OWN 0,0403 0,410
Comparisons are needed specially in developing countries. Al-Khadash (2003) included
(34) companies that have annual reports during 1998-2000. Compared to that study, our study
has a larger sample. In addition, the classification used in Al-Khadash (2003) is disclose and
undisaclose, while this study classifies the sample companies as the SOCs and POCs.
Conclussion
The objective of this chapter was to analyze the difference in social performance in SOCs and
POCs and the relationship between corporate social performance and financial performance at
SOCs and at POCs using the control variables of company assets and institutional ownership.
The score of CSP is determined using content analysis of annual reports of the sampled
companies. The independent t-test is used to analyze the mean difference between CSP in SOCs
and POCs, while the partial correlation technique is to test correlation between CSP and financial
performance. The results indicate no significant mean difference between CSP in the
state-owned companies and in the private-state-owned companies. In addition, this study finds no
significant correlation between corporate social performance at SOCs and POCs situation. It is
Recommendation for Managers
The CSR (corpoarate social responsibility) activities in the Indonesian economics do not seem to
contribute to business performance. This study demonstrates that Indonesian companies are
increasingly trying to accommodate CSR and emphasizing on CSR as costs than stakeholder
relationship. This could be due to the companies’ objection of the Indonesian Law No. 40 (2007)
on Indonesian Corporation. One of the articles of the law stipulates that Indonesian companies
are obliged to conduct CSR. The reason for the objection is their un-readiness to carry out CSR
responsibilities.
This study recommends that the authority of SOCs and POCs need to issue the regulations
for the companies to disclose the CSR activities in their annual report. The awareness to disclose
the CSR activities is expected to encourage them to conduct the CSR. This effort is especially
important as CSR activities in developing countries such as Indonesia. The neutrality of the
relationship of this study finding may be due to the incompleteness of the annual reports used (as
the key data in the content analysis approach) in measuring CSP/CSR.
Direction for Future Research
Further research should include other approaches to measuring the CSP and financial
performance. The reputation approach to measuring CSP, for example, as suggested by Orliztky
et al. (2003) is an alternative to content analysis or disclosure approach. In addition, financial
performance also needs to be extended, and not only should be based on accounting-based
measure but also be based on market-based measure and perceptual approach. Longitudinal
approach is important to be used as alternative to cross sectional approach. That endeavors are
References
Abeng, T. (2004). Reformasi BUMN. Paper presented at The Seminar BUMN Executives Club, Jakarta.
Al-Khadash, H. A. (2003). “The Accounting Disclosure of Social and Environmental Activities A Comparative Study for the Industrial Jordanian Shareholding Companies”. Abhath Al-Yarmouk Journal: Humanities and Social Sciences
Anderson, J.C., Frankle, A.W.(1980). “Voluntary Social Reporting: An Iso Beta Portfolio Analysis”. The Accounting Review. vol. LV no.3
Aupperle, K.E., Carroll, A.B., and Hatfield, A.D. (1985). “An empirical examination of the relationship between corporate social responsibility and Profitability” Academy of Management Journal (28/2).
Baron, R.A. and Byrne, D. (2000). Social Psychology 9th edition. Allyn and Bacon Publisher.
Barnett, M. L. 2007. Stakeholder influence capacity and the variability of financial returns to corporate social responsibility. Academy of Management Review, 32: 794–816.
Belkaoui, A.(1976). “The impact of the Disclosure of the Environmental Effects of Organizational Behavior on the Market’. Financial Management5: 26–31.
Chan, C.S.H. and P. Kent (2003). “Application of Stakeholder Theory to theQuantity and Quality of Australian Voluntary Corporate Environmental Disclosures”. Paper
presented to the Accounting and Finance Association of Australia and New Zealand (AFAANZ), July, Brisbane
Carroll, A.B. (Ed). (1977). Managing Corporate Social Responsibility. Boston: Little, Brown and Company.
Carroll, A.B.(1979).”A three-dimensional conceptual model of corporate social Performance”. Academy of Management Review4: 497–506.
Cochran, P.L., and Wood, R.A.(1984).”Corporate Social Performance and Financial Performance” Academy of Management Journal, (March), 27(1):42-56.
Clarkson, Max B. E. (1995a). A Stakeholder Theory of the Corporation: Concepts, Evidence, and Implications”. The Academy of Management, (20/1)
Dean, K.L.(1998).“The Chicken and the Egg Revisited: Ties Between Corporate Social Performance and the Financial Bottom Line”. The Academy of Management Executive,2:99-100.
Donaldson, T. and L. E. Preston (1995). “The Stakeholder Theory of the Corporation:
Concept, Evidence, and Implications”. The Academy of Management Review, 20(1): 65-91.
Donalson, T.(1999).”Making Stakeholder Theory Whole”. Academy of Management Review, (24/2)
Coffey, B.S., and G.E. Fryxell, (1991)”Institutional Ownership of Stock and Dimensions of
Corporate social Performance: An Empirical Examination” Journal of Business Ethics, (June), 10(6):437-444.
Coffey, B. S. and J. Wang, (1998). Board Diversity and Managerial Control as Predictor of Corporate Social Performance. Journal of Business Ethics; October 1998, 17, 1595-1603
Davidson, W. N. III and D. L. Worrell (1992).”Research notes and communications: The effect of product recalls announcements on shareholder wealth’. Strategic Management Journal13: 467–473.
Fauzi, H.(2004). “Identifying and Analyzing the Level of Practices of Company’s
Social Responsibility in Improving Financial Performance”. Journal of Business and Management. (Vol. 4 no.2)
Fauzi, H., L. Mahoney, A.A. Rahman (2007).”The Link Between Corporate Social
Performance and Financial Performance: Evidence from Indonesian Companies” Issues in Social and Environmental Accounting, (July),1(1):149-159
Fauzi, H., L. Mahoney, A.A. Rahman (2007).”The Ownership and Corporate Social Performance” Issues in Social and Environmental Accounting, (December), 1(2)
Fauzi, H.(2008a). “Corporate Social and Environmental Performance: A Comparative
Study of Indonesian Companies and MNCs Operating in Indonesia”. Journal of Global Knowledge. (Spring), 1(1)
Fauzi, H. (2008b).”The Determinants of the Relationship between Corporate Social Performance and Financial Performance”, A Paper accepted for presentation in AAA event in California in August, 2008.
Frederick, W. C; E. P. James and K. Davis (1992). Business and Society: Corporate Strategy, Public Policy, and Ethics. McGraw-Hill International Edition
Performance”. Omega: TheInternational Journal of Management Science10: 167– 176.
Freedman, M., and Jaggi, B. 1986 ‘An analysis of the impact of corporate pollution disclosures included in annual financial statements on investors’ decisions’. Advances in Public Interest Accounting1: 192–212.
Freeman, R.E.(1994). “The Politics of Stakeholder Theory: Some Future Directions”. Business Ethics Quarterly. (4/4).
Frooman, J. (1997). Socially Irresponsible and Illegal Behavior and Shareholder Wealth. Business & Society, 3:221-249.
Fry, F.L., and R.I. Hock (2001). “Who Claim Corporate Responsibility? The Biggest and the Worst. Business and Society Review
Gerde, V.W.(2000).”Stakeholder and Organization Design: An Empirical Test of Corporate Social Performance”. in Research in Stakeholder Theory,1997-1998: The Sloan Foundation Minigrant Project. Toronto: Clarkson Center for Business Ethics.
Gray, R.H., Kouhy, R., and Lavers, S.(1995a).”Corporate Social and Environmental Reporting: A Review of the Litertaure and a Longitudinal Study of UK Disclosore”, Accounting, Auditing, and Accountability Journal, 8(2): 47-77
Gray, R.H., Kouhy, R., and Lavers, S.(1995b).”Constructing a Research Database of Social and EnvironmentalReporting by UK Companies: A Methodological Note ”, Accounting, Auditing, and Accountability Journal, 8(2): 47-77
Graves, S. B. (1988). Institutional ownership and corporate R&D in the computer industry. Academy of Management Journal, 31: 417-428
Graves and S. A. Waddock. (1994). Institutional owners and corporate social performance. Academy of Management Journal37 (4):1034-1046.
Griffin, J.J. and J.F. Mahon (1997). “The Corporate Social Performance and Corporate
Financial Performance Debate: Twenty-Five Years of Incomparable Research”. Business and Society, 36(1):5-31.
Griffin, J.J. and J.F. Mahon (1999). “Painting a Portrait”. Business and Society, 38(1):126-133.
Igalens, J. and J. Gond (2005). “Measuring Corporate Social Performance in France: A Critical and Empirical Analysis of ARESE Data”. Journal of Business Ethics,56(2): 131-148.
Itkonen, L. (2003). “Corporate Social Responsibility and Financial Performance”.Helsinki: Institute of Strategy and International Business.
Johnson, R. A. and D. W. Greening. (1999). The Effects of Corporate Governance and
Institutional Ownership Types on Corporate Social Performance. Academy of Management Journal, October 1999, 42, 5.
Jantzi Research Incorporated. 2008.
http://www.jantziresearch.com/index.asp?section=7&level_2=34
Kinder Lydenberg Domini (KLD). (2008). http://www.kld.com/indexes/index.html
Mahoney, L.S. and R.W. Roberts (2007. “Corporate Social Performance, Financial Performance and Institutional Ownership in Canadian Firms”. Accounting Forum, 31(3): 233-253.
Mangos, N. and P. O’Brien (2000). “Investigating Social Responsibility Reporting Practices of Global Australian firms and how those Practices enhance Economic Success”. http:// www.iipe.org
McGuire, J.B., Sundgren, A., and Schneeweis, T.(1988) “Corporate Social
Responsiblity And Firm Financial Performance”. Academy of Management Journal, (Dec), 3(4):854-872.
McWilliams, A. and D. Siegel (2000). “Corporate Social Responsibility and Financial Performance: Correlation or Misspecification?”. Strategic Management Journal, 21(5):603-609.
McWilliams, A. and D. Siegel (2001). “Corporate Social Responsibility: A Theory of Firm Perspective”. Academy of Management Review, 26(1):117-127.
Moeljono, D. and R. Nugroho. (2005). Kantor Kementrian BUMN. BUMN Executives Club, Jakarta.
Moir, L. (2001). What Do We Mean By Corporate Social Responsibility?. Journal of Corporate Governance 1, (2), 16-22. MCB University Press.
More, G. (2001). Corporate Social and Financial Performance: An Investigation in the U.K. Supermarket Industry. Journal of Business Ethics, Vol.34: 299-315.
Murphy, E.( 2002). “Best Corporate Citizens Have Better Financial Performance”. Strategic Finance, 83(7):20-21.
Murray, A., D. Sinclair, D. Power and R. Gray (2006). “Do Financial Markets Care about Social and Environmental Disclosure? Further Evidence and Exploration from the UK”. . Accounting, Auditing & Accountability Journal, l9(2):228-255.
Murphy, E. (2002). “Best Corporate Citizens Have Better Financial Performance”. Strategic Finance, 83(7):20-21.
Neville, S J. B. and B. Menguc (2005). Corporate Reputation, Stakeholders and the Social Performance-Financial Performance Relationship. European Journal of Marketing Vol. 39. No. 9/10, 1184-1198. www.emeraldinsight.com
Nugroho, R. And R. Siahaan. (2005). BUMN Indonesia: Isu, Kebijakan, dan Strategi. Jakarta: Elex Media Komputindo.
Orlitzky, M. (2001). “Does Firm Size Confound the Relationship Between Corporate Social Performance and Firm Financial Performance?”. Journal of Business Ethics, 33(2):167-180.
Orlitzky, M. and J.D. Benjamin (2001). “Corporate Social Performance and Firm Risk: A Meta- Analytic Review”. Business and Society, 40(4):369-396.
Orlitzky, M., F. L. Schmidt and S.L. Rynes (2003). “Corporate Social and Financial Performance: A Meta Analysis”. Organization Studies,24(3):403-441.
O’Donovan, G. and K. Gibson (2000). Environmental Disclosures in the Corporate Annual Report: a Longitudinal Australian study. Http://www.ssrn.com
Preston, L.E.(1978).”Analyzing Corporate Social Performance: Methods and Results”. Journal of Contemporary Business7: 135–150.
Preston, L.E. and D.P. O’Bannon (1997). “The Corporate Social-Financial Performance Relationship: A Typology and Analysis”. Business and Society, 36(4):419-429.
Rashid, M. Z.A. and I. Saadiatul (2002). Executive and Management Attitudes Towards Corporate Social Responsibility in Malaysia. Corporate Governance 2,4 2002, 10-16.
http://www.emeraldinsight.com/1472-0701.htm
Reimann, B.C.(1975).”Organizational effectiveness and management’s public values: A canonical analysis”. Academy of Management Journal18: 224–241.
Republic of Indonesia.(2003). The Law No.19, 2003 on State-Owned Companies and its Explanations. www.ri.go.id
Republic of Indonesia.(2007). The Law No.40, 2007 on Indonesian Corporation and its Explanations. www.ri.go.id
Rudjito (2005). Restrukturisasi BUMN Pasca UU BUMN. BUMN Executive Club, Jakarta.
Roman, R.M., S. Hayibor and B.R. Agle (1999). ”The Relationship Between Social
and Financial Performance: Repainting a Portrait”. Business and Society, 38(1):109-125.
Rowley, T. and S. Berman (2000).”A Brand New Brand of Corporate Social Performance”. Business and Society, 39(4):397-418.
Ruf, B.M., K. Muralidhar, R.M. Brown, J.J. Janney and K. Paul (2001. “An Empirical
Investigation of the Relationship Between Change in Corporate Social Performance and Financial Performance: A Stakeholder Theory Perspective”. Journal of Business Ethics, 32(2): 143-156.
Russo, M.V., and Fouts, P.A.(1997). “A resource-based perspective on corporate environmental performance and profitability”. Academy of Management Journal, 40: 534–559.
Shane, P.B., and Spicer,B.H.(1983) ‘Market response to environmental information produced outside the firm’. Accounting Review58:521–538
Sharfman, M.(1996).”A Concurrent Validity Study of the
KLD Social Performance Ratings data’. Journal of Business Ethics15: 287–296.
Simatupang, M. (2003). BUMN Pasca UU BUMN. Paper presented at Workshop II BUMN di Era Globalisasi, Jakarta.
Simerly, R.L.(1994). “Corporate Social Performance and Firms’ Financial Performance: An Alternative Perspective”. Psychological Reports75: 1091–1103.
Simerly, R.L.(1995)”Institutional Ownership, Corporate Social Performance, and Firms’ Financial Performance”. Psychological Reports77: 515–525.
Simerly, R.L. (2003)”Empirical Examination of the Relationship between Management
and Corporate Social Performance”. International Journal of Management, 20(3):353-359.
http://www.westga.edu/~bquest/2000/corporate.html
Simpson, W.G. and T. Kohers (2002). “The Link Between Corporate Social and Financial Performance: Evidence from the Banking Industry”. Journal of Business Ethics, 35(2): 97-109.
Soedjais, Z. (2005). BUMN Incorporated. Paper presented at The Seminar BUMN Executives Club, Jakarta.
Sugiharto (2005). Restrukturisasi, Profitisasi, Privatisasi. Paper presented at CEO Breakfast &Briefing, BUMN Executives Club, Jakarta.
Stanwick, P.A. and S. Stanwick (1987)“The Relationship Between Corporate Social Performance, and Organizational Size, Financial Performance, and Environmental Performance: An Empirical Examination”. Journal of Business Ethics, 17: 195-204.
Tsoutsoura, M. (2004). Corporate Social Responsibility and Financial Performance. Working Paper Series (University of California, Berkeley). http://repositories.cdlib.org
Ullman, A.A.(1985).”Data in Search of Theory: A Critical of Examination of the
Relationship Among Social Performance, Social Disclosure, and Economics Performance of U.S. Firms”. Academy of Management Review, (10/3).
Turban, D.B. and Greening, D.W.. (1997). “Corporate Social Performance and Organizational Attractiveness to Prospective Employee”. Academy of Management Journal, (vol. 40 No. 3)
Vance, S.(1975).”Are socially responsible firms good investment risks?” Management
Review 64: 18–24.
Waddock, S. A. and S. B. Graves (1997). The Corporate Social Performance Financial Performance Ling. Strategic Management Journal, April 1997, 18, 4.
Wagner, M.( 2001). “A Review of Empirical Studies Concerning the Relationship Between Environmental and Economic Performance”, Liineburg: Center for Sustainability Management, August
and Society, (Dec), 41(4): 371-391.
Wood, Donna J.(