PADAMU NEGERI KAMI BERJANJI
PADAMU NEGERI KAMI BERJANJI
PADAMU NEGERI KAMI BERBAKTI
PADAMU NEGERI KAMI BERBAKTI
PADAMU NEGERI KAMI BERJANJI
PADAMU NEGERI KAMI BERJANJI
PADAMU NEGERI KAMI BERBAKTI
PADAMU NEGERI KAMI BERBAKTI
PADAMU NEGERI KAMI BERBAKTI
PADAMU NEGERI KAMI BERBAKTI
PADAMU NEGERI KAMI MENGABDI
PADAMU NEGERI KAMI MENGABDI
PADAMU NEGERI KAMI BERBAKTI
PADAMU NEGERI KAMI BERBAKTI
PADAMU NEGERI KAMI MENGABDI
PADAMU NEGERI KAMI MENGABDI
BAGIMU NEGERI JIWARAGA KAMI
BAGIMU NEGERI JIWARAGA KAMI
BAGIMU NEGERI JIWARAGA KAMI
BAGIMU NEGERI JIWARAGA KAMI
Challenges
of Biofuel Industry in Indonesia
By : Praptiningsih G. Adinurani
Roy Hendroko
Anggi Nindita
Roy Hendroko
Workshop on Renewable Energy & Sustainable Development in Indonesia
Past Experience Future Challenges
Past Experience – Future Challenges Le Meridien Hotel, Jakarta, 19-20 January 2009
Out Line Presentation
Why biofuel important for Indonesia ?
Roadmap biofuel Indonesia 2005-2025
Roadmap biofuel Indonesia 2005 2025
Biofuel usage in 2007
M
d t
bi f
l
Mandatory biofuel
Are we ready ?
Biodiesel from CPO
Suplementary feedstock :
Jatropha curcasSuplementary feedstock :
Jatropha curcasCJO for substitution kerosene
Problem of bioethanol
Problem of bioethanol
Bioetanol for substitution kerosene
Impact of oil price decreasing
CURRENT ENERGI MIX
1. Why Biofuel ?
Geothermal, Hydro Power,
3.11%
National (Primary) Energy Mix
1. Why Biofuel ?
Natural Gas, 28.57% ,
1.32%
Target in 2025
1. Less than 1 for energy elasticity Coal 15 34% Oil 51.66% elasticity 2. Optimized primary energy mix Coal, 15.34%
NATIONAL ENERGY POLICY
NATIONAL ENERGY POLICY
(PRESIDENTIAL DECREE NO.
(PRESIDENTIAL DECREE NO. 5 5 YEAR YEAR 20062006)) Oil, 20% BIOFUELS 5% Gas, 30% BIOFUELS, 5% Geothermal, 5%
Biomass, Nuclear, Hydro Solar Energy, Wind Power, 5% NRE,17%
Coal , 33%
Coal Liquefaction 2%
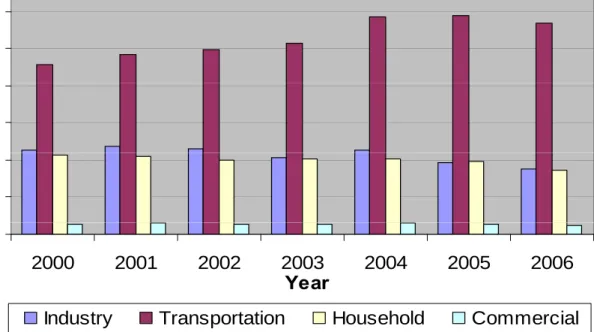
3 00E+07 3.50E+07 2 00E+07 2.50E+07 3.00E+07 (KL ) 1.50E+07 2.00E+07 V ol um e ( 5.00E+06 1.00E+07 V 0.00E+00 2000 2001 2002 2003 2004 2005 2006 Year
Industry Transportation Household Commercial
Figure 2. Consumption of Oil Fuel per sector in
Indonesia , Year 2000 - 2006
30,000,000 20 000 000 25,000,000 ) 15,000,000 20,000,000 o lu m e ( K L ) 5,000,000 10,000,000 V o -1989 1991 1993 1995 1997 1999 2001 2003 2005 YearTransportation Industry Electricity
Figure 3. Consumption of
Diesel Fuel
Per Sector
Year 1989 – 2005
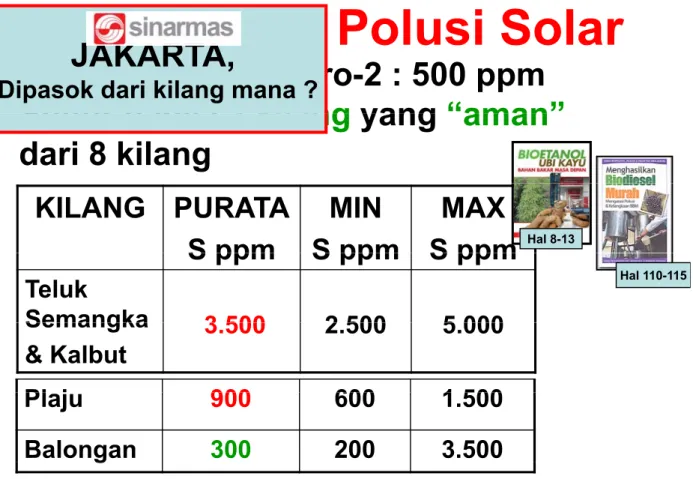
Polusi Solar
JAKARTA
Polusi Solar
Dengan standar Euro-2 : 500 ppm
Sulfur hanya
2 kilang
yang
“aman”
JAKARTA,
Dipasok dari kilang mana ?
Sulfur hanya
2 kilang
yang
aman
dari 8 kilang
KILANG PURATA
S ppm
MIN
S ppm
MAX
S ppm
Hal 8-13S ppm
S ppm S ppm
Teluk
Semangka
3 500
2 500
5 000
Hal 110-115Semangka
& Kalbut
3.500
2.500
5.000
Pl j
900
600
1 500
Plaju
900
600
1.500
Balongan
300
200
3.500
Sumber : Swiscontact dan Lead Information Center, 2008
g
16 000 000 18,000,000 20,000,000 12 000 000 14,000,000 16,000,000 K L) 8,000,000 10,000,000 12,000,000 V ol um e ( K 2 000 000 4,000,000 6,000,000 V 0 2,000,000 1989 1991 1993 1995 1997 1999 2001 2003 2005 2007 1989 1991 1993 1995 1997 1999 2001 2003 2005 2007 Year Refined ImportedFigure 4. Premium Usage in Transportation Sector
Y
1989 2007
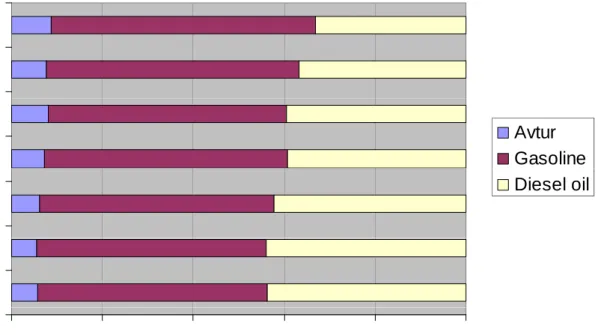
2006 2005 2006 2003 2004 Y ea r Avtur Gasoline 2002 Y Diesel oil 2000 2001 0% 20% 40% 60% 80% 100% Share
Figure 5. Premium Usage
Compare
to Diesel oil in
Share
T
t ti
S t
t Th Y
2000 2006
Transportation Sector at The Year 2000 - 2006
ROADMAP FOR BIOFUELS DEVELOPMENT
2
Biodiesel 10% of Diesel Fuel ConsumptionBiodiesel Utilization
Biodiesel Utilization 15% of Diesel Fuel Consumption
Year 2005-2010 2011-2015 2016-2025
Biodiesel Utilization 20% of Diesel Fuel Consumption
Biodiesel 10% of Diesel Fuel Consumption
2.41 million kL 15% of Diesel Fuel Consumption4.52 million kL 20% of Diesel Fuel Consumption10.22 million kL
Bioethanol 5% Gasoline ConsumptionBioethanol Utilization 1.48 million kL Bioethanol Utilization 10% Gasoline Consumption 2.78 million kL Bioethanol Utilization 15% Gasoline Consumption 6.28 million kL Bio-oil
Biokerosene Utilization Biokerosene Utilization Biokerosene Utilization - Biokerosene 1 million kL
1.8 million kL 4.07 million kL
-Pure Plantation Oil for Power Plant - Biokerosene
PPO Utilization
0 4 illi kL PPO Utilization PPO Utilization
BIOFUELS
BIOFUELS Utili tifor Power Plant 0.4 million kL 0.74 million kL 1.69 million kL
BIOFUELS
BIOFUELS Utilization 2% of energy mix 5.29 million kL BIOFUELS Utilization 3% of energy mix 9.84 million kL BIOFUELS Utilization 5% of energy mix 22.26 million kL3. Biofuel Usage
in Indonesia 2007
Type of Domestic BBM Domestic BBN Percent Type of BBM Percent Usage 2007 Diesel 10,883,740 KL 16.000 kl 0,147 PSO , Diesel Non PSO 14,649,151 KL --- ---Biofuel Feedstock avabiality Domestic Usage Percent avabiality UsageBiodiesel Crude Palm Oil 17.5 Million Tons
16,000 Kl 0,078
Bioetanol Usage in Indonesia 2007
g
Discription Feedstock Avaibility Usage 2007 Percent
Ethanol 1 2 j t t 1 000 kl 0 083
Ethanol 1,2 juta ton 1.000 kl 0,083
Premium -PSO =17.929.843 Kl -non PSO = 249.448 Kl -total =18.179.291 Kl ethanol = 1.000 kl 0,0055 Molases 800.000 ton **) 4.000 kl *) 0,5
Note: *) molases conversion 1:4, calculated 1.000 x 4 = 4.000 ton
**) molases production in Indonesia ± 1,4 milions ton/year, 600 ton used to ethanol industry, y
REGULATIONS related to BIOFUEL DEVELOPMENT
1. Presidential Regulation No. 5/2006 on National Energy Policy
2. Presidential Instruction No. 1/2006 on Supply and Utilization of Biofuel as Alternative Fuel
3. Presidential Decree No. 10/2006 on The Establishment of National Team for Biofuel Development
4. Estate Crop Law No. 18/2004
5. Government Regulation No. 1/2007 on Income Tax Facilities for Investment Activities in Specific Industries and/or Particular Region
6. Government Regulation No. 8/2007 on The Government Investment
7. Law No. 22/2001 on Oil and Natural Gas
8. Presidential Regulation No. 36/2004 on Oil and Natural Gas Downstream Activities
REGULATIONS related to BIOFUEL
REGULATIONS related to BIOFUEL
DEVELOPMENT (continu)
DEVELOPMENT (continu)
9. Minister of Energy and Mineral Resources Decree No. 051/2006 9. Minister of Energy and Mineral Resources Decree No. 051/2006
on Guideline and Procedure for Biofuel Businesses on Guideline and Procedure for Biofuel Businesses
DEVELOPMENT (continu)
DEVELOPMENT (continu)
10. Minister of Finance Decree No. 117/PMK.06/2006 on Credit for the 10. Minister of Finance Decree No. 117/PMK.06/2006 on Credit for the
Development of Biofuel Energy and Plantation Revitalization Development of Biofuel Energy and Plantation Revitalization 11. National Standard (SNI) for Biodiesel No. 04
11. National Standard (SNI) for Biodiesel No. 04 –– 7182 7182 –– 20062006 12. National Standard (SNI) for Bioethanol No. DT27
12. National Standard (SNI) for Bioethanol No. DT27 –– 0001 0001 –– 20062006 13. Director General for Oil and Gas Decree No. 3674K/24/DJM/2006 13. Director General for Oil and Gas Decree No. 3674K/24/DJM/2006
on Gasoline Specification for Domestic Market on Gasoline Specification for Domestic Market
14. Director General for Oil and Gas Decree No. 3675K/24/DJM/2006 14. Director General for Oil and Gas Decree No. 3675K/24/DJM/2006
on Diesel Fuel Specification for Domestic Market on Diesel Fuel Specification for Domestic Market
15. Director General for Oil and Gas Decree No. 13483K/24/DJM/2006 15. Director General for Oil and Gas Decree No. 13483K/24/DJM/2006
Biodiesel Specification for Domestic Market Biodiesel Specification for Domestic Market
16. Minister of Energy and Mineral Resources Decree No. 16. Minister of Energy and Mineral Resources Decree No.
032/2008 on Mandatory for Biofuel 032/2008 on Mandatory for Biofuel
Enclosure
4. Mandatory
DEPARTEMEN ENERGI DAN SUMBER DAYA MINERAL
LAMPIRAN PERATURAN MENTERI ESDM NO… TAHUN 2008 TENTANG PENYEDIAAN, PEMANFAATAN DAN TATA NIAGA BAHAN BAKAR NABATI (BIOFUEL) SEBAGAI BAHAN BAKAR LAIN
PENTAHAPAN KEWAJIBAN MINIMAL PEMANFAATAN BIODIESEL32/2008 PENTAHAPAN KEWAJIBAN MINIMAL PEMANFAATAN BIODIESEL
Jenis Sektor September 2008 s.d Desember Januari 2009 Januari 2010 Januari 2015** Januari 2020** Januari 2025** Keterangan 32/2008 2008
Rumah Tangga - - - Saat ini tidak digunakan Transportasi PSO 1 % 1 % * Terhadap k b h l PSO 1 % (excisting) 1 % 2,5 % 5 % 10 % 20 % kebutuhan total Transportasi Non PSO - 1 % 3 % 7 % 10 % 20 % Industri dan Komersial 2,5 % 2,5 % 5 % 10 % 15 % 20 % * Terhadap kebutuhan total Pembangkit Listrik 0,1 % 0,25 % 1 % 10 % 15 % 20 % * Terhadap kebutuhan total 1 % 10 % 15 % 20 %
** Spesifikasi disesuaikan dengan spesifikasi global dan kepentingan domestik
© DJ MIGAS 2008
2
Spesifikasi disesuaikan dengan spesifikasi global dan kepentingan domestik
DEPARTEMEN ENERGI DAN SUMBER DAYA MINERAL
LAMPIRAN PERATURAN MENTERI ESDM NO… TAHUN 2008 TENTANG
Enclosure
PENYEDIAAN, PEMANFAATAN DAN TATA NIAGA BAHAN BAKAR NABATI (BIOFUEL) SEBAGAI BAHAN BAKAR LAIN
PENTAHAPAN KEWAJIBAN MINIMAL PEMANFAATAN BIOETANOL
Jenis Sektor September 2008 s.d Desember 2008 Januari 2009 Januari 2010 Januari 2015** Januari 2020** Januari 2025** Keterangan
Rumah Tangga Saat ini tidak
Rumah Tangga - - - Saat ini tidak digunakan Transportasi PSO 3 % (excisting) 1 % 3 % 5 % 10 % 15 % * Terhadap kebutuhan total Transportasi Non PSO 5 % (excisting) 5 % 7 % 10 % 12 % 15 % * Terhadap kebutuhan total
Industri dan - 5 % 7 % 10 % 12 % 15 % * Terhadap
Komersial p kebutuhan total Pembangkit Listrik - - - * Terhadap kebutuhan total
** Spesifikasi disesuaikan dengan spesifikasi global dan kepentingan domestik
© DJ MIGAS 2008
BIODIESEL PRODUCTION CAPACITY & LOCATION
TABLE 8
BIODIESEL PRODUCTION CAPACITY & LOCATION
COMPANY LOCATION 2008 2009 Status : September 2008 COMPANY LOCATION 2008 2009 Capacity KL/Yr Domestic KL/Yr Capacity KL/Yr Domestic KL/Yr
1 Asian Agri Tbk Lubuk Gaung, 200.000 70.000 200.000 80.000 1 Asian Agri Tbk Lubuk Gaung,
Dumai
200.000 70.000 200.000 80.000
2 Energi Alternatif IndonesiaPT Jakarta 300 300 1.000 1.000
3 Eterindo Wahanatama Tbk Gresik & Cikupa 120 000 120 000 240 000 240 000
3 Eterindo Wahanatama Tbk Gresik & Cikupa 120.000 120.000 240.000 240.000
4 Darmex Biofuel PT Bekasi 150.000 30.000 150.000 60.000
5 Ganesha Energy Group Medan 3.000 3.000 10.000 10.000
6 I d Bi f l E PT M k 60 000 60 000 160 000 100 000
6 Indo Biofuels Energy PT. Merak 60.000 60.000 160.000 100.000
7 Multikimia Intipelangi PT. Bekasi 5.000 5.000 10.000 10.000
8 Musim Mas Group Medan 50.000 10.000 350.0000 100.000 9 Permata Hijau Group Duri 200.000 75.000 200.000 120.000 10 Sumi Asih PT. Bekasi & Lampung 100.000 50.000 200.000 100.000
11 Wilmar Group Dumai 700.000 300.000 1.000.000 300.000
Total 1.588.300 723.300 2.521.000 1.121.000
BIOETHANOL
TABLE 12
PRODUCTION CAPACITY & LOCATION
No COMPANY LOCATION 2008 2009 . CAPACITY (KL) Domestic (KL) CAPACITY (KL) Domestic (KL) 1 Anugrah Kurnia Abadi Lampung 2 500 2 500 2 500 2 500
1 Anugrah Kurnia Abadi PT./ B2TP
Lampung 2.500 2.500 2.500 2.500
2 Medco Group Lampung 60.000 60.000
3 Molindo Raya Industrial Lawang &
Lampung
12.000 12.000 50.000 50.000
4 Sugar Group Lampung 70.000 100.000
Jumlah 14.500 52.500
F
d
6. Biodiesel from CPO
Availability of CPO
Food
Feed
E
Energy
TABLE 5
Type of BBM Domestic BBM Usage 2007 Feedstock Availability Biofuel Usage(5%)
Percentage of Feedstock Usage Diesel Fuel (PSO) 10,883,740 KL 17.500.000 MT ~ 20.114.943 KL 544.187 KL2,71 %
Diesel Fuel 14 649 151 KL 17 500 000 MT ~ 732 458 KL3 64 %
Diesel Fuel Non Subsidy 14,649,151 KL 17.500.000 MT 20.114.943 KL 732.458 KL3,64 %
S Tj k 2008 (di l h k b li)< 7%
Source : Tjakrawan, 2008 (diolah kembali)
SOLAR-biodiesel/POME
CPO Production : 17,5 millions ton
D
ti U
4 5
illi
(
26%
)
Domestic Usage : 4.5 million (
26%
)
CPO Export
: 13 million (
74%
)
CPO Export : 13 million (
74%
)
6,35 :Biodiesel 25,71 : Cooking Oil
TOTAL : 32.06%
B-20 :
29,18 % BBN
25,71% C.O.
T t l
54 89%
Total :
54,89%
7. Suplementary Feedstock
A 50:50 blend of the oily nut from the jatropha treeand Jet A1 fuel
December 30, 2008, 11:33 am
Air New Zealand Flies on Engine With Jatropha Biofuel Blend
By James Kanter
Air New Zealand's Capt. David Morgan with vials of David Morgan with vials of
jatropha oiland Air New Zealand's biofuel blend.
Yunnan Jatropha Research Center Shao Tu Long Mengzi, Yunnan A t 16th 20th 2008 Agust 16th-20th, 2008 China China Honghe, Yunnan Malaysia Kuala Pilla
Tamil Nadu and Rajasthan January 2006 January 2006 jatropha_c@yahoo.co.in, jatropha3@hotmail.com, jatropha3@hotmail.com, jatrophacurcas@gmail.com http://www.jatrophaworld.org, http://www.jatrophabiodiesel.org India p j p g Kl RNI J tit j h Klon RNI - Jatitujuh
Maret 07
India India
Dry Seed Jatropha CJO SJO
8.Subst
Sortation seed SJO PPO /Bio-oil) Biodiesel PengepressanPressing Cake C O CJO Filtration Sludgesjo
g Refinery Degumming Esterifikasi And/or Transesterifikasi DeasifikasiBio-Diesel Bio- Kerosene
CJO STOVE
Bio KeroseneS b ITB Sumber : ITB
Presure Stove Wick Stove
Sumber : PT KEI Jerman/RRC RNI Tracon Protos Balittas Pura S Pura Suar Regulated Fire
CJO with gravity
Energy Self Sufficient Villages DME Grobogan
Pakuwon Balittas
Biomass Jatropha Stove
PastaH j
Garlina Hanjuang
(9) Problem of
Bioetanol
( )
5%
Table 9.
2009 :
Availability of Molases to Biofuel Feedstock
5%
BBM Biofuel Biofuel Usage of
Premium Subsidy :
20.444 juta KL
(BPH Mi
)
Type of BBM BBM Usage 2007 (kiloliter) Biofuel Feedstock Availability Biofuel Usage 5% (kiloliter) Usage of Biofuel (%) P i 17 929 843 ***)800 000 896 492 l 448 2(BPH Migas)
Premium 17.929.843 ***)800.000 ton molases 896.492 equal 3.585.968 ton* 448,2 Premium 249.448 ***)800.000 12.472 equal 6,2Non subsidy ton molases 49.888 ton**
Note: * molases conversion 1:4,, calculated 896.492 x 4 = 3.585.968 ton
Note: molases conversion 1:4,, calculated 896.492 x 4 3.585.968 ton
** molases conversion 1:4, calculates 12.472 x 4 = 49.888 ton
*** molases production in Indonesia ± 1,4 milions ton/year, 600 t d t th l i d t
600 ton used to ethanol industry,
600 ton used to MSG & feed industry, and 200 ton export
Table 10.
Availability of Cassava as Biofuel Feedstock
5%
Type of BBM BBM Usage 2007 Biofuel Feedstock Biofuel U 5% Usage of Bi f l (%) BBM 2007 (kiloliter) Feedstock Availability Usage 5% (kiloliter) Biofuel (%) Premium 17.929.843 19.802.508 896.492 equal q 29,43 5.827.198 ton* Premium Non subsidy 249.448 19.802.508 12.472 equal 324.272 ton** 1,65 31,08%Non subsidy 324.272 ton
Keterangan: * Cassava conversion 1:6.5,calculated 896.492 x 6.5 = 5.827.198 ton
** Cassava conversion 1:6.5, calculated 12.472 x 6.6 = 324..272 ton
blending went up to became = 10% and 15%,
each will permeate produce of domestic cassava equal to
59,67% and 89,51%.
V i ti
f i
t t
i k
2002 2007
TABLE 11
Tapioka
Variation of import tapioka year 2002-2007
Year
p
Vol (Ton) Value
(Thousand US$) 2002 25.977 4.833 2003 190.627 33.692 2004 56.760 10.450 2005 103.075 24.497 2006 305.309 70.372 2007 306.648 77.888 Source: Hendroko, 2008 a (Courtesy of Ditjen Tan Pangan) (Courtesy of Ditjen Tan Pangan)
Increase Production with
Intensification and Extensification
Intensification and Extensification
Ternary Diagram – Phase Behavior
hano l 80% ETHANOL 20% W
eig
Use Hydrous Ethanol
Wei ght Perc ent E tha 40% 60% 40% 60% ig ht P erce nt W ater 5 20% WATER 80% GASOLINE 80% 60% 40% 20% Weight Percent Gasoline
“Dog Wood” Robert Warren
Sumbangsih
Sumbangsih
pada
masyarakat
masyarakat
dan negara
untuk
Mandiri
Energi
&
&
Membangun Ekonomi PedesaanCD
CD
Bioethanol/
S i it
St
100 ml = 1 jam
Spiritus Stove
j
Kerosene 1 liter = 3-4 jam
Bahenol Berlian Ex Agro Makmur Panca Jaya Raharja Raharja Pressure Stove Ex Berlian Pressure Stove Ex Jerman
Ethanol Stove
with Wick
Regulated FireBlue fire
Bl k S k Black SmokeSoot/ black powdery Clean
Clean Smoke Ethanol Bensin/ gasoline Clean Smoke Ethanol Stove
Ethanol Gel
Ethanol Gel
Eth l l Ethanol gel • Safe • Without Smoke With t S ll • Without Smell •Economics •Multi Purpose Long Duration BIO LAMP •Long Duration200 gr = 2 jam
200 gr 2 jam
Stove Stove Ex South AfricaEthanol Gel Stove
Import Gel p
MOPS 0IL,CPO, BIODIESEL PRICE and IMPACT FOR BD PRODUCER
OCTOBER 2 Th 2008 – JANUARY 8 Th 2009
Okt 08 Nop 08 Des 08 Jan 09
Ob i
d
Thank You
Nodan mamomamo
Спасибо
Teşekkür ederim
Danke schönMerci
Kiitos
Ta di
Gum xia
Obrigado
Thank You
ध यवाद
Спасибо
ًاريخ ﷲ مكازج
Ang kêun
Merci
Efcharisto
Terima kasih
Tawdi
Gracias