Application of Wavelet De-noising Filters in Mammogram
Images Classification Using Fuzzy Soft Set
Saima Anwar Lashari1, Rosziati Ibrahim1, Norhalina Senan1, Iwan Tri Riyadi Yanto2, Tutut Herawan2
1Faculty of Computer Science and Information Technology
Universiti Tun Hussein Onn Malaysia 86400 Parit Raja, Batu Pahat, Johor, Malaysia
2Faculty of Computer Science and Information Technology
University of Malaya
50603 Lembah Pantai,Kuala Lumpur, Malaysia
[email protected], {rosziati,halina}@uthm.edu.my [email protected], [email protected]
Abstract. Recent advances in the field of image processing have revealed that the level of noise in mammogram images highly affect the images quality and classification performance of the classifiers. Whilst, numerous data mining techniques have been developed to achieve high efficiency and effectiveness for computer aided diagnosis systems. However, fuzzy soft set theory has been merely experimented for medical images. Thus, this study proposed a classifier based on fuzzy soft set with embedding wavelet de-noising filters. Therefore, the proposed methodology involved five steps namely: MIAS dataset, wavelet de-noising filters hard and soft threshold, region of interest identification, feature extraction and classification. Therefore, the feasibility of fuzzy soft set for classification of mammograms images has been scrutinized. Experimental results show that proposed classifier FussCyier provides the classification performance with Daub3 (Level 1) with accuracy 75.64% (hard threshold), precision 46.11%, recall 84.67%, F-Micro 60%. Thus, the results provide an alternative technique to categorize mammogram images.
Keywords: Mammogram images; Feature extraction; Wavelet filters; Fuzzy soft set.
1 Introduction
appearance which adversely affects classification accuracy of these images [3]. Moreover, when addressing the digital mammogram images, the emphasis has been to develop algorithms that attempt to improve the imaging quality [4-5]. Thus, de-noising plays an imperative role in the field of image pre-processing, image analysis and classification. However, there has been relatively diminutive research on the noise removal using wavelet de-noising filters for mammogram images [6]. Although, much emphasis have been placed on standard images and other medical images such as (MRI, ultrasound, CT scan)[7-8].
Meanwhile, medical diagnosis and prognosis problems are leading paradigm of decision making in the face of uncertainty [9]. Thus, fuzzy set theory plays a vital role in formalizing uncertainties for medical diagnosis and prognosis [10-11]. To handle uncertainty in the decision making, the use of fuzzy set theory bring in a lot of new methods of decision making such as Mushrif et al., [12] offered a Soft Set Classifier (SSC) for natural textures using soft set theory. However, soft set theory is appropriate for binary numbers although still difficult to handle real numbers [13-14]. For that reason, fuzzy soft set can handle fuzzy attributes (parameters in the form of real numbers) [15-16]. Later, Handaga et al., [17] demonstrated a new application of soft set for numerical data classification by offering a more general concept based on similarity measure between two fuzzy soft sets that is Fuzzy Soft Set Classifier (FSSC), which can handle parameters in the form of real numbers, yet, FSSC has high algorithm complexity.
Limitations of the earlier studies and lack of work on the mammogram images classification using similarity measure on fuzzy soft set motivated the present research. Thus, the present study is intended to increase the mammogram images quality by incorporating wavelet threshold de-noising functions (pre-processing phase) whilst introducing distance measure function for mammogram images classification and named the proposed classifier as FussCyier. Thus, to conduct this study, the proposed methodology involved two scenarios which are stated in Figure 1 and Figure 2. The reason for designing these two scenarios is to observe whether noising images is more effective or getting region of interest (ROI) first then de-noising images, which scenario provides better classification accuracy rate.
2
Wavelet threshold de-noising
Wavelet threshold de-noising is a very efficient method in order to remove noise [18]. Wavelet threshold de-noising is mainly divided into two categories: hard thresholding and soft thresholding.
2.1 Hard Thresholding
Universal threshold is stated in Equation 2[18]
InN 2
(2)where,
refers to standard deviation of the noise N refers to number of data samples in signal2.2 Soft Thresholding
The soft thresholding is stated in equation 3 [18-21]
Mammogram images were collected from the Mammographic Image Analysis Society (MIAS). MIAS dataset consists of 63 benign and 51 malign. Later, wavelet de-noising filters with hard and soft threshold has been done, pseudocode for de-noise mammogram images has been explained in Figure 3[22]. Afterwards, the Region of interest (ROI) has been calculated in order to focus on the important point solely on the appropriate breast region, which lessens the opportunity for erroneous classification. Soon after ROI identification, feature extraction step has done by extracting six features namely: mean, variance, skewness, kurtosis, contrast and smoothness respectively [21-22]. For classification, a classifier has been proposed based on fuzzy soft as stated in Section 3.2.
MIAS dataset
Region of Interest (ROI) identification
Classification Wavelet de-noising filters with
hard and soft threshold
Feature Extraction
MIAS dataset
Wavelet de-noising filters with hard and soft threshold
Classification Region of Interest (ROI)
identification
Feature Extraction
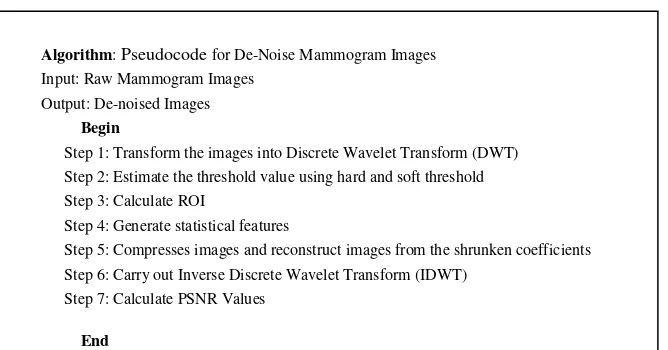
Figure 3. Pseudocode for De-Noise Mammogram Images
3.1 Classification
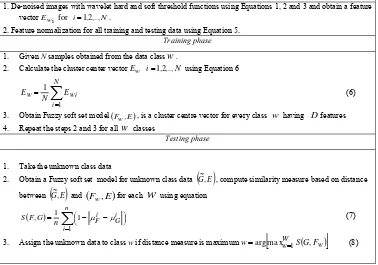
Classification is based on the concept of distance measure between two fuzzy soft sets. A measure of similarity or dissimilarity defines the resemblance between twor objects. Thus, FussCyier comprises of three phases namely pre-processing phase, training phase and testing phase. Pre-processing phase has been incorporated that consists of two steps (a) de-noised images using wavelet hard and soft threshold functions as stated in Section 2.1 and 2.2 (b) feature normalization as stated in equation 5 in both training and testing phases. For training phase, FussCyier is train by calculating the average value of each parameter from all objects with the same class label to construct fuzzy soft set model as shown in Equation 6. For testing phase, FussCyier applied the distance between two fuzzy soft set as stated in the work of Baccour et al., [23] as illustrated in Equation 7. Since, FussCyier measures the distance between image features, intuitively, small distances correspond to higher similarity. Lastly, gives maximum score computed from distance measure to determine class label for the test data as shown in Equation 8. Figure 4 shows the classifier FussCyier for mammogram images classification. Feature normalization is done by dividing each attributes value with the largest value at each attributes [17].
i i
e e fi e
max
(5)
where ei,i1,2,...,n is the old attribute and efi is attribute with new value between
0,1Algorithm: Pseudocode for De-Noise Mammogram Images Input: Raw Mammogram Images
Output: De-noised Images
Begin
Step 1: Transform the images into Discrete Wavelet Transform (DWT) Step 2: Estimate the threshold value using hard and soft threshold
Step 3: Calculate ROI
Step 4: Generate statistical features
Step 5: Compresses images and reconstruct images from the shrunken coefficients
Step 6: Carry out Inverse Discrete Wavelet Transform (IDWT) Step 7: Calculate PSNR Values
Pre-Processing phase
1. De-noised images with wavelet hard and soft threshold functions using Equations 1, 2 and 3 and obtain a feature vectorEwi for i1,2,..,N.
2. Feature normalization for all training and testing data using Equation 5.
Training phase
1. Take the unknown class data
2. Obtain a Fuzzy soft set model for unknown class data
G~,E , compute similarity measure based on distancebetween
G~,E and
Fw,E
for eachw
using equationFigure 4. Mammogram Images Classification Using FussCyier
4
Results and Discussion
Table 1. PSNR values for MIAS after processing through different wavelet filters
Therefore, the applicability of the thresholding functions along with wavelet transforms is well established. When the overall mammogram images de-noising performance is measured, it is found that Daub3 offer better results while compared with the other wavelet filters. The best PSNR value was 46.36423dB (hard thresholding) and 43.66108dB (soft thresholding). Thus, the adoption of different wavelets in order to improve images quality and provides detail visibility without distorting their appearance and shapes were successfully achieved.
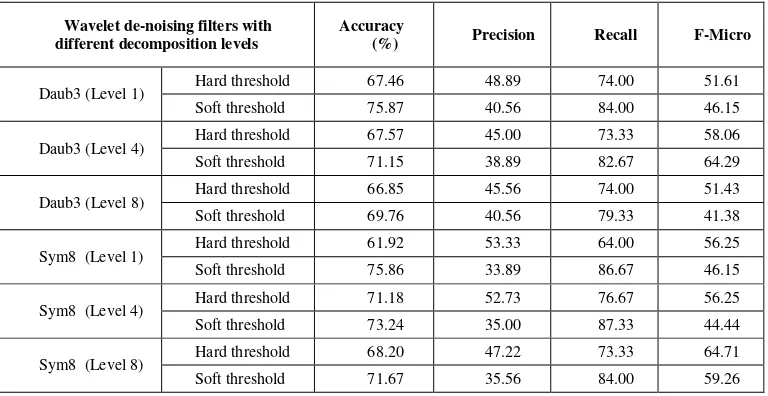
Table 2 illustrates the performance analysis of images de-noising with wavelet thresholding methods for different levels of wavelet decomposition for Scenario 1. Daub3 (Level 1) gives maximum classification rate with accuracy 75.87% (soft threshold), precision 40.56%, recall 84%, F-Micro 46.15% with CPU time 0.0029 seconds, whereas the highest classification rate occurs with filter Sym8 (Level 1) with accuracy 75.86% (soft threshold), precision 33.89%, recall 86.67 %, F-Micro 46.15% with CPU time 0.0028 seconds.
Table 2.Performance Analysis of Images De-Noising With Wavelet Thresholding Methods for Different Levels of Decomposition for Scenario 1
Wavelet de-noising filters with
Table 3 demonstrate the performance analysis of images de-noising with wavelet thresholding methods for different levels of wavelet decomposition for Scenario 2.
Mammogram
Hard 45.89395 46.36423 45.22268 45.74382 41.40651
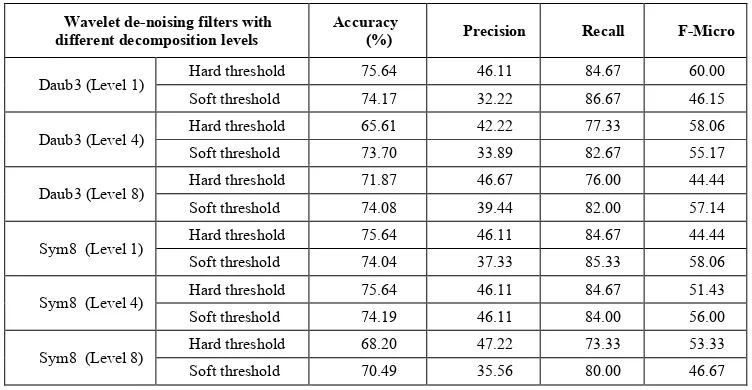
Daub3 (Level 1) offer the utmost classification rate with accuracy 75.64% (hard threshold), precision 46.11%, recall 84.67%, F-Micro 60% with CPU time 0.0032 seconds, whereas the highest classification rate occurs with filter Sym8 (Level 4) with accuracy 75.64% (hard threshold), precision 46.11%, recall 84.67% , F-Micro 51.43% with CPU time 0.0026 seconds.
Table 3.Performance Analysis of Images De-Noising With Wavelet Thresholding Methods for Different Levels of Decomposition for Scenario 2
Wavelet de-noising filters with different decomposition levels
Accuracy
(%) Precision Recall F-Micro
Daub3 (Level 1) Hard threshold 75.64 46.11 84.67 60.00 Soft threshold 74.17 32.22 86.67 46.15
Daub3 (Level 4) Hard threshold 65.61 42.22 77.33 58.06 Soft threshold 73.70 33.89 82.67 55.17
Daub3 (Level 8) Hard threshold 71.87 46.67 76.00 44.44 Soft threshold 74.08 39.44 82.00 57.14
Sym8 (Level 1) Hard threshold 75.64 46.11 84.67 44.44 Soft threshold 74.04 37.33 85.33 58.06
Sym8 (Level 4) Hard threshold 75.64 46.11 84.67 51.43 Soft threshold 74.19 46.11 84.00 56.00
Sym8 (Level 8) Hard threshold 68.20 47.22 73.33 53.33 Soft threshold 70.49 35.56 80.00 46.67
Effectiveness of the proposed Scenario 2 have been thoroughly tested, it can observed from Table 4 that soft threshold provides better classification rate than hard threshold, even slightly better than Scenario 1. In general, de-noising filters perform well for both scenarios. As soft thresholding present more visually satisfying image and decrease the hasty sharp changes that took places in hard Thresholding [24]. Thus, this study can suggest that soft threshold function more appropriate when comes to classification of mammogram images.
4
Conclusion
contributes by extending the robustness of fuzzy soft theory into examining mammogram images within medical image classification domain.
Acknowledgment. The authors would like to thank office for Research, Innovation, Commercialization and Consultancy Management (ORICC) and Universiti Tun Hussein Onn Malaysia for supporting this research under Vote U110.
References
1. Mohanty, A. K., Champati, P. K., Swain, S. K., & Lenka, S. K. A review on computer aided mammography for breast cancer diagnosis and classification using image mining methodology. International Journal of Computer Science and Communication, 2(2), 531-538 (2011).
2. Singh, N., Mohapatra, A. G., & Kanungo, G.: Breast cancer mass detection in mammograms using K-means and fuzzy C-means clustering. International Journal of Computer Applications (0975–8887), 22(2) (2011).
3. Naveed, N., Hussain, A., Jaffar, M. A., & Choi, T. S.: Quantum and impulse noise filtering from breast mammogram images, Computer methods and programs in biomedicine, 108(3), 1062-1069, (2012).
4. James, A. P., & Dasarathy, B. V.: Medical image fusion: a survey of the state of the art. Information Fusion, 19, 4-19 (2014).
5. Saha, M., Naskar, M. K., & Chatterji, B. N.: Soft, Hard and Block Thresholding Techniques for Denoising of Mammogram Images. IETE Journal of Research, 61(2), 186-191 (2015).
6. Sidh, K., Khaira, B. & Virk, I.: Medical image denoising in the wavelet domain using haar and DB3 filtering, International Refereed Journal of Engineering and Science, 1, 1-8 (2012).
7. Taujuddin S. A. M. & Ibrahim, R.: Enhancement of Medical Image Compression by Using Threshold Predicting Wavelet-Based Algorithm”, In Advanced Computer and Communication Engineering Technology. Springer International Publishing , pp. 755-765(2015).
8. Ramani, R., Vanitha, N. S., & Valarmathy, S. :The Pre-Processing Techniques for Breast Cancer Detection in Mammography Images.International Journal of Image, Graphics & Signal Processing, 5(4) (2013).
9. Begum, S. A., & Devi, O. M.: Fuzzy algorithms for pattern recognition in medical diagnosis. Assam University Journal of Science and Technology, 7(2), 1-12 (2011). 10. Zadeh, L. A.: Fuzzy sets. Information and control, 8(3), 338-353. (1965).
11. Steimann, F.: On the use and usefulness of fuzzy sets in medical AI.Artificial Intelligence in Medicine, 21(1), 131-137(2001).
12. Mushrif, M. M., Sengupta, S. & Ray, A. K.: Texture classification using a novel soft set theory based classification algorithm. In: LNCS, Volume 3851, pp.246-254, Springer, Heidelberg (2006).
13. Herawan, T., Deris, M. M., & Abawajy, J. H. Matrices representation of multi soft-sets and its application. In Computational Science and Its Applications–ICCSA 2010 (pp. 201-214) (2010). Springer Berlin Heidelberg.
14. Ma, X., Sulaiman, N., Qin, H., Herawan, T., & Zain, J. M.: A new efficient normal parameter reduction algorithm of soft sets. Computers & Mathematics with Applications,
15. Handaga, B. & Deris M. M.: Similarity approach on fuzzy soft set based numerical data classification. Communications in Computer and Information Science. Volume 180(6), pp. 575-589 (2011).
16. Roy, A. R., & Maji, P. K.: A fuzzy soft set theoretic approach to decision making problems. Journal of Computational and Applied Mathematics,203(2), 412-418(2007). 17. Handaga, B., Herawan, T., & Deris, M. M.: FSSC: An Algorithm for Classifying
Numerical Data Using Fuzzy Soft Set Theory. International Journal of Fuzzy System Applications (IJFSA), 2(4), 29-46 (2012).
18. Zang, Z., Wang & Zheng, Y.: Analysis of signal de-noising method based on an improved wavelet thresholding, In Electronic Measurement & Instruments, 2009. ICEMI'09. 9th International Conference on pp. 1-987, IEEE August (2009)
19. Donoho, D. L., Johnstone, I. M., Kerkyacharian, G & Picard, D: Wavelet shrinkage: asymptopia?, Journal of the Royal Statistical Society. Series B (Methodological), 301-369 (1995)
20. Daubechies, I: Ten lectures on wavelets, Philadelphia: Society for industrial and applied mathematics, Vol. 61, pp. 198-202 (1992)
21. Aarthi, R., Divya, K. & Kavitha, S.: Application of Feature Extraction and Clustering in Mammogram Classification using Support Vector Machine. Third International Conference on Advanced Computing (ICoAC), pages 62-67 (2011).
22. Lashari, S. A., Senan, N., & Ibrahim, R.: Effect of presence/absence of noise in mammogram images using fuzzy soft set based classification. In Computing Technology and Information Management (ICCTIM), 2015 Second International Conference on (pp. 55-61) (2015) IEEE.
23. Baccour, L., Alimi, A. M., & John, R. I. (2014). Some Notes on Fuzzy Similarity Measures and Application to Classification of Shapes, Recognition of Arabic Sentences and Mosaic. IAENG International Journal of Computer Science, 41(2), 81-90.