EFFECT OF METHANE GAS FLOW RATE ON ADSORPTION CAPACITY AND TEMPERATURE DISTRIBUTION OF ACTIVATED CARBON
M.Idrus Alhamid1, Nasruddin1, Senoadi2, M. Bayu Perdana1, Ratiko3*
1
Department of Mechanical Engineering, Faculty of Engineering, Universitas Indonesia, Kampus Baru UI Depok, Depok 16424, Indonesia
2
Department of Mechanical Engineering, Trisakti University, 11440 Jakarta, Indonesia
3
National Nuclear Energy Agency of Indonesia (BATAN), 15314 Tangerang, Indonesia
(Received: April 2015 / Revised: August 2015 / Accepted: October 2015)
ABSTRACT
Adsorbed Natural Gas (ANG) is one of the gas storage methods which specialize in low pressure. This method is more competitive compared to Compressed Natural Gas (CNG). ANG is based on an adsorption process that involves adsorbate and adsorbent. This research is conducted to observe the effects of gas flow-rate on adsorption capacity and the temperature distribution of adsorbent. The adsorbent is a commercially activated carbon, and methane gas is the adsorbate. Methane flow rates are 1 standard liter per minute (SLPM) and 20 SLPM. Temperature in the pressure vessel is maintained at 25°C and the pressure at 3.5 MPa. The result shows that the adsorption capacity of activated carbon is higher at a lower gas flow rate. While a higher gas flow rate causes a higher temperature difference in the adsorption and in desorption process.
Keywords: Adsorbed natural gas; Commercially activated carbon; Isothermal
1. INTRODUCTION
In comparing hydrocarbon fuels (e.g. diesel fuel, butane, gasoline, etc.), compressed natural gas (CNG) has a higher heating value, which is about 50.1 MJ/kg (Elgin & Hagen, 2015; Khan et al., 2015). The most critical problem of CNG storage is the high pressure, which could reach 20 MPa. This high pressure on CNG storage needs special handling.
The adsorbed natural gas (ANG) technique could be applied to overcome these problems (Bastos-Neto et al., 2007; Mota, 2008; Vasiliev et al., 2000). In this method, high pressure natural gas is adsorbed by activated carbon (adsorbent) (Alcañiz-Monge et al., 2009; Menon & Komarneni, 1998; Quinn & MacDonald, 1992). This adsorption process could reduce the pressure up to 3.5–4.0 MPa. So the storage will take place in a low pressure condition (Pupier et al., 2005).
The adsorption process is a physical phenomenon in which adsorbent particles will attach to the surface of adsorbate in isothermal conditions. An adsorbent is a substance which is able to adsorb and contain a definite amount of a fluid substance, whereas, the adsorbate is a substance that is adsorbed by an adsorbent. There are several kinds of adsorbent which are commonly used, i.e. zeolite, silica gel, and activated carbon. From these three kinds of adsorbents, activated carbon is most often used, due to its wide application and amount of adsorption capacity.
The adsorption process consists of adsorption (charge to adsorbent) and desorption (discharge from adsorbent). Characteristics of the adsorption-desorption process are among the parameters used to determined ANG performance (Chang & Talu, 1996; Santos et al., 2009).
Characterization of the adsorption process can be done with several measuring methods, of which one of these is a volumetric method. Volumetric methods measure adsorption capacity and ability by using pressure changes per hour at a constant temperature. This method of measurement is known as isothermal adsorption (Aristov et al., 2008). The volumetric method is used in the methane measuring installation, due to the similarity of its parameters with a methane adsorption testing device.
The other method that has been used in gas adsorption study is the gravimetric method. If the volumetric method is employed for the surface characteristics analysis, then the gravimetric method is adopted for gas adsorption measurements. (Thu et al., 2014).
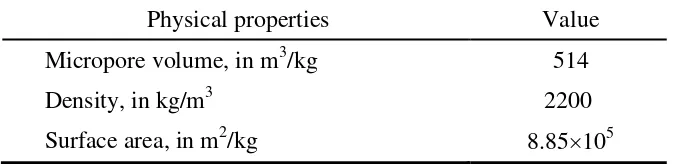
There are several aspects that influence the performance of ANG storage (Pupier et al., 2005), namely the nature of the microporous solid (Biloe et al., 2002; Lozano-Castelló et al., 2002a; Lozano-Castello et al., 2002b; Matranga et al., 1992), the packing adsorbent scale (Biloe et al., 2001a; Burchell & Rogers, 2001; MacDonald & Quinn, 1998), the scale of ANG vessel (Biloe et al., 2001b; Chang & Talu, 1996) and the influence of the composition of natural gas during successive cycles of charge and discharge (Dvorak & Hodrien, 2001; Mota, 1999; Pupier et al., 2005; Seki & Sumie, 2001). adsorbate was methane gas. The Carbotech physical properties are shown in Table 1.
Table 1 Thermo-physical properties of Carbotech (Martin et al., 2011)
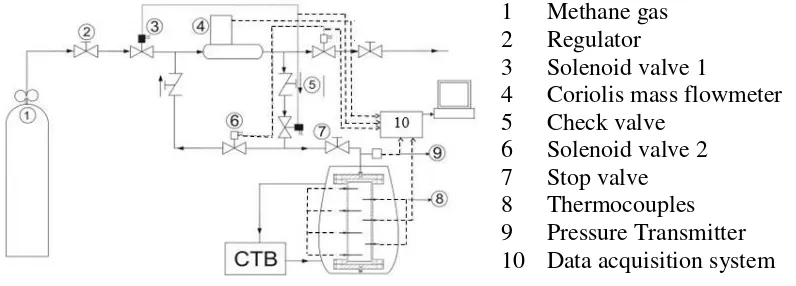
accommodate pressure up to 4 MPa. The pressure vessel in this study is a vertical cylinder form with a volume of 4.64 liters, as shown in Figure 1.
Figure 1 Pressure vessel
The experiment scheme in this study is presented in Figure 2. As shown in Figure 2, the methane gas from the source tank flows to the pressure vessel that has been filled with activated carbon. In the pressure vessel, the high-pressure methane gas is adsorbed by activated carbon. Temperature and pressure are measured using a Data Acquisition System (DAQ). The Coriolis mass flow meter is used to measure gas mass flow. The procedures of the isothermal adsorption in this study are:
- To start with the degassing process that purifies the activated carbon (El-Sharkawy et al., 2006). To remove impurities in the activated carbon in the pressure vessel, Helium gas flows into the vessel. Furthermore, a vacuuming process then is performed on the vessel. - The Circulating Thermal Bath (CTB), as shown in Figure 2, is operated to maintain the
temperature in the pressure vessel at a constant of 25 ± 0.1oC. When the temperature in the pressure vessel is stable at a temperature of 25oC, then the solenoid valve is opened.
- The methane gas enters the pressure vessel, so that the pressure reaches 3.5 MPa. If the pressure surpasses 3.5 MPa, then the solenoid valve will be automatically closed.
- Data recording begins when the unstable condition of the measuring cell occurs and finishes when measuring cell reaches its stable condition.
- All pressure, temperature and flow-rate data will be recorded in a computer.
3. RESULTS AND DISCUSSION
3.1. Effect of the Methane Gas Flow Rate on Adsorption Capacity
The important parameter for the adsorption and desorption process in the ANG system is the gas adsorption/desorption capacity ratio. This parameter is defined as follow:
1 Methane gas 2 Regulator
3 Solenoid valve 1
4 Coriolis mass flowmeter 5 Check valve
6 Solenoid valve 2 7 Stop valve 8 Thermocouples 9 Pressure Transmitter 10 Data acquisition system
Gas adsorption/desorption capacity ratio =
= (2)
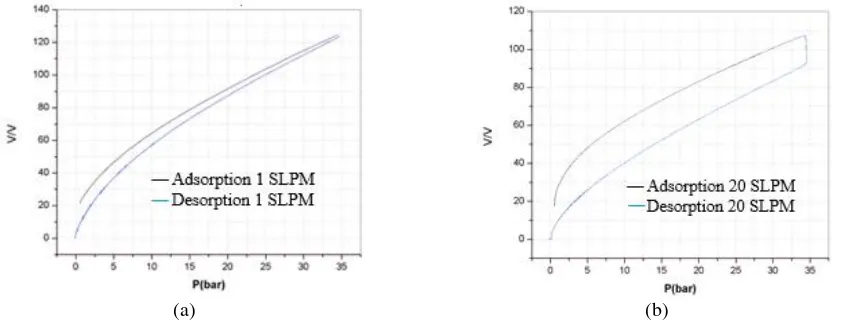
In this study, the changes in gas adsorption and desorption capacity ratio is a function of vessel pressure for the 1 SLPM gas flow rate as shown in Figure 3a.
(a) (b)
Figure 3 V/V vs adsorption- & desorption pressure in the: (a) 1 SLPM flow rate; (b) 20 SLPM flow rate
The graphs show that the adsorption capacity ratio of methane gas is 124.42 V/V. With a 4.608 liter of activated carbon, the methane gas volume can be calculated as follows:
Vmethane gas = Vpressure vessel adsorption capacity ratio (3)
The methane gas volume is 4.608 liter 124.42 V/V = 573.32 liters.
It can be seen from the desorption process in Figure 3a that the adsorbed methane gas in activated carbon cannot be completely released. There is residue over the amount of methane in the activated carbon of 22.98 V/V. When multiplied by an activated carbon volume of 4.608 liters and then the gas residue volume will be 105.92 liters.
A similar graph of the 20 SLPM methane gas flow rate is presented in Figure 3b. Almost the same as Figure 3a, it can be shown from the desorption graph, that the desorption process stopped at 16.36 V/V, which means that there is still methane gas in the activated carbon. Multiplied by the activated carbon volume of 4.608 liters, the methane gas residue volume is then 75.39 liters.
It can be seen in Figure 3b, the storage capacity ratio at 34 bar is (3.4 MPa) the V/V value increases, while the pressure is relatively stable. The reason for this phenomenon is at the high flow rate, the adsorption process needs a longer time than the pressure rise process. From the graph, it can be observed, that the capacity ratio of the activated carbon is 107.29 V/V (lower than the capacity ratio at 1 SLPM). With the volume of activated carbon at 4.608 liters, the volume of methane gas is then calculated at 494.47 liters.
Table 2 The ANG storage capacity at various flow rates
Gas flow rate Gas volume (liter) Gas residue volume (liter)
Storage capacity (liter)
01 SLPM 573.3 105.9 467.4
05 SLPM 527.0 82.9 444.1
10 SLPM 506.9 81.6 425.3
15 SLPM 501.1 76.3 424.8
20 SLPM 494.5 75.4 419.1
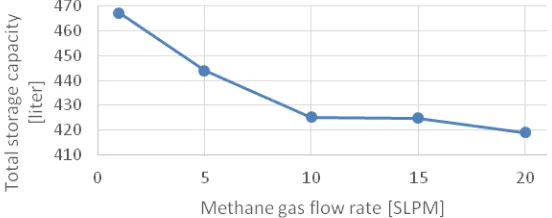
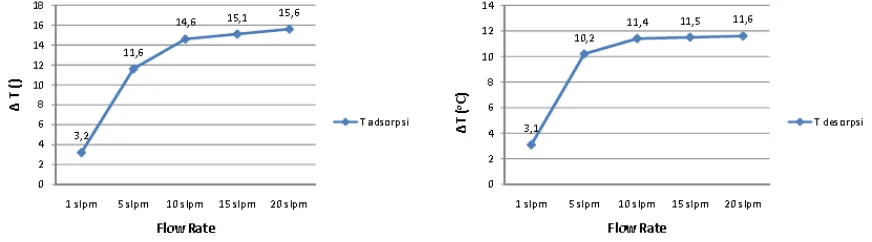
It can also be concluded that in lower flow rates, the total adsorption storage capacity is higher, as shown in Figure 4.
Figure 4 Total adsorption storage capacity (liter) vs methane gas flow rate (SLPM)
3.2. Effect of Methane Gas Flow Rate on Temperature Distribution
During the adsorption process, the adsorbate is banded at the adsorbent surface by Van der
Waals’ force. This process is exothermic; this will make the adsorbent temperature increase. In
the opposite condition, the desorption process is an endothermic reaction.
The temperature change in the vessel can be obtained as shown in Equation 4 (Samid, 2011):
(4)
T0 is initial temperature, Tm is mean temperature, which can be obtained from multiplication of the temperature with the volume around the thermocouple (Ti with Vi).
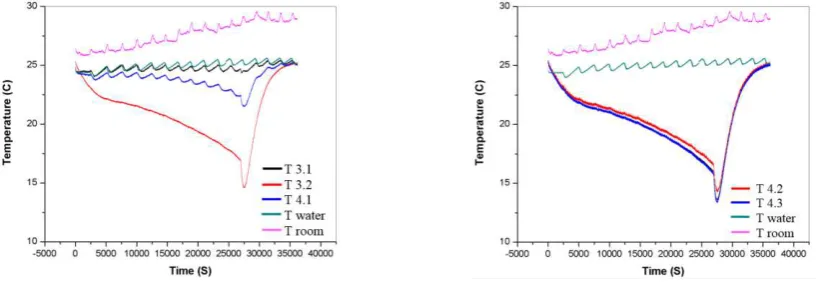
3.2.1. Adsorption at the 1 SLPM gas flow rate
As shown in Figure 1, the area of the storage vessel tank is divided into two sections. The first section is upper side of the tank. This is not filled with activated carbon. In this area, there are three thermocouples measurement points, namely 3.1, 3.2, and 4.1. Comparing the thermocouples 3.1 and 4.1, the thermocouple 3.2 is injected 5 cm deeper into the activated carbon.
The second section is the activated carbon area. This area is fully filled with activated carbon. Similarly with the first section, there are three points of investigation and these are coded as 3.3, 4.2, and 4.3, respectively.
temperatures in 3.1 and 4.1, respectively are relatively unchanged. However, the temperature in 3.2 has increased from 25oC to 32.5oC and then it moved slowly downwards. This is due to the location of thermocouple 3.2, which is close to the activated carbon area. The activated carbon releases heat during the adsorption process, which is exothermic reaction. The temperatures in 3.1 and 3.2 do not increase because the thermocouples 3.1 and 4.1 are located far away from the activated carbon area.
Figure 5Temperature vs adsorption time with the 1 SLPM flow rate
In the right side of Figure 5, which is an activated carbon area, the temperatures in 3.3 and 4.3 have increased by about 8°C, from 25°C to 33°C, respectively. In 4.2 the temperatures increased by only a smaller value, due to its location, above 3.3 and 4.1. It is close to the border with first area. As above mentioned, in the first area, no exothermic reaction occurs.
3.2.2. Desorption at the 1 SLPM gas flow rate
During the endothermic desorption process, as shown in Figure 6, the maximum temperature in 3.2 decreases by 11°C, while in points 3.1 and 4.1, the temperatures only decrease slightly. The thermocouples performance (3.2, 3.1, 4.1, respectively) and also for the thermoccouples in second area are a similar explanation with the previous adsorption chapter.
Figure 6Temperature vs desorption time with the 1 SLPM flow rate
3.2.3. Adsorption at the 20 SLPM gas flow rate
Figure 7Temperature vs adsorption time with the 20 SLPM flow rate
3.2.4. Desorption at the 20 SLPM gas flow rate
The temperature distribution by desorption process at the 20 SLPM flow rate is shown in Figure 8. In first area (upper side area) and also in second area (the activated carbon area), the decrease in temperature (which is caused by an endothermic process) reaches the value of -16oC. Similar at the 1 SLPM flow rate, the temperatures in 3.1 and 4.1, respectively have only slightly increased because they are far from the activated carbon area.
Figure 8 Temperature vs desorption time with the 20 SLPM flow rate
It can be concluded that in an adsorption natural gas system, the higher gas flow rate causes a higher increase of vessel temperature. In the desorption process, the higher gas flow rate causes also higher values with the vessel temperature decrease.
With the mean temperature equation (Equation 4), the effect of the methane gas flow rate on the temperature difference can be shown in Figure 9.
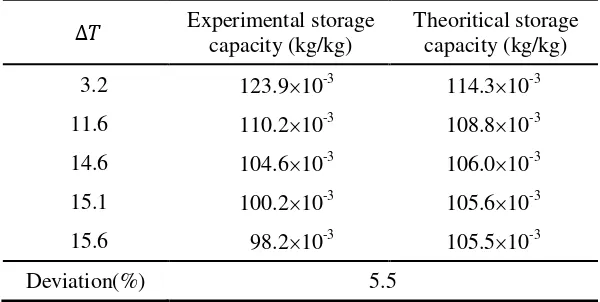
The experimental results in this study can be compared with the theoretical calculations. The Dubinin-Astakhov theoretical equation was used to determine the influence of the microporous characteristics of activated carbon in the ANG system (Biloe et al., 2002).
By entering all the carbotech properties in the Dubinin-Astakhov equation and then comparing these with the experimental results, the comparison table can be obtained, as shown in Table 3.
Table 3Comparison between experimental data and theoretical calculations of ANG storage capacity at various temperature difference
Experimental storage capacity (kg/kg) Theoritical storage capacity (kg/kg)
3.2 123.910-3 114.310-3
The new finding of the study was that by lowering the flow rate of methane gas, the adsorption capacity becomes higher. This phenomenon could be explained that by lowering methane flow rate, the activated carbon had enough time to adsorb the methane perfectly.
In desorption process, the higher methane gas flow rate causes a slightly better discharge ability; the gas residue in activated carbon is lower. However, as described above, in overall, the total adsorption capacity of the activated carbon is better at a lower flow rate.
The methane gas flow rate affects the temperature distribution in the pressure vessel, where the gas adsorption process has taken place. The higher methane gas flow rate causes higher temperature differences in the adsorption and desorption process.
5. REFERENCES
Alcañiz-Monge, J., Lozano-Castelló, D., Cazorla-Amorós, D., Linares-Solano, A., 2009. Fundamentals of Methane Adsorption in Microporous Carbons. Microporous and Mesoporous Materials, Volume 124(1), pp. 110116
Aristov, Yu, I., Dawoud, B., Glaznev, I.S., Elyas, A., 2008. A New Methodology of Studying the Dynamics of Water Sorption/Desorption under Real Operating Conditions of Adsorption Heat Pumps: Experiment. International Journal of Heat and Mass Transfer,
Volume51(19), pp. 49664972
Bastos-Neto, M., Canabrava, D.V., Torres, A.E.B., Rodriguez-Castellon, E., Jimenez-Lopez, A., Azevedo, D.C.S., Cavalcante, C.L., 2007. Effects of Textural and Surface Characteristics of Microporous Activated Carbons on the Methane Adsorption Capacity at High Pressures. Applied Surface Science, Volume253(13), pp. 57215725
Biloe, S., Goetz, V., Guillot, A., 2002. Optimal Design of an Activated Carbon for an Adsorbed Natural Gas Storage System. Carbon, Volume 40(8), pp. 12951308
Biloe, S., Goetz, V., Mauran, S., 2001b. Dynamic Discharge and Performance of a New Adsobent for Natural Gas Storage. American Institute of Chemical Engineers. AIChE Journal, Volume 47(12), pp. 2819
Burchell, T.D., Rogers, M.R.,2001. Carbon Fibers based Natural Gas Storage Monoliths.
Paper presented at the Extended Abstract, Gas storage workshop, Kingston
Chang, K.J., Talu, O., 1996. Behavior and Performance of Adsorptive Natural Gas Storage Cylinders during Discharge. Applied Thermal Engineering, Volume 16(5), 359374
Dvorak, K., Hodrien, R.C., 2001. Development of Adsorbed Natural Gas Technology for Large Scale Diurnal Storage Applications. Paper presented at the International Gas Research Conference
El-Sharkawy, I.I., Kuwahara, K., Saha, B.B., Koyama, S., Ng, K.C., 2006. Experimental Investigation of Activated Carbon Fibers/Ethanol Pairs for Adsorption Cooling System Application. Applied Thermal Engineering, Volume 26(8), pp. 859865
Elgin, R.C., Hagen, C.L., 2015. Development and Operation of a Self-refueling Compressed Natural Gas Vehicle. Applied Energy, Volume 155, 242252
Khan, Muhammad Imran, Yasmin, Tabassum, Shakoor, A., 2015. Technical Overview of Compressed Natural Gas (CNG) as a Transportation Fuel. Renewable and Sustainable Energy Reviews, Volume 51, 785797
Lozano-Castelló, D., Cazorla-Amorós, D., Linares-Solano, A., 2002a. Can Highly Activated Carbons be Prepared with a Homogeneous Micropore Size Distribution? Fuel Processing Technology, Volume 77, pp. 325330
Lozano-Castello, D., Cazorla-Amoros, D., Linares-Solano, A., Quinn, D.F., 2002b. Influence of Pore Size Distribution on Methane Storage at Relatively Low Pressure: Preparation of Activated Carbon with Optimum Pore Size. Carbon, Volume 40(7), pp. 9891002
MacDonald, J.A.F., Quinn, D.F., 1998. Carbon Absorbents for Natural Gas Storage. Fuel,
Volume 77(1), 6164
Martin, Awaludin, Loh, Wai Soong, Rahman, Kazi Afzalur, Thu, Kyaw, Surayawan, Bambang, Alhamid, M. Idrus, Ng, Kim Choon., 2011. Adsorption Isotherms of CH4 on Activated Carbon from Indonesian Low Grade Coal. Journal of Chemical & Engineering Data,
Volume 56(3), pp. 361367
Matranga, Kimberly, R., Myers, Alan, L., Glandt, Eduardo, D., 1992. Storage of Natural Gas by Adsorption on Activated Carbon. Chemical Engineering Science, Volume 47(7), pp. 15691579
Menon, V.C., Komarneni, S., 1998. Porous Adsorbents for Vehicular Natural Gas Storage: A Review. Journal of Porous Materials, Volume 5(1), pp. 4358
Mota, José Paulo., 2008. Adsorbed Natural Gas Technology. Recent Advances in Adsorption Processes for Environmental Protection and Security, pp. 177192, Springer
Mota, Jose P.B., 1999. Impact of Gas Composition on Natural Gas Storage by Adsorption.
AIChE Journal, Volume 45(5), pp. 986996
Parkyns, N.D., Quinn, D.F., Patrick, J.W., 1995. Porosity in Carbons. Edward Arnold, London, p. 291
Pupier, O., Goetz, V., Fiscal, R., 2005. Effect of Cycling Operations on an Adsorbed Natural Gas Storage. Chemical Engineering and Processing: Process Intensification, Volume 44(1), pp. 7179
Quinn, D.F., MacDonald, J.A., 1992. Natural Gas Storage. Carbon, Volume 30(7), pp. 10971103
Santos, J.C., Marcondes, F., Gurgel, J.M., 2009. Performance Analysis of a New Tank Configuration Applied to the Natural Gas Storage Systems by Adsorption. Applied Thermal Engineering, Volume 29(11), pp. 23652372
Seki, K., Sumie, Y., 2001. Development of Adsorptive Natural Gas Storage System— Application to Gas Holder and Natural Gas Vehicle. In: Proceedings of IGRC, Amsterdam, pp. 308315
Thu, Kyaw, Kim, Young-Deuk, Ismil, Azhar Bin, Saha, Bidyut Baran, Ng, Kim Choon., 2014. Adsorption Characteristics of Methane on Maxsorb III by Gravimetric Method. Applied Thermal Engineering, Volume 72(2), 200205