Scoping study on modelling of ecological community distribution in
South Sumatra, Indonesia
Markus U. Müller and Robbie Price
Landcare Research
Prepared for:
Deutsche Gesellschaft für Internationale Zusammenarbeit (GIZ) GmbH
Biodiversity and Climate Change (BIOCLIME) Project
Dag-Hammarskjöld-Weg 1 – 5 65760 Eschborn
Federal Republic of Germany
March 2015
Landcare Research, Gate 10 Silverdale Road, University of Waikato Campus, Private Bag 3127, Hamilton 3240, New Zealand, Ph +64 7 859 3700, Fax +64 7 859 3701,
Reviewed by: Approved for release by:
Fraser Morgan Senior Geographer Landcare Research
Bill Lee
Portfolio Leader – Managing Biodiversity Landcare Research
Landcare Research Contract Report: LC2417
Disclaimer
This report has been prepared by Landcare Research for Deutsche Gesellschaft für Internationale Zusammenarbeit (GIZ) GmbH. If used by other parties, no warranty or representation is given as to its accuracy and no liability is accepted for loss or damage arising directly or indirectly from reliance on the information in it.
© Deutsche Gesellschaft für Internationale Zusammenarbeit (GIZ) GmbH 2015
Client Feedback Form
Landcare Research would greatly value your views on this project and our service delivery to you and your organisation. We would appreciate it if you would take a few moments to fill out this brief survey then return it to the address below. Your feedback will help us improve our project management and delivery, and service relationships.
The form can be returned to us by email to [email protected]
Your organisation:
Project Title (or Report Title):
Strongly Agree
Agree Uncertain Disagree Strongly Disagree
The project delivered is what we needed. ☐ ☐ ☐ ☐ ☐
As the client, I felt involved in and
consulted on the project from the start. ☐ ☐ ☐ ☐ ☐
I was kept in the loop about the progress of the project, including any issues or
delays. ☐ ☐ ☐ ☐ ☐
Any issues I raised or input I provided
were dealt with in a responsive way. ☐ ☐ ☐ ☐ ☐
The project was delivered on time. ☐ ☐ ☐ ☐ ☐
The project met our quality standards. ☐ ☐ ☐ ☐ ☐
What impressed you most about this project?
What improvements do you suggest for future projects?
Contents
Summary ... v
1 Introduction... 1
2 Background ... 1
3 Project area ... 2
4 Objectives ... 4
5 Interviews with stakeholders and potential data providers ... 4
6 Field trip to selected sites inside the project area ... 6
7 Analysis of available datasets ... 7
8 Comparison of Tandem-X, ASTER GDEM and SRTM ... 12
9 Data concept ... 13
10 Conclusions ... 14
11 Proposed next steps ... 16
12 Additional recommendations ... 17
13 References ... 18
Summary
A scoping study for the application of community distribution modelling using the gradient forest (GF) method at the BIOCLIME project site in South Sumatera, Indonesia, was carried out. The study included a field visit across the sites and interviews with potential data providers in Bogor, Jakarta, and Palembang. The field visit provided an overview of the current condition of the four major ecosystem types: mangrove forest, peat swamp forest, lowland dry forest, and montane forest. Three digital elevation models were developed and compared for their usage in the project context considering spatial resolution, accuracy, and coverage. Based on the information obtained from stakeholder interviews, we developed a data concept describing the input datasets of a GF analysis.
We concluded that it is not advisable to carry out a new ecosystem classification using GF for several reasons:
The biodiversity data available remain patchy and incomplete
As two of the ecosystems in the project area are currently represented only by degraded and fragmented remnants, new surveys cannot guarantee to
adequately represent all natural ecosystems
A detailed spatial and compositional study of ecosystem types, condition, and distribution was already available (Laumonier 1997).
Rather than creating a new ecosystem classification, we recommend acquiring and making use of the Laumonier study.
It was therefore concluded to focus the next phase of activities on better understanding the future pressures on these ecosystems induced by climate change.
1
Introduction
Through the Biodiversity and Climate Change Project (BIOCLIME), Germany supports
Indonesia’s efforts to reduce greenhouse gas emissions from the forestry sector, to conserve biodiversity of High Value Forest Ecosystems, maintain their Carbon stock storage
capacities, and implement sustainable forest management for the benefit of the people. Germany’s immediate contribution will focus on supporting the Province of South Sumatera to develop and implement a conservation and management framework to lower emissions from its forests, contributing to the GHG emission reduction goal Indonesia has committed itself to reach by 2020.
To be able to manage and conserve biodiversity, information about the spatial distribution of organisms at the ecosystem community level is needed. As natural ecosystems are now under pressure not only from human activities, but increasingly also from climate change, it becomes necessary to understand the cumulative effects of these pressures on biodiversity. Community distribution modelling using the gradient forest method can help determine the impacts and responses of biodiversity to these threats (Ellis et al. 2012).
This report summarises the findings of the first phase of the project: a scoping study was carried out to identifying the requirements and challenges of applying the gradient forest method to the BIOCLIME project area in South Sumatera.
2
Background
The major aim of the wider project is to analyse the influence of physical predictors (i.e. parameters relating to climate, topography and soil) on current biodiversity patterns. It is possible to learn about the factors influencing an ecosystem with this approach as well as identify spatial patterns of ecosystem distribution. This information can also be applied to climate change scenarios to predict future pressures on biodiversity and become an important input into the spatial planning process at district as well as provincial level.
Gradient forest (GF) analysis is one of the available methods for modelling the distribution of communities of biological species. As a method it is similar to the better known
generalized dissimilarity modelling (GDM), but uses different statistical techniques. It predicts spatial patterns of turnover in community composition (beta diversity) on the regional scale. The models can be applied to a number of applications such as the visualisation of spatial pattern in community composition, environmental classification, survey gap analysis, conservation assessment and climate change impact assessment (Ferrier et al. 2007), all of which are relevant to the BIOCLIME project.
The core analysis method, and therefore the basis of all other analyses of GF, is to create functions that relate environmental variables representing climate, soils, and topography to compositional turnover of ecological communities. The most important requirement therefore is that reliable spatial layers of the relevant environmental factors, as well as
georeferenced biodiversity data are available. These data requirements may pose a
Scoping study on modelling of ecological community distribution in South Sumatra, Indonesia
Page 2 Landcare Research
Besides better understanding of community composition and the importance of the different environmental factors, community distribution modelling can also produce results that are directly relevant to the aims of the BIOCLIME project. Maps of the potential distribution of the different ecosystems can become valuable input for conservation planning when combined with maps of current, actual distribution of land cover; they can also help direct restoration efforts to suitable areas. The analysis can be extended and combined with climate change predictions to provide maps of biodiversity response to expected pressure induced by future climate change.
3
Project area
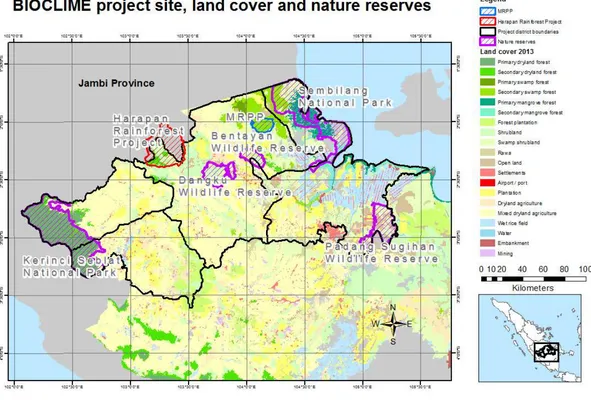
The BIOCLIME project area consists of the four districts Musi Rawas, Musi Rawas Utara, Musi Banyuasin, and Banyuasin, which together make up the northern part of the province of South Sumatera and are adjacent to Jambi province in the north. Figure 1 shows the official land cover map of South Sumatera, together with boundaries of the project area. The area is characterized by four major natural ecosystems: i) mangrove forest on the East coast; ii) peat swamps; iii) (dryland) lowland forest; and iv) montane forest to the West. Minor ecosystems include riparian forest, freshwater-swamp forest, heath forest, and Ironwood forest. Ironwood forest formerly dominated most of the South Sumatran landscape but is now almost extinct (Witten et al. 1997).
Two national parks and three wildlife reserves occur in the project area: Sembilang national park to the East, and Kerinci Seblat national park to the West, which are respectively characterised by mangrove/swamp forest and montane forest that are still relatively undisturbed by human activities. The three wildlife reserves, which presumably cover lowland forest area, are heavily modified and consist of degraded forest and shrubland.
Two other significant conservation areas need to be mentioned as they represent significant areas of forest outside the official protected areas: the Harapan rainforest project in the north, which is partly inside Jambi province, and the Merang REDD Pilot project (MRPP) in the middle of the peat land areas to the west of Sembilang National Park.
The Harapan Rainforest project was established by a consortium of NGOs that have a special ecosystem restoration license issued by the Indonesian Ministry for Forestry. The project aims at conserving and restoring the last remnant of lowland forest, which is also one of the few habitats of the Sumatran Tiger.
Scoping study on modelling of ecological community distribution in South Sumatra, Indonesia
Scoping study on modelling of ecological community distribution in South Sumatra, Indonesia
Page 4 Landcare Research
4
Objectives
The objectives of the scoping study are as follows:
Evaluation and documentation of the requirements, challenges and benefits of the application of the gradient forest method to the BIOCLIME project area
Analysis of relevant stakeholders and data providers
Creation of a list of datasets (species surveys and environmental factors) that can be used as input data. Identification of available datasets as well as additional data needs and creation of a data concept (i.e. a list of input datasets for the GF analysis)
Processing of TanDEM-X Intermediate DEM data and publicly available DEMs for the project area and comparison of available DEM datasets regarding resolution and quality
Scoping of the implementation of the gradient forest method and its application to available data
Scoping of the utilisation of the method with focus on adaptation on climate change.
Two other BIOCLIME project activities are also considered in this scoping study. A
biodiversity survey is planned for 2016/2017 that will encompass both flora and fauna of the study area. Additionally, a remote sensing analysis with a focus on biomass/carbon stock monitoring, land cover mapping, and assessment of the historic fire regime has already started. The study will make use of SPOT6 as well as LiDAR data.
5
Interviews with stakeholders and potential data providers
We visited Indonesia between 23 January to 6 February 2015 to interview stakeholders and potential data providers in Bogor, Jakarta, and Palembang. Identified datasets and providers are listed below and additional findings are documented.
Ariyanto Wibowo, GIZ, formerly worked in a cooperation project with BMKG (the Indonesian Agency for Meteorological, Climatological and Geophysics),
Jakarta 23 January
Official climate data from 1970 to the present is available and can be directly downloaded from the BMKG website (http://www.bmkg.go.id/BMKG_Pusat/). Unfortunately, only two climate stations are situated inside the province of South Sumatera.
Lilik Budi Prasetyo, Professor for Landscape Ecology at Institut Pertanian Bogor (IPB, Bogor Agricultural University), Bogor 24 January
Scoping study on modelling of ecological community distribution in South Sumatra, Indonesia
Inventory (NFI) as well as the periodical surveys made by concession holders (Inventarisasi Hutan Menyeluruh Berkala, IHMB), he remarked that they could be used as biodiversity datasets, although only tree species that are of commercial value are recorded and usually not to species but only to genus level.
Andjar Rafiastanto, Mark Witcomb, Zoological Society of London (ZSL), Bogor 24 January
Biodiversity surveys were carried out in the Berbak (Jambi province) and Sembilang areas
Permanent Sample Plots were set up for carbon estimation in Berbak (Jambi province)
Adong Tarigan, Provincial forestry service of South Sumatera, Palembang 27 January
Data from the GTZ MRPP project includes comprehensive coverage of peat attributes, plant biodiversity and a number of other subjects
Zulfikhar, Provicial forestry service of South Sumatera, Palembang 27 January
Pak Zulfikhar is the direct counterpart of the BIOCLIME project from the provincial forestry service. He explained the general background and set-up of the project and points out that any kind of research carried out inside the project has to be pragmatic and applicable.
Badan Penelitian Kehutanan (BPN, Agency for forest research), Palembang 28 January
BPN does research about silviculture and forest plantation. No relevant datasets are available.
Badan Konservasi Sumber Daya Alam (BKSDA, Agency for nature conservation), Palembang 28 January
BKSDA is responsible for conservation areas which are not national parks, including three wildlife reserves. The following two relevant datasets were identified:
Tiger and elephant survey data from a number of locations in the province
Scoping study on modelling of ecological community distribution in South Sumatra, Indonesia
Page 6 Landcare Research
Universitas Muhammadiyah (Muhammadiyah University), Palembang 29 January
Two research projects were identified that could provide valuable biodiversity data:
‘Managemenen kesesuaian ekosistem mangrove taman nasional Sembilang
berdasarkan kondisi lingkungan (biotik, abiotik dan sosekbud) kawasan pantai timur Sumatera Selatan’ (Adapted management of the mangrove ecosystem in Sembilang national park based on the environmental condition (biotic, abiotic and
social-economic) east coast of South Sumatera) by Yetty Hastiana Hasyim, which includes a vegetation survey of several sites in the Sembilang national park.
‘Analisa vegetasi hutan mangrove di Sungai Terusan dalam taman nasional Sembilang kabupaten Banyasin provinsi Sumatera Selatan’ (Analysis of the mangrove forest vegetation at Sungai Terusan in Sembilang national park, Banyasin district, South Sumatera province) by Drs Sale Rusbandi and Yuspri Ariansyah, which includes a vegetation survey at one site in the Sembilang national park
Taman Nasional Sembilang (TNS, Sembilang national park), Palembang 29 January
Worked together with ZSL on camera trapping of the Sumatran Tiger
Has 15 permanent vegetation sample plots for mangrove and associated swamp area
Universitas Sriwijaya (UNSRI, Sriwijaya University), Palembang 30 January
UNSRI regularly performs environmental impact assessments (AMDAL) that include surveys of physical and chemical soil properties. As data associated with the AMDAL process are confidential, only data sub-samples can be made available.
6
Field trip to selected sites inside the project area
From 1 to 5 February 2015 a field trip to chosen representative locations was made to acquire an overview of the major ecosystems in the project area. The initial plan was to visit sites representative of the four major ecosystems (lowland, montane, peat and mangrove forest). Due to time constraints, logistical problems during the journey, and difficult accessibility, this aim could be only partly achieved.
Montane forest inside the Kerinci Seblat national park could be observed from a distance of around 2 km from the border of the national park. Although several settlements are
situated inside the area of the national park, the impression was that large areas are still undisturbed as indicated by an intact canopy.
A much degraded lowland forest near the Dangku area was visited and the activities of illegal loggers could be heard. The two wildlife reserves Dangku and Bentayan are
Scoping study on modelling of ecological community distribution in South Sumatra, Indonesia
Peat swamp areas could not be visited. Information obtained by personal communication and photographic evidence provided by the BIOCLIME team indicates, however, that MRPP, presumably the best studied and managed area, has suffered from severe illegal logging during the recent past. Illegal logging in peat swamp areas is associated with draining using channels, and therefore the impact on the ecosystem is permanent and restoration activities are very difficult.
A hazardous boat trip to the Sembilang national park showed that large areas of mangrove are still intact, but human activities such as establishment of fish and shrimp ponds already have an impact on the ecosystem in places. Staff from the national park work with villagers to restore mangroves and reduce the impact of village activities.
Overall, pristine forest in South Sumatera can presumably only be found in the areas that are difficult to access, i.e. the national parks Kerinci Seblat and Sembilang. Even these national parks, however, are under pressure from human activities; the mangrove areas more so than the mountainous areas. Considering the overall size of the project area, only small remnants of (dryland) lowland forest remain with the largest continuous ones probably being inside the Harapan project area (approximately 400 km2). With these
agriculturally most valuable areas already being converted, the strongest pressure is now on the peatland areas.
7
Analysis of available datasets
In the following section datasets that were made available at the time of writing are discussed. Besides the GBIF data, all data enquiries were done by BIOCLIME. The list is therefore not comprehensive and only includes data that were provided so far. Missing datasets with possibly high relevance could come from the two national parks, the Harapan Rainforest project and Universitas Muhammadiyah. More intense and possibly direct
communication is needed in the future to get access to them.
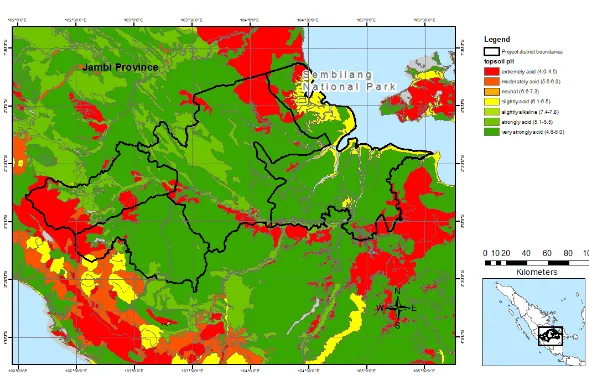
Soil
Scoping study on modelling of ecological community distribution in South Sumatra, Indonesia
Page 8 Landcare Research
Scoping study on modelling of ecological community distribution in South Sumatra, Indonesia
Climate and climate predictions
While the BKMG climate data are freely available, there are only two climate stations in the whole of the South Sumatera province. We therefore extended our analysis to other freely available datasets:
1. WorldClim (www.worldclim.org), a set of global climate layers with a 1-km resolution, provides data for current and future as well as past conditions, The data layers
representing current conditions are created by interpolation of average monthly climate data from weather stations (Hijmans et al. 2005). The WorldClim dataset includes a set of bioclimatic variables (see http://www.worldclim.org/bioclim). Future climate
conditions are based on projections from global climate models (GCMs) for four representative concentration pathways (RCPs). These are the most recent GCM climate projections used in the Fifth Assessment IPCC report. The GCM output was downscaled and calibrated (bias corrected) using WorldClim 1.4 as baseline 'current' climate.
2. The Research program on Climate Change Agriculture and Food Security (CCAFS,
http://www.ccafs-climate.org/) also provides downscaled GCM output using the Delta
Method (Ramirez-Villegas & Jarvis 2010). It uses the same climate baseline and provides the same spatial resolution as WorldClim.
3. The Moderate Resolution Imaging Spectroradiometer (MODIS) is a multispectral sensor
on board the AQUA and TERRA satellites. NASA’s MODIS programme provides land surface temperature layers at 1-km resolution.
4. The Tropical Rainfall Measuring Mission (TRMM) is a joint project between NASA and the Japan Aerospace Exploration Agency (JAXA) designed to monitor and study tropical rainfall. It supplies a number of precipitation datasets at different spatial and temporal resolution. The datasets with the highest spatial resolution are 3 hour and monthly rainfall at 0.25 × 0.25° (27.83 × 27.83 km)
Topography
See chapter 8 on comparison of DEMs.
Biodiversity
At the time of writing, three datasets are available. We additionally analysed biodiversity data provided by the Global Biodiversity Information Facility (GBIF):
ZSL provided observation data that resulted from camera trapping in the Sembilang area. These activities were initially carried out to survey the remaining Sumatran Tiger population, but the results were also used to identify a number of other mammals. The dataset consists of 22 entries and 11 species in MS Excel format.
Scoping study on modelling of ecological community distribution in South Sumatra, Indonesia
Page 10 Landcare Research
georeferences are clearly displayed in the maps, so reconstruction of the dataset would be possible. The number of species are as follows: birds 71 species, 28
families; mammals 22 species, 13 families; reptiles 19 species, the number of families was not provided. The flora data include 302 species of 76 families, but were only provided in aggregated tabular form showing combined statistics. This dataset would be very valuable for the planned analysis, but access to raw data is necessary to link species distributions to environmental factors.
The MRPP dataset includes a comprehensive forest inventory which partly includes detailed taxonomic information. Overall it consists of 45 georeferenced tree sample plots that are evenly distributed over the MRPP area.
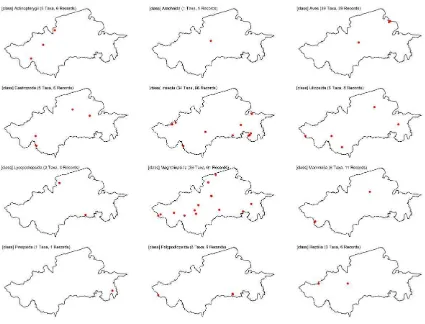
GBIF was accessed using the R programming language via the rgbif package. All datasets in the project area were extracted, which resulted in 217 records that are provided in separate file. Figure 2 shows the spatial distribution and number of records per class.
Figure 3 Distribution of GBIF records per class.
Scoping study on modelling of ecological community distribution in South Sumatra, Indonesia
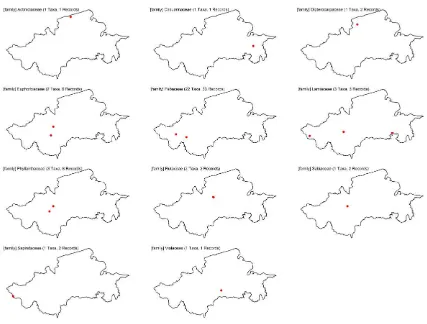
Figure 4 Distribution of Magnoliopsida occurrences.
Identified, but as yet unavailable datasets with good potential are the two datasets associated with studies from Muhammadiyah University and the biodiversity surveys from the two national parks and from the Harapan rainforest project.
Official forest survey data, both NFI and IHMB, might also be valuable additions, but personal communication from other researchers indicates that the records are often
incomplete, and rarely available in digital format, with geospatial coordinates often missing or inaccurate. Moreover, only trees of commercial value are recorded and taxonomic
information is restricted to the genus level. It is therefore doubtful whether these datasets can be of value for the intended analysis.
Scoping study on modelling of ecological community distribution in South Sumatra, Indonesia
Page 12 Landcare Research
8
Comparison of Tandem-X, ASTER GDEM and SRTM
The Tandem-X DEM is using an interferometric creation method based on SAR data. Its data were ordered for the northern part of the project area as part of a science proposal linked to this project. The Tandem-X DEM is supplied with a tiling system commonly used by most other global elevation datasets. The science proposal in our project allowed access to five tiles of the intermediate DEM. To include most of the remnant forest areas of all four major ecosystems, the tiles chosen covered the northern part of the project area. As the delivered
products are part of an “intermediate DEM” based so far on available raw data, even those tiles were not completely covered by adequate data. Tandem-X data were supplied in 12-m and 30-m resolutions.
The Advanced Spaceborne Thermal Emission and Reflection Radiometer (ASTER) Global Digital Elevation Model (GDEM) was created using stereoscopic analysis of near-infrared spectral information. It is freely available at 30-m resolution. For this study the current version 2 was downloaded for the same area that was covered by the Tandem-X DEM.
The Shuttle Radar Topography Mission (SRTM) DEM is similar to the Tandem-X DEM created based on SAR interferometry. It is created on a near-global scale from 56° S to 60° N. Since the beginning of 2015, it is available as a 30-m resolution version that was formerly
restricted to the US, while other areas were covered by 90-m resolution data.
Studies are available that analyse accuracies of ASTER GDEM and SRTM. Considering the scope of the current study, we will not undertake similar comparative analyses but will review published studies that were carried out in different areas and additionally compare the three datasets in the project area to make a pragmatic recommendation. For
comparison purposes, difference grids between the three DEMs were produced based on the 30-m resolution versions. Visual interpretation was the preferred method for analysis as the comparison statistics are heavily influenced by data gaps and the difference in coastlines. Overall, the three datasets shows a similar pattern and strong differences were only observed along the shore lines. Existing studies (Czubski et al. 2014; Li et al. 2012) find that SRTM shows slightly better vertical accuracy than ASTER GDEM v2, but both these datasets provide a statistically reliable description of the terrain surface with most errors occurring in mountainous areas. Problems still persist in the application areas of
hydrological modelling and terrain classification, but for our investigations, which focus on derivation of geomorphometric parameters such as elevation, slope and aspect, both DEMs can be considered of sufficient quality. With SRTM-2 now available at the same 30-m resolution as ASTER GDEM2, it is the preferred option because of its improved vertical accuracy.
The Tandem-X DEM project aims at creating a high resolution, high accuracy dataset of global coverage. First published studies (see e.g. Rao et al. 2014) indicate that these aims will be achieved. Our own analysis showed a high level of homogeneity between the 30-m versions of SRTM and Tandem-X DEM. While the higher accuracy and resolution of Tandem-X DEM (12-m) would be of benefit for some purposes, e.g. hydrological analysis, it is
Scoping study on modelling of ecological community distribution in South Sumatra, Indonesia
Appendix A shows the three DEMs as well as difference raster datasets. The no-data values of the DEMs were set to –32767 so that differences in extent could be clearly differentiated from differences in value when subtracting two DEMs.
9
Data concept
Based on the requirements of the gradient forest method and the available terrain and biodiversity datasets, we can now develop a data concept, i.e. a list of datasets potentially useful for the implementation of GF in this project context. We will discuss the abiotic factors (soil, climate and topography), followed by some conclusions on biodiversity data.
Soil
Currently there is only one comprehensive soil dataset available, the RePPPRrot spatial database. If other datasets become available, none of them will provide comprehensive spatial coverage, but we may use them for validating RePPPRot.
Climate
The available data from climate stations are too sparse for allowing extrapolation to cover the whole area. It is therefore advisable to use remotely sensed data such as MODIS and TRMM, or the Worldclim (Hijmans et al. 2005) dataset, in part because these use a number of different data sources for interpolation. We recommend using Worldclim for two reasons. First, it directly provides monthly bioclimatic variables, which are likely to be of primary importance for understanding biodiversity distributions. MODIS, for example, provides land surface temperatures and these would have to be converted to air temperature by a suitable model. Second, the Worldclim dataset is used as baseline for the climate predictions facility included in Worldclim and also the CCAFS dataset which offers an alternative. As we aim to model future pressures on biodiversity using these downscaled climate prediction datasets, using the same baseline data would reduce inconsistencies.
We compared the methods for downscaling of GCM predictions that the Worldclime project uses with the one applied by the CCAFS dataset and found that the results were so similar we could not make a clear recommendation which one should be used. It is likely that ease of access and processing will influence our decision regarding the approach used.
A validation of the Worldclim dataset for the project area using MODIS and TRMM would be valuable research. The aim would be to examine whether the spatial pattern of climate variables measured by satellites matches the Worldclim-baseline created by interpolation of different datasets.
Topography
Scoping study on modelling of ecological community distribution in South Sumatra, Indonesia
Page 14 Landcare Research
Additional layers
Distance from streams/rivers and distance from coastline provide additional environmental predictors that can usefully be applied to areas of riparian forest and mangroves. Spatial layers of rivers/streams and coastlines will be needed for our study and are already available as part of the BIOCLIME collection of spatial datasets. While SPOT 6 is available for the project, there is no need to include it directly in the GF analysis.
Biodiversity
The data provided so far do not provide consistent coverage of the project area for any of the major conservation-relevant taxonomic groups. Coverage is uneven and limited, even for vegetation/trees where we thought consistent datasets for representative areas of the four major ecosystems might be available. However, not all potential data sources are as yet explored, especially datasets from the two national parks, the Harapan project and Muhammadiyah University, and these could be important for the study. Additionally, BIOCLIME itself will carry out biodiversity surveys that can complement available data.
For our study it is important to collect all biodiversity data that become available in a simple, yet flexible mechanism. A possible solution to this is to design a flexible database schema that can, for example, accommodate different abundance measures. Taxonomic heterogeneities have also to be resolved in the process. The taxonomic definitions found in GBIF may provide a consistent and easy to use template for this process. We suggest using SQLite databases as they are free, able to handle geometric data types, and do not need sophisticated database server software. These databases could also be used by BIOCLIME for other purposes or could be interfaced with the planned data management system.
10
Conclusions
The initial aim of this project was i) create a novel, detailed classification of natural ecosystems that could direct conservation efforts in the future, and ii) create maps of predicted future pressure induced by climate change on biodiversity that would allow for including climate adaptation measures in conservation planning. Below we provide recommendations and justifications for our choices.
We recommend not creating a new ecosystem classification using gradient forest
The reasons for this recommendation are that available biodiversity data are very sparse, presumably not all original natural ecosystems are represented by current forest cover, and a detailed and comprehensive classification already exists. The study was found after the visit to Indonesia as a result of email communication with its author.
Scoping study on modelling of ecological community distribution in South Sumatra, Indonesia
1. Fresh water swamp on alluvium (shallow peat)
2. Mixed peat swamp
3. Peat swamp on deep peat layer
4. Mangroves
5. Riparian formations
6. Low dryland forest of the “Palembang south of Musi < 300 m” type
7. Low dryland forest of the “Jambi – Musi to Kwantan < 150 m” type
8. Hill forest of the “Semangka – Tembesi 300 – 800 m” type 9. Submontane forest of the “Central 800 – 1300 m” type
10. Montane forest of the “Montane and upper montane Central 1300 – 2500 m” type
Two of these 10 ecosystems (6 and 7) are presumably only represented by degraded remnants of the current vegetation. According to the land cover data from 2013 that was provided by BIOCLIME, remnants of ecosystem 6 can be found in the lower parts of Kerinci Seblat national park and adjacent to it and east of the Bentayan wildlife reserve. Remnants of Ecosytem 7 are located inside the Harapan rainforest project and adjacent to it.
From our investigations, it appears that historical biodiversity data are sparse and incomplete. It can therefore be concluded that a reliable distribution of potential forest ecosystems and their relevant their biodiversity cannot be created with the currently available data. The data sources that were so far identified, but could not be accessed and the new biodiversity surveys carried out by BIOCLIME would improve the situation, but only if data representing all 10 mentioned ecosystems could be obtained. Even then, the problem of the degraded state of two of the available major ecosystems would persist.
A detailed study to classify natural ecosystems in Sumatera has already been carried out by Laumonier (1997). The author has extensive experience and access to biodiversity
surveys spanning almost 20 years for the whole of Sumatera. For conservation planning and management we recommend using his results, particularly for the urgent need to protect remaining forested areas. Yves Laumonier lives in Indonesia and is willing to provide the corresponding data in digital form for further usage by the BIOCLIME project.
Scoping study on modelling of ecological community distribution in South Sumatra, Indonesia
Page 16 Landcare Research
We recommend focusing the next phase of this research project on quantification of climate change impact
While a detailed classification of the natural ecosystems is now available, the issue of identifying climate change impacts on biodiversity remains an important aspect for the future. If additional biodiversity datasets identified during the field trip were made
available, it would be possible to conduct a gradient forest analysis in order to identify the importance of different abiotic factors on ecosystem distribution under different climate model scenarios. We suggest this could be undertaken using data mining analysis. This involves using multiple environmental factors as predictors, training the GF algorithm with multiple biodiversity datasets, and examining the results for emerging biodiversity-abiotic interaction patterns. The result of this first analysis step will be envelopes of abiotic factors for each of the major ecosystems with the factors being weighed by their
importance for biodiversity. By changing the abiotic factors according to GCM predictions for the next years, it is possible to create spatial datasets of added pressures on ecosystems similar to a study by Prober et al. (2012) carried out using GDM and data from South-East Australia.
The results can also be combined with the land cover maps to create predictions for specific forested areas. Maps of these datasets could help guide climate change adaptation measures in the future.
11
Proposed next steps
Regarding the ecosystem classification, the following steps are necessary:
Acquire a digital dataset of the eco-floristic regions defined by Laumonier (1997)
Combine the above classification with the land cover analysis currently carried out by BIOCLIME to get an overview of the current state of natural ecosystems.
To carry out the proposed research about climate change impact on biodiversity the following steps are necessary:
Intensify communication with Harapan Rainforest project, the two national parks, Muhammadiyah University, and possibly also UGM and Yves Laumonier to access their biodiversity data. This might include visits to the respective organisations
Create and implement a flexible database model for found biodiversity data
Import all available biodiversity data into the database; this step will make it necessary to resolve taxonomic heterogeneities
Create raster layers of environmental factors based on the datasets identified in the data concept
Adjust the existing R-based gradient forest algorithm implementation in order to use the collected data. Execute initial runs to identify relationships between predictors and species
Scoping study on modelling of ecological community distribution in South Sumatra, Indonesia
Concentration pathways (RPC) as resulting from CMIP5 (Coupled Model Intercomparison Project Phase 5)
Quantify potential environmental stress on biodiversity based on the different RPC and create additional indicators, e.g. indicators of ‘disappearing
environments’, ‘novel or no-analogue environments’ or ‘change in effective habitat area’ as defined by Prober et al. (2012)
Creation of maps of the results and writing of a report
Roll-out and outreach: present the results at a workshop on climate change impact on biodiversity to raise awareness of these issues in Indonesia. If the results of the study are of sufficient quality, a publication in a scientific journal is advisable. Finally, we also suggest that seminar presentations be given at the involved universities, i.e. UNSRI, Muhammadiyah University, and IPB. As UGM provided data, an additional seminar presentation at Yogyakarta would be a possibility.
It is recommended that BIOCLIME staff continue to assemble biodiversity data, especially those datasets already identified and outlined in the data concept.
12
Additional recommendations
In addition to the above conclusions, a number of recommendations of a more general nature can be made:
The planned biodiversity survey should cover all the 10 major identified ecosystems as generally outlined by Laumonier (1997)
Besides vegetation surveys that focus on trees, a survey could be undertaken of one class or (sub)-order of other organisms that are closely connected to forest structure; possibilities include birds, reptiles or monkeys. Specialised Tiger surveys already closely monitor this species
Basic soil surveys could be undertaken during the biodiversity surveys and the results used to strengthen the interpretation of the RePPProt dataset
The official forest inventories focus on tree species of commercial value; it would be interesting to compare such a dataset with a new survey in the same area that considers all found tree species
A common taxonomic classification system should be used; a starting point or template might be the system provided by GBIF.
Scoping study on modelling of ecological community distribution in South Sumatra, Indonesia
Page 18 Landcare Research
13
References
Czubski K, Kozak J, Kolecka N 2014. Accuracy of SRTM-X and ASTER Elevation Data and its Influence on Topographical and Hydrological Modeling: Case Study of the Pieniny Mts. in Poland. International Journal of Geoinformatics 9: 7–14.
Ellis N, Stephen J, Smith S, Pitcher C 2012. Gradient forests: calculating importance gradients on physical predictors. Ecology 93:156–168. http://dx.doi.org/10.1890/11-0252.1
Ferrier S, Manion G, Elith J, Richardson K 2007. Using generalized dissimilarity modelling to analyse and predict patterns of beta diversity in regional biodiversity assessment. Diversity and Distributions 13: 252–264.
Hijmans RJ, Cameron SE, Parra JL, Jones PG, Jarvis A 2005. Very high resolution interpolated climate surfaces for global land areas. International Journal of Climatology 25: 1965–1978.
Laumonier Y 1997. The vegetation and physiography of Sumatra. Geobotany 22. Dordrecht, The Netherlands, Kluwer. 222 p.
Laumonier, Y, Uryu Y, Stüwe M, Budiman A, Setiabudi B, Hadian O 2010. Eco-floristic sectors and deforestation threats in Sumatra: identifying new conservation area network priorities for ecosystem-based land use planning. Biodiversity Conservation 19: 1153–
1174.
Li P, Shi C, Li Z, Muller J-P, Drummond J, Li X, Li T, Li Y, Liu J 2012. Evaluation of ASTER GDEM ver2 using GPS measurements and SRTM ver 4.1 in China. ISPRS Annals of the Photogrammetry, Remote Sensing and Spatial Information Sciences 14): 181–168. Prober SM, Hilbert DW, Ferrier S, Dunlop M, Gobbett D 2012. Combining community-level
spatial modelling and expert knowledge to inform climate adaptation in temperate grassy eucalypt woodlands and related grasslands. Biodiversity Conservation 21: 1627–1650.
Ramirez-Villegas J, Jarvis A 2010. Downscaling global circulation model outputs: the Delta method decision and policy analysis. Working Paper 1. Policy Analysis 1: 1–18. Regional Physical Planning Programme for Transmigration (RePPProt) 1990. The Land
Resources of Indonesia: a national overview. Jakarta, Indonesia, Ministry of Transmigration & UK Overseas Development Agency.
Scoping study on modelling of ecological community distribution in South Sumatra, Indonesia
Appendix 1
–
DEMs and difference raster datasets
SRTM 30 m
Scoping study on modelling of ecological community distribution in South Sumatra, Indonesia
Page 20 Landcare Research
Tandem-X DEM 30 m
Scoping study on modelling of ecological community distribution in South Sumatra, Indonesia
Difference between SRTM and Tandem-X DEM
Scoping study on modelling of ecological community distribution in South Sumatra, Indonesia
Page 22 Landcare Research
Author: Markus U. Müller and Robbie Price
Photo credits: Hendi Sumantri/BIOCLIME