30 CHAPTER III METHODOLOGY
This chapter discussed the steps and the method that was used to answer the research problems of the study. This chapter consists of five parts; the research design, population and sampling procedures, research instruments, variables and hypothesis, data collection techniques, procedure of the research, measurement procedures, and data analysis.
3.1 Research Design
Deal with problems of the study stated previously, this research used the descriptive analysis method by using an ex post facto design. The descriptive method with an ex post facto design was used to find out the students’ problems in reading and their reading achievement and then to see the correlation between independent variable (reading comprehension ability) and dependent variable (students’ problems in reading) and the strength of the connection without considering what went before and just to know what is going on. No treatment involved in the research (Hatch Evelyn, 1991:99).
31
Descriptive research, sometimes known as non-experimental research, deal with the relation between variables, testing of hypotheses, and the development of the generalization, principles or theories that have universal validity. It is concerned with functional relationship. The expectation is that if variable A is systematically associated with variable B, prediction of future phenomena may be possible and the result may suggest additional hypotheses to test.
The above statement not only state that the descriptive research is sometimes called non-experimental research but also deals with the relationship between variables, hypotheses testing, and developing generalization or theory that has universal validity. This type of research design was used to answer and analyze the research problems in this study.
3.2 Populations and Sampling Procedures
32 3.3 Research Instruments
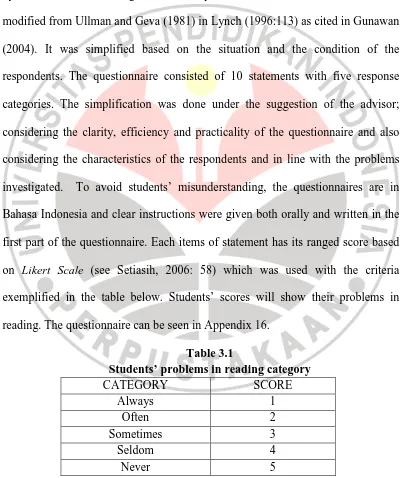
In order to obtain adequate data for the study, there are two instruments used in this research; they were questionnaires and test. The questionnaires were given to the students. The questionnaires talks about the problems that are faced by the students in reading a text. The questionnaire used in this research was modified from Ullman and Geva (1981) in Lynch (1996:113) as cited in Gunawan (2004). It was simplified based on the situation and the condition of the respondents. The questionnaire consisted of 10 statements with five response categories. The simplification was done under the suggestion of the advisor; considering the clarity, efficiency and practicality of the questionnaire and also considering the characteristics of the respondents and in line with the problems investigated. To avoid students’ misunderstanding, the questionnaires are in Bahasa Indonesia and clear instructions were given both orally and written in the first part of the questionnaire. Each items of statement has its ranged score based on Likert Scale (see Setiasih, 2006: 58) which was used with the criteria exemplified in the table below. Students’ scores will show their problems in reading. The questionnaire can be seen in Appendix 16.
Table 3.1
Students’ problems in reading category
CATEGORY SCORE
Always 1
Often 2
Sometimes 3
Seldom 4
33
The test was given to the students to know their competence in reading comprehension. The reading-matter consisted of four texts of recount and narrative which related to the second year of Junior High School curriculum. The topics of the texts are about narrative and recount texts. Each of text consisted of ten multiple choice questions. At first, the test consists of 50 items. Before they were used, the reading comprehension test was tried out to 30 students from population with the students involved in this study. The result shows that the test is valid and reliable (Appendix 10 and 11). However, not all items can be used because some items were not good at discriminating power, too easy or too difficult, thus the number of items was dropped into 40. So, there were 40 questions in the reading test. The test material can be seen in Appendix 17.
For the test instrument, the multiple choice form is chosen for some reasons. First, the scoring is easier, faster and more objective than the other form of tests. Second, this is very efficient when the number of students is large while the allocated time is very short. Third, the reliability of this type of test is higher than the essay test (Surapranata, 2004 in Syafrizal, 2000). Although it has some disadvantages, i.e. it takes longer time to construct the test and the students have chance for guessing in answering the items, but this can be eliminated by providing enough time and providing some options for each item (Grondlund, 1982).
34
the students’ scores attained from the reading test would be the variable X, meanwhile the close-ended questionnaire (Likert-type) would be the variable Y. These two variables, then, will be calculated using the Pearson correlation.
3.3.1 Validity of the Test
According to Heaton (1988), a good test should have at least three characteristics namely validity, reliability, and practicality. In terms of validity, he proposes that there are several types of validity. Some of them which are related to this study are face validity, content validity and external validity. He explains that a test has faced validity if its appearance, the composition of its items, its organization and contents make the test look valid. In terms of multiple choice test, face validity can be fulfilled by having more or less similar length of answer options, having the same number of answer options, using the same numbering (for example A, B, C, D for the whole items), and similar organization, i.e. once the options are written orderly from the left to right, the rest should also written in the same way. The test used in this study has the characteristics above, thus the face validity has been fulfilled.
35
Meanwhile, the external validity of the instruments in this study is reached by correlating the results of try-out with the students’ English scores they gained in the first semester. Here, the statistical analysis of Pearson Product Moment Correlation coefficient is used (Evelyn, 1991:434) to analyze the data. The value of the correlation coefficient was obtained calculated by using SPSS (Statistical Package for Social Sciences).
The computation shows the result is .882 for the test, which means that the test is valid since r table with .01 and df = 28 is .4487 (Appendix 10).
3.3.2 Reliability of the Test
The reliability of the test items also was calculated by using SPSS by stating the total of odd score and even sore of the items. From the calculation, it is shown that the reliability index is .666 for the test, while r table with df= 28 and = 0.01 is .4487 (Appendix 11). It means that the r of the test is greater than that of the table. Thus, the test items can be said to be reliable.
3.3.3 Test Items Difficulty
36 3.3.4 Test Items Discriminating Power
The indexes of items discriminating power are also calculated using the analysis of test item ANATES Version 4.0.2. From the analysis, it can be seen that from 50 items for the test, 1 item has very good discriminating power , 10 items are good, 29 items are medium, 6 items are bad, and 4 are very bad (Appendix 5). So, of all, there are only 40 items can be chosen.
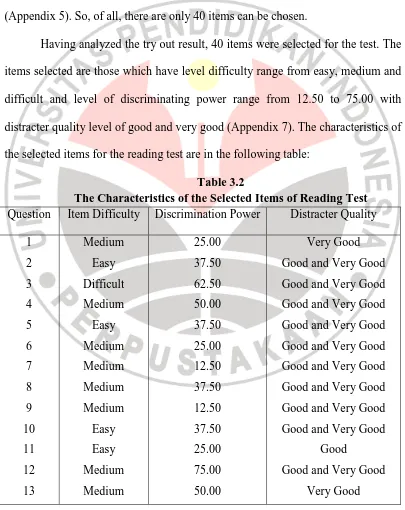
Having analyzed the try out result, 40 items were selected for the test. The items selected are those which have level difficulty range from easy, medium and difficult and level of discriminating power range from 12.50 to 75.00 with distracter quality level of good and very good (Appendix 7). The characteristics of the selected items for the reading test are in the following table:
Table 3.2
The Characteristics of the Selected Items of Reading Test Question Item Difficulty Discrimination Power Distracter Quality
38
From the table of the characteristics of the selected items for the reading test above can be seen that for the level of difficulty, there were 11 easy items, 26 medium items, and 3 difficult items. For the discriminating power, there were 4 items in the range of 12.50, 13 items in the range of 25.00, 13 items in the range of 37.50, 6 items in the range of 50.00, 3 items in the range of 62.50, and 1 item in the range of 75.00. While for the distracter quality, there were 2 items in the level of good, 8 items in the level of very good, and 30 items in the level of good and very good.
3.4 Variables and Hypothesis
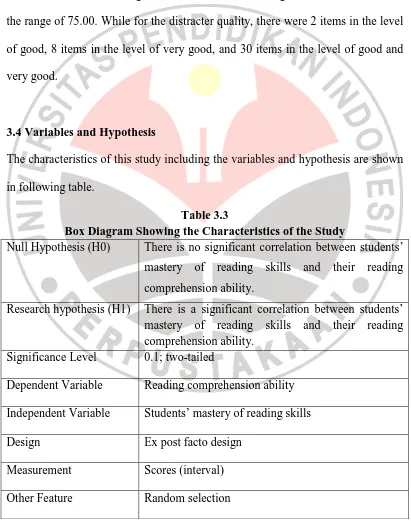
The characteristics of this study including the variables and hypothesis are shown in following table.
Table 3.3
Box Diagram Showing the Characteristics of the Study
Null Hypothesis (H0) There is no significant correlation between students’ mastery of reading skills and their reading comprehension ability.
Research hypothesis (H1) There is a significant correlation between students’ mastery of reading skills and their reading comprehension ability.
Significance Level 0.1; two-tailed
Dependent Variable Reading comprehension ability Independent Variable Students’ mastery of reading skills
Design Ex post facto design
39
Statistical procedures Pearson Product Moment, SPSS 12
3.5 Data Collection Techniques
The two kinds of data, questionnaire and reading test were administered twice to the second year students of an SLTP in Lembang. It was done twice in order to see the consistency of the respondents in answering the questions. Reading test was administered first then followed by questionnaire. Both required 90 minutes for administering.
The result of administering the questionnaire is expected to know the students’ mastery of the reading skills. The questionnaire consisted of ten statements which correlated to the questions from the reading test. Before they were given to the students, the researcher explained about the use of the questionnaires that were going to be filled by them. In this activity, the English teacher also helped. During the activity, the researcher and the English teacher stayed in the classroom to watch the students who were answering the questionnaires and to help them when they found difficulties in responding the questionnaires.
40 3.6 Procedure of the Research
Valid and reliable instruments used to collect the data. For the sake of objectivity and natural setting test, English teacher at the school distributed them. For ethical issue, the participants informed about the research and, therefore, their test score would not influence their school English achievement. However, their truly and honesty in answering the questions on the test and questionnaire was appreciated for the sake of valid research. After that, the researcher checked the assumptions of data.
3.7 Measurement Procedures 3.7.1 Questionnaire
The researcher prepared five options to respond to the statements in the questionnaire. They were always, often, sometimes, seldom, and never. The scores of the statements in the questionnaire were as follows:
Always = 1
Often = 2
Sometimes = 3
Seldom = 4
Never = 5
41
After the mean had been got, the students’ problems in reading could be known by looking at the following rule:
Always = 41 – 50,
Often = 31 – 40,
Sometimes = 21 – 30,
Seldom = 11 – 20, and
Never = 0 – 10.
3.7.2 Test
The data was got from the test was also counted like the above calculation. The highest score was 100. The category was as follows:
A = 81 – 100 = excellent,
B = 61 – 80 = good,
C = 41 – 60 = fair,
D = 21 – 40 = low, and
E = 0 – 20 = extremely low.
The test scoring was as follows:
1 correct = 2.5 = E
2 correct = 5 = E
3 correct = 7.5 = E
4 correct = 10 = E
5 correct = 12.5 = E
42 7 correct = 17.5 = E
8 correct = 20 = E
9 correct = 22.5 = D
10 correct = 25 = D
11 correct = 27.5 = D
12 correct = 30 = D
13 correct = 32.5 = D
14 correct = 35 = D
15 correct = 37.5 = D
16 correct = 40 = D
17 correct = 42.5 = C
18 correct = 45 = C
19 correct = 47.5 = C
20 correct = 50 = C
21 correct = 52.5 = C
22 correct = 55 = C
23 correct = 57.5 = C
24 correct = 60 = C
25 correct = 62.5 = B
26 correct = 65 = B
27 correct = 67.5 = B
28 correct = 70 = B
43
30 correct = 75 = B
31 correct = 77.5 = B
32 correct = 80 = B
33 correct = 82.5 = A
34 correct = 85 = A
35 correct = 87.5 = A
36 correct = 90 = A
37 correct = 92.5 = A
38 correct = 95 = A
39 correct = 97.5 = A 40 correct = 100 = A
3.8 Data Analysis
44
H1 : There is correlation between the two variables
3.8.1 The analysis of students’ mastery of reading skills
Analyzing this aspect means to answer the research questions; what problems were faced by the students of an SLTP in Lembang in reading comprehension and their ability in reading comprehension.
For example of one of the statement in the questionnaire that they can find the main idea of the text, has some item of statements to be chosen by the respondents naturally based on what they do or their habit in reading the English reading text. Each item of statements was ranged based on Likert scale labeled 1 to 5. 1 = always, 2 = often, 3 = sometimes, 4 = seldom, and 5 = never. If the respondents choose score 1, it means that the respondents always find the main idea of the text. Score 2 indicates that the respondents often find the main idea of the text. Score 3 indicates that the respondents sometimes find the main idea of the text about 50%. Score 4 indicates that the respondents seldom find the main idea of the text about 75%. While score 5 indicates that the respondents never find the main idea of the text. By using this scale, the score chosen by the students can be analyzed to know the information about their problems in reading comprehension.
45
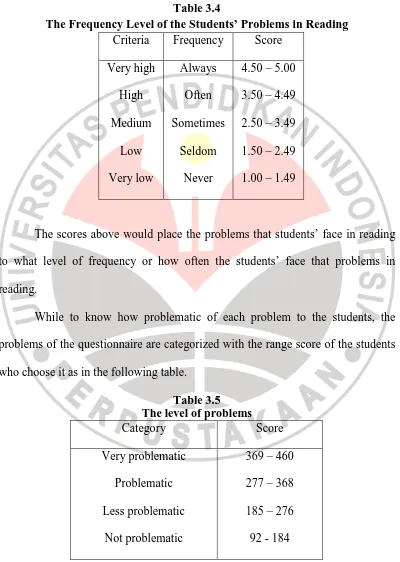
Then low and high criteria are divided become low and very low, high and very high as being described in the following figure.
Table 3.4
The Frequency Level of the Students’ Problems in Reading Criteria Frequency Score
Very high High Medium
Low Very low
Always Often Sometimes
Seldom Never
4.50 – 5.00 3.50 – 4.49 2.50 – 3.49 1.50 – 2.49 1.00 – 1.49
The scores above would place the problems that students’ face in reading to what level of frequency or how often the students’ face that problems in reading.
While to know how problematic of each problem to the students, the problems of the questionnaire are categorized with the range score of the students who choose it as in the following table.
Table 3.5 The level of problems
Category Score
Very problematic Problematic Less problematic
Not problematic
46
3.8.2 The analysis of correlation between the students’ mastery of reading skills and their reading achievement
After the raw data had been collected, the researcher then analyzed it using the descriptive computation to calculate the correlation coefficient between the students’ mastery of reading skills and their reading comprehension ability. But to ease the computation and to get the more precise result, the correlation coefficient whether it is significant or not significant, the analysis was established through the available program of statistical analysis SPSS, since this means is much more practical, efficient as well as provide more accurate result of analysis.