PRACTICAL EXAMPLE FOR USE OF THE SUPERVISED VICARIOUS CALIBRATION
(SVC) METHOD ON MULTISOURCE HYPERSPECTRAL IMAGERY DATA
—
VALCALHYP AIRBORNE HYPERSPECTRAL CAMPAIGN UNDER THE EUFAR
FRAMEWORK
A. Brook a,*, E. Ben-Dor b a
Remote Sensing Laboratory, Center for Spatial Analysis Research (UHCSISR), University of Haifa, Israel – [email protected] b
Remote Sensing Laboratory, Tel-Aviv University, Israel – [email protected]
Commission VI, WG VI/4
KEY WORDS: Unmixing, Feature-extraction, L1/2 nonnegative matrix, Orthogonal matching pursuit, Quantitative target detection,
Hyperspectral imagery.
ABSTRACT:
A novel approach for radiometric calibration and atmospheric correction of airborne hyperspectral (HRS) data, termed supervised vicarious calibration (SVC) was proposed by Brook and Ben-Dor in 2010. The present study was aimed at validating this SVC approach by simultaneously using several different airborne HSR sensors that acquired HSR data over several selected sites at the same time. The general goal of this study was to apply a cross-calibration approach to examine the capability and stability of the SVC method and to examine its validity. This paper reports the result of the multi sensors campaign took place over Salon de Provenance, France on behalf of the ValCalHyp project took place in 2011. The SVC method enabled the rectification of the radiometric drift of each sensor and improves their performance significantly. The flight direction of the SVC targets was found to be a critical issue for such correction and recommendations have been set for future utilization of this novel method. The results of the SVC method were examined by comparing ground-truth spectra of several selected validation targets with the image spectra as well as by comparing the classified water quality images generated from all sensors over selected water bodies.
* Corresponding author.
1. INTRODUCTION
The main assumption of the SVC method is that radiometric and spectral performances and stability of all HSR sensors vary in time and space. As a result, information from periodical calibrations performed in the laboratory domain might not be correct or suitable for a particular campaign. Thus, a method that can assess the overall accuracy and stability of the at-sensor radiance response with the possibility of correcting the potential radiance drift is crucial. The suggested SVC method can be used for different operation schemes (sensor and platform) over the same area, making it both interesting and important. The SVC method was first introduced by Brook and Ben Dor in 2010 and relies on in-situ spectral measurements of a selected test site (bright and uniform) along the airplane's trajectory that is covered by artificial agricultural black polyethylene nets of various densities. These targets are set up on the ground just before the airborne campaign, and their reflectance and radiance are measured in situ during the overpass. The different densities of the nets over the bright background afford full coverage of the HSR sensor's dynamic range and enable correcting radiometric drifts of the laboratory calibration. Until today, the SCV approach was studied in several flight campaigns using single airborne HRS sensor (AISA-DUAL in Israeli national campaigns, HyMap in FP7 EO-miners Sokolov campaign). Apparently, the SVC approach, has not been used elsewhere using a multiple sensors campaign and under varying condition (geographical, illumination, flight directions and landscape) simultaneously acquired. The present study is thus aimed to apply a cross-calibration SVC method and examine the image quality by Quality Assurance (QA) and Quality Indicator (QI) based on the ground SVC site and the nets targets.
2. DATA ACQUISITION AND METHOLOGY
In the current study, three sensors and two airborne platforms were involved in an airborne campaign supported by EUFAR under a project entitled ValCalHyp. The AISA-Dual (operated by NERC) on a Do228 aircraft, and AHS and CASI (operated by INTA) onboard a CASA aircraft acquired data over several selected sites in the south of France (Salon-de-Provence, Marseille, Avignon and Montpellier) on 28 October 2010 between 13:00 and 16:00 UTC. The ground SVC site was set up near Montpellier on a sandy parking lot along the coastline. This site provided a wide, homogeneous, flat surface composed of very bright quartz sand dunes. During the flight campaign, two cross-calibration scenarios were considered: the ideal scenario, when all sensors share the same geometry (in terms of flight heading) and coincident acquisitions (sensing the same area with the same geometry), and the less ideal (more realistic) scenario in which the sensors do not share the same geometry but retain coincident acquisitions, or in which the sensors have different geometries and different acquisitions.
In this project, we studied cross-calibration results for all of the above-mentioned scenarios and compared results from the AISA-Dual, AHS and CASI sensors. Ground spectral measurements were conducted during the overpass in several water bodies to validate the SVC correction. After correcting the data using the SVC method and performing atmospheric correction stage, thematic maps of the water bodies were generated from each sensor to examine the spatial variability between the sensors performance. For that purpose we used the SSIM index according to Wang et al., 2004 to describe the water quality.
The International Archives of the Photogrammetry, Remote Sensing and Spatial Information Sciences, Volume XL-7, 2014 ISPRS Technical Commission VII Symposium, 29 September – 2 October 2014, Istanbul, Turkey
This contribution has been peer-reviewed.
3. DATA ACQUISITION AND METHOLOGY
We found that the reflectance accuracy of the individual data sets (different scenario and cross-calibration sets to extract the favourable coefficients) might vary based on the overall accuracy of the calibration procedure. This can be seen in Figure 1 where the Rad/Ref parameter suggested by Brook and Ben Dor 2011, to judge the sensor radiometric performance has calculated. In general the Rad/Ref spectra must be overlapped across the SWIR region (grey region in Figure 1). The obtained variations suggested that the sensors were not well calibrated. Four stages to correct the data were suggested (F1, F2, F3, F4). The F1 is the albedo normalization, F2 is the radiometric calibration (to the nets radiances) , F3 is the atmospheric correction and F4 is the fine tune correction of the reflectance output. It was found that the cross-calibration scenarios (ideal and less ideal) along with all possible combinations of the SVC method—emphasizing the needs of normalization of the albedo sequence (F1) and radiometric calibration using the SVC net reflectance (F2). In the cross-calibration procedure, SVC involves several steps, each of which may incur errors, reducing the accuracy of the calibration result. Rigorously quantifying these is not a trivial task, and a ‘best estimate’ was sought here to provide a rough idea of the magnitude of the potential errors. We found that the errors were independent for each sensor, contributing to more random-like distributions in the matched and geographically overlaid data. The average uncertainty of the SVC cross-calibration correction for all sensors was ~3% (AISADual 1.6%, AHS 3.2%, and CASI 3.9%).
Figure 1. The radiance and the corresponding Rad/Ref index of the three HSR sensors and the ground truth ASD measurements. The correction factors for the SVC approach for every flight direction is shown in Figure 2. As seen, the flight direction is an important factor to the SVC correction and hence has to be taken into account. As seen, for every flight direction, different
correction factors were obtained. Based on this finding we selected the correction factor the images based on its the flight direction.
Figure 2. The F2 correction factor for each sensor for each sensor and for each flight heading
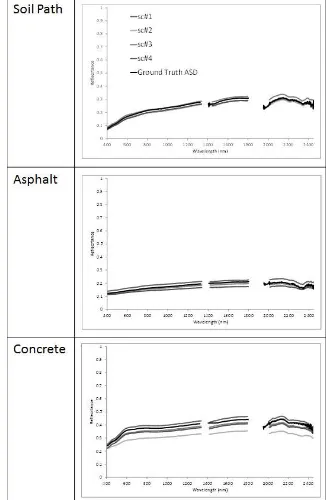
To examine the reflectance data generated after the SVC correction was applied to the ground truth spectral measurements were compared with the sensor’s reflectance. Figure 3 shows some spectra examples indicating good performance of all sensors underwent the SVC approach. This was further confirmed by generating the ASDS factor that calculates the sum of the (positive) difference between the field and image reflectance of the same area.
Figure 3. The spectra of three different targets as obtained at each sensors after applying the SVC. Also given are the ground
truth spectra as measured by the ASD
The International Archives of the Photogrammetry, Remote Sensing and Spatial Information Sciences, Volume XL-7, 2014 ISPRS Technical Commission VII Symposium, 29 September – 2 October 2014, Istanbul, Turkey
This contribution has been peer-reviewed.
Lo
w
W
a
te
r
Q
u
al
ity
H
ig
h
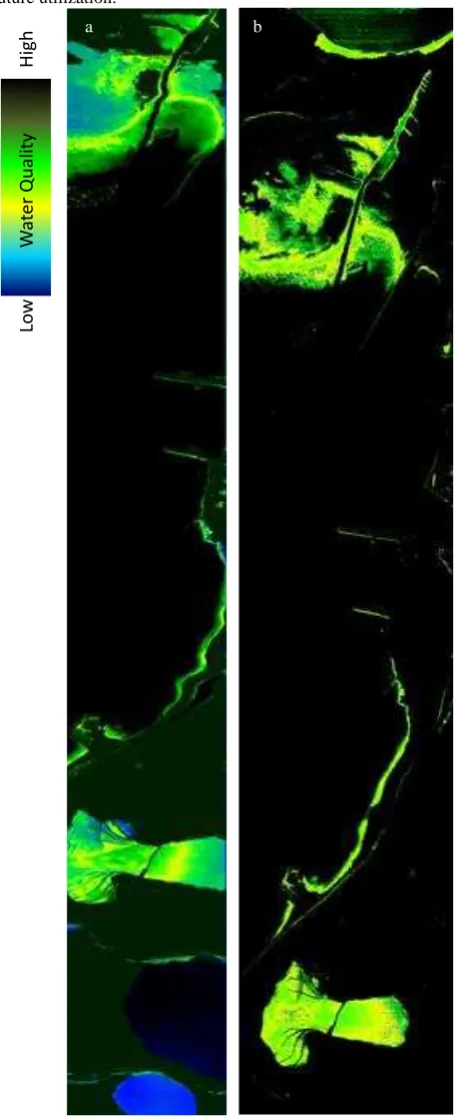
Applying the same thematic index on the corrected images over the same area should provide similar classification as seen on Figure 4. Accordingly, the SSIM index on selected water bodies along Avignon and Montpellier area showed a perfect match between all sensors (Figure 4). These results suggest that the SVC approach performed well for every selected HSR sensor under both ideal and less ideal scenarios. In fact, the good agreement between the ground-truth validation and imagery spectra suggests that the SVC approach performs well for any of the selected HSR sensors and it is strongly recommended for future utilization.
Figure 4. Water Quality Index (WQI) map – a is AISA- DUAL data, b is AHS data.
4. SUMMAREY AND CONCLUSIONS
The SVC approach found to perform well on three different HSR sensors on-board two different platforms. Although the radiometric performance of each sensor was not ideal, the SVC approach enabled to correct it. This correction helped to extract accurate reflectance over several thematic areas far from the SVC playground. The water quality map of selected water bodies that was generated from each sensor demonstrated high similarity. Based on these promising results, we are in the process to upscale this method for the vicarious calibration of orbital HSR sensors and we encourage the community of HSR users to adopt the SVC method toward the generation of a better set of reflectance data.
ACKNOWLEDGMENTS
The authors wish to thank European Facility for Airborne Research EUFAR (www.eufar.net) for funding of the flight campaign (Transnational Access Project „ValCalHyp“) and thank INTA’s crew members (AHS and CASI-1200i sensors onboard the CASA platform) and NERC's crew members (AisaDUAL on DORNIR 228 platform) for the airborne data acquisition.
REFERENCES
Brook, A., Ben-Dor, E. (2011). Supervised Vicarious Calibration of Hyperspectral Remote Sensing Data. Remote Sensing of Environment, vol. 115 (6), pp. 1543-1555.
Wang, Z., Bovik , A. C., Sheikh H. R., Simoncelli E. P. (2004). Image quality assessment: From error visibility to structural similarity. IEEE Trans. Image Processing, vol. 13(4), pp.600 -612.
b a
The International Archives of the Photogrammetry, Remote Sensing and Spatial Information Sciences, Volume XL-7, 2014 ISPRS Technical Commission VII Symposium, 29 September – 2 October 2014, Istanbul, Turkey
This contribution has been peer-reviewed.