www.elsevier.nlrlocateraqua-online
Effect of temperature and ration on growth and
ž
/
condition of king scallop Pecten maximus spat
Ian Laing
)The Centre for EnÕironment, Fisheries and Aquaculture Science, CEFAS Conwy Laboratory, Benarth Road, Conwy, North Wales, LL32 8UB, UK
Accepted 7 July 1999
Abstract
Ž . Ž .
Hatchery-reared king scallop Pecten maximus L. spat 5–14 mm shell height were held in mesh-based Perspex cylinders suspended in 2.5 l beakers of seawater. This seawater was
Ž . Ž
maintained at eight temperatures 58C–238C inclusive , and various rations 0.012–0.492 g
Ž . y1Ž . y1.
organic weight of algae g live weight of spat week of a diet consisting of a mixture of
Ž .
PaÕloÕa lutheri Droop Green and Chaetoceros ceratosporum Ostenfeld were fed. Size of the animals was estimated weekly by computer analysis of video images taken of the scallops in the cylinders while in seawater. The relationship between temperature and food ration was evaluated. As temperature increased, the scallops consumed a bigger ration, and the highest ration that they consumed efficiently determined their maximum growth rate. This ration, and the corresponding growth rate, both increased with temperature. At the end of each 3–4 week experiment, the
Ž .
condition ratio of dry meat weight to dry shell weight of the spat was estimated. Condition was greatest between 108C–178C and least below 8.08C. Condition decreased with lower rations at all
temperatures above 108C. Comparison of results with preliminary observations made at
commer-cial scallop cultivation sites suggest that temperature rather than food is the factor most often
limiting for growth in the sea. Crown Copyrightq2000 Published by Elsevier Science B.V.
Keywords: King scallop spat; Pecten maximus; Ration; Temperature
1. Introduction
Ž .
Scallops Pecten maximus Linnaeus are a valuable seafood product with large
established markets both within Europe and worldwide. There is a significant retail
)Tel.:q44-1492-593883; fax:q44-1492-592123; E-mail: [email protected]
0044-8486r00r$ - see front matter Crown Copyrightq2000 Published by Elsevier Science B.V.
Ž .
demand for good quality scallops which at present cannot be satisfied, and any increase in production within Europe to satisfy this demand is likely to come from cultivation on
Ž . Ž .
seabed sites Ansell et al., 1991; Chataigner, 1996 . Seed spat to supply this emerging industry will be from hatcheries and from collectors deployed in the wild. The success of seabed cultivation of scallops will depend on selection of appropriate sites. Some information is already available from other studies on certain aspects of site selection,
Ž . Ž .
such as substrate Dare et al., 1994 , exposure Duncan et al., 1995 and seabed area
Ž
requirement, in relation to dispersal and density Buestel and Dao, 1979; Minchin, 1992;
.
Dao et al., 1994; Fleury et al., 1996; Grall et al., 1996 . However, other environmental requirements of scallop spat, particularly temperature, food availability, water flow and salinity, must be determined to more fully establish the criteria for suitable sites. This information will also be useful for defining optimum conditions for rearing spat in the nursery, prior to planting out. Some empirical information is available from field studies
ŽBrynjelsen and Strand, 1996; Fleury et al., 1996; Chauvaud et al., 1998 , but closely.
controlled laboratory experiments are also needed. For this study, spat were held at a range of temperatures and rations and the effect on growth and condition noted. Growth rates were compared with some observations from commercial scallop cultivation sites.
2. Materials and methods
Ž .
King scallop P. maximus spat were reared in the hatchery at the CEFAS Conwy
Ž .
laboratory Millican, 1997 at 178C. For each treatment, 8–16 spat of a range of initial
Ž .
sizes 5–14 mm shell height were placed into 1.5 mm nylon mesh-based, 11 cm diameter, 12 cm high Perspex containers. These containers had 1 cm holes, covered by mesh, spaced at 2 cm intervals around the base of the side wall, to allow for free exchange of seawater containing the diet. Scallops of this size range were used as it has
Ž .
been shown that for smaller animals less than 5 mm shell height growth rate, measured
Ž .
as increase in shell height, is lower in smaller spat Laing and Psimopoulous, 1998 . For
Ž
each temperature treatment, six containers, each stocked to give 0.10–1.30 g initial live
.
weight biomass of spat, were placed in 2.5 l glass beakers containing seawater at a salinity of greater than 30 psu. Live weight biomass of spat was estimated from
Ž .
individual shell height measurements, using the relationship: Live weight mg s0.0732
Ž .2.89 Ž .
=shell height mm Laing and Psimopoulous, 1998 . Scallops were acclimated
Ž .
from the rearing temperature 178C to the experimental temperatures at rates of no greater than 18C per day. All six beakers were eventually maintained at one of the following nominal temperatures; 5.08C, 6.58C, 8.08C, 10.08C, 15.08C, 17.08C, 20.08C or 23.08C, by either control of the ambient temperature or by holding them in a water bath. Temperature of the seawater in the beakers was recorded daily. Four or five tempera-tures were tested in each of three experiments, with the 178C treatment always included
Ž .
to ensure consistency of results between experimental batches of spat Table 1 .
Ž .
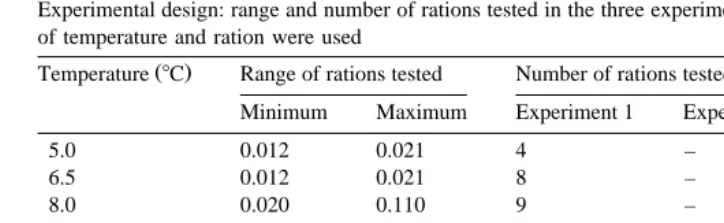
Table 1
Experimental design: range and number of rations tested in the three experiments. A total of 125 combinations of temperature and ration were used
Ž .
Temperature 8C Range of rations tested Number of rations tested in this range
Minimum Maximum Experiment 1 Experiment 2 Experiment 3
5.0 0.012 0.021 4 – –
immediately transferred to clean seawater at the appropriate temperature in another beaker to minimise stress from handling and desiccation.
The scallops were fed a mixed diet of the intensively cultured algae species
Ž . Ž
Chaetoceros ceratosporum Ostenfeld and PaÕloÕa lutheri Droop Green in a 1:1 by
.
cell weight ratio. This diet has been shown to give good growth rates, equivalent to
Ž
those achieved with a natural assemblage of algae species Delaunay et al., 1993; Laing
.
and Psimopoulous, 1998 . The algae were grown in 3 l batch or semi-continuous
Ž .
cultures in a standard medium Walne, 1974 prepared from autoclaved seawater. All cultures were harvested in the exponential growth phase.
Ž
The diet was added daily to give rations in the range 0.012–0.492 g organic weight
. y1 Ž . y1
of algae g live weight of spat week . The range and number of rations tested at each temperature is given in Table 1. The upper values were based on the amount of
Ž
algae consumed by scallop spat in previous experiments Laing and Psimopoulous,
.
1998 and preliminary trials. Each ration was tested in duplicate beakers. The initial
Ž .
biomass of spat i.e., the size and number of animals held in the beaker was adjusted so that the algae cell concentration added to the beakers was always within the range 25–400 cellsmly1.
An estimate of the number of algal cells in suspension in the experimental systems immediately after feeding, and then after 24 h, was obtained using an electronic particle
Ž .
counter Coulter counter, Model Multisizer II with a 70 mm aperture, set to detect particles in the size range 2.0–5.0 mm. From these observations, the proportion of the
Ž .
ration consumed i.e., removed from suspension by filtration was calculated for each treatment.
An additional experiment was carried out at 6.58C, 17.08C and 23.08C in which the spat, in duplicate beakers, were not fed any cultured algae. The unfiltered seawater contained some naturally occurring phytoplankton, equivalent to a ration of 0.004–0.008
Ž . y1 Ž . y1
g organic weight of algae g live weight of spat week .
The shell height of the spat was measured at weekly intervals. The cylinders were transferred to a dish containing seawater. A video image of them, together with a scale
Ž .
Ž
further processed using AEQUITAS Image Analysis software Dynamic Data Links,
. Ž
Cambridge, England for individual shell height measurement perpendicular to the
.
hinge . This method was chosen in order to ensure the minimum of spat handling, since previous studies have indicated that P. maximus may be sensitive in this respect
ŽMillican, 1997 . At this stage, the new initial biomass was calculated as above and the. Ž .
ration fed was adjusted, as required. Each experiment was continued for 3–4 weeks. For each week of each experiment, at each temperature and ration treatment, the
Ž y1.
mean growth rate mm day was calculated from the measurements on the 8–16 individual scallops in duplicate containers. The data set for temperatures in the range
Ž .
6.58C–23.08C 121 combinations of temperature and ration, Table 1 was processed by
Ž .
the G3GRID and GCONTOUR procedures SAS Institute, Cary, NC, USA . The G3GRID procedure interpolates data sets of irregularly spaced observations to complete a rectangular grid that is displayed by GCONTOUR, in this case to show growth rates over the full range of temperatures and rations tested. The results for 5.08C were not included, as there was no growth at this temperature.
Samples of five to six scallops were taken initially and from each of the beakers at
Ž .
the end of the experiments. Dry and organic ash-free dry weight estimations were made on individual spat. For these estimations, spat were washed three to four times in fresh water and transferred to porcelain crucibles previously dried in a heated cabinet at 608C for 4 h and weighed, to the nearest 1 mg, on an automatic electrobalance. The crucibles containing the individual spat were returned to the drying cabinet for 48 h at 608C and then re-weighed to give the total dry weight. The dried spat were then combusted at 4508C for 24 h in a muffle furnace and then re-weighed. Organic weight
Žweight loss on combustion was determined as a percentage of the total dry weight..
Further spat from each beaker were taken and the meats and shells were separated. The
Žpercentage organic weight of each component was then determined, as described.
above. These values were used to calculate, by simultaneous equations, the dry meat and dry shell weights of the spat in the other samples, from the total dry weight and total organic weight values obtained. Condition index of the scallops was then calculated, as
Ž .
the ratio of dry meat weight to dry shell weight Beninger and Lucas, 1984 . For
Ž .
comparison of condition index, an analysis of variance GLM procedure, SAS Institute was carried out on mean values from each beaker. Where a significant difference in condition was found, individual temperature and ration treatments were compared by least significant difference between means.
3. Results
Ž .
Recorded temperatures were similar to the nominal values, means "s.d. were 4.7"0.18C, 6.6"0.18C, 8.0"0.48C, 10.3"0.48C, 14.8"0.58C, 17.2"0.28C, 20.2
"1.08C and 22.9"0.28C. At 178C, the full range of rations was used in each of the 3 experiments, and there was no significant difference for the mean ration between
Ž .
experiments F2, 27s0.846, Ps0.44 . There was also no significant difference
be-Ž
tween mean growth rate of scallops at this temperature in the three experiments F2,
.
s0.186, Ps0.90 .
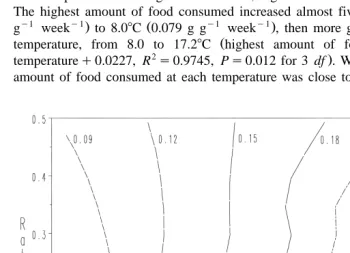
Ž y1.
Fig. 1 shows mean growth rates mm day of king scallop spat within the range of temperatures and rations investigated. There was no growth at 4.78C. Growth was limited primarily by temperature at 6.58C and by ration at 22.98C. The relative influence that each of these factors had on growth rate gradually exchanged through the intermedi-ate temperatures. At each temperature, an increase in ration initially gave an increase in growth, until a point was reached at which higher rations gave either the same growth rate or, at temperatures above 168C–178C, slightly lower growth rates.
The proportion of the fed ration that was consumed by the scallop spat is given in Table 2. There was no measurable uptake of food at 4.78C. At each of the other temperatures, as the ration was increased, a smaller proportion of it was consumed. The level at which the proportion consumed fell below about 80% of that fed corresponds approximately to the point at which a further increase in ration did not give any
Ž .
additional increase in growth rate, at that temperature Fig. 1 . This level of ration
Ž y1 y1.
increased with temperature. The highest amount of food consumed g g week , at each temperature is also given in Table 2, together with the corresponding ration fed.
Ž
The highest amount of food consumed increased almost fivefold from 6.68C 0.016 g
y1 y1. Ž y1 y1.
g week to 8.08C 0.079 g g week , then more gradually, and linearly with
Ž
temperature, from 8.0 to 17.28C highest amount of food consumeds0.0065=
2 .
temperatureq0.0227, R s0.9745, Ps0.012 for 3 df . Within this range the highest amount of food consumed at each temperature was close to the fed ration which gave
Ž y1. Ž .
Fig. 1. Growth rates increase in shell height, mm day of king scallop spat at a range of temperatures 8C
Ž Ž . y1Ž . y1.
Table 2
Mean percentage of the fed ration consumed by king scallop spat held at various temperatures and given
Ž . y1 Ž . y1
rations of 0.012–0.492 g organic weight of algae g live weight of spat week
Ž y1 y1
The asterisk in each temperature column indicates the range of the fed ration in 0.05 g g week
. Ž .
increments in which the greatest amount of food was consumed cleared from suspension . The observed highest amount of food consumed at each temperature is shown in the bottom row of the table.
y1 y1
Ž . Ž .
Ration range: g g week Temperature 8C
6.6 8.0 10.3 14.8 17.2 20.2 22.9
Fed
U
0–0.05 75.42 83.72 93.01 92.80 99.96 – –
U U
0.05–0.10 – 81.94 87.34 79.78 84.19 – –
0.10–0.15 – 69.98 52.23 74.78 78.94 87.65 94.58
U U
0.15–0.20 – – 24.41 54.31 59.02 83.88 89.87
0.20–0.25 – – – – 48.00 81.58 –
0.25–0.30 – – – – – – 88.10
U U
0.45–0.50 – – – – – 69.13 76.09
U
Highest amount of food 0.016 0.079 0.084 0.122 0.135 0.320 0.376
y1 y1
Ž .
consumed g g week
Ž . Ž
maximum growth Fig. 1 . The highest amounts of food consumed at 20.28C 0.320 g
y1 y1. Ž y1 y1.
g week and 22.98C 0.376 g g week were much greater than at the other temperatures, and were also greater than the ration required for maximum growth.
Ž .
Condition index ratio of dry meat weight to dry shell weight is given in Table 3. With a ‘full’ ration, i.e., one that gave maximum growth, condition of the animals was significantly greater between 10.38C–17.28C than at the other temperatures tested
Ž .
outside this range F7, 39s34.05, P-0.0001 . Within this temperature range, it was
Ž .
not significantly different from the initial value of 163.0"12.9 F3, 20s0.32, Ps0.81 . Condition index was significantly lower at 88C than at 17.28C or 14.88C and was also significantly lower at 4.78C and 6.68C than at all other temperatures tested. ‘Low’ rations, i.e., ones that gave less than maximum growth, gave significantly lower
Table 3
Ž .
Mean condition index ratio of dry meat weight to dry shell weight of king scallop spat held at various
Ž . Ž
temperatures and fed a ‘full’ ration one that gave maximum growth , a ‘low’ ration one that gave less than
.
maximum growth , or ‘unfed’ cultured algae. Initial condition index was 163.0"12.9
Ž .
Temperature 8C
4.7 6.6 8.0 10.3 14.8 17.2 20.2 22.9
Ration
Full 85.7 96.6 150.7 165.9 168.8 171.4 145.4 136.8
Low – – – 101.0 110.7 145.4 100.5 94.1
Unfed – 78.1 – – – 67.0 – 77.7
ANOVA
Value of F – 2.44 – 128.13 97.06 175.11 52.76 55.54
Degrees of freedom – 1, 5 – 1, 10 1, 10 2, 11 1, 10 2, 11
condition indices at all temperatures. When no food was added, condition indices were significantly lower than with ‘low’ rations at 22.98C and 17.28C and lower, but not significantly so, than the ‘full’ ration at 6.68C. Condition index of unfed spat was not
Ž .
significantly different at these three temperatures F2, 3s2.78, Ps0.208 .
4. Discussion
For nursery rearing of scallops, higher temperatures gave faster growth rates, but
Ž .
required bigger rations to sustain the increase Fig. 1 . There is probably no commercial advantage to be gained from rearing scallop spat in the nursery above 178C–188C. At these temperatures, scallops fed a ration of 0.15 g gy1 weeky1 grew from 5 to 10 mm
shell height in 23–24 days. At 208C and 238C, this was reduced to 21 days and 19 days, respectively. The amount of food required to achieve this, however, was increased by 20% at 208C and 65% at 238C, and seawater heating costs could be greater. Also, the
Ž .
condition of the spat reared at these higher temperatures was lower Table 3 , which may affect their performance when initially planted out into the sea. The dry meat
Ž .
weight of 10 mm shell height scallops grown at 178C 5.4 mg was 16% and 21%
Ž . Ž .
greater than scallops grown at 208C 4.65 mg and 238C 4.45 mg , respectively. A
Ž . y1 Ž . y1.
ration of about 0.15 g organic weight of algae g live weight of spat week was required at 178C. Larger rations than this did not lead to greater food consumption
ŽTable 2 and did not give any increase in growth rate Fig. 1 .. Ž .
At field sites, it is probable that low temperature is a critical factor affecting success of cultivation. Scallops in the laboratory did not feed or grow at 4.78C, although no mortalities were observed within the timescale of the experiments. In field studies
Ž . Ž .
carried out in Norway by Brynjelsen and Strand 1996 all scallops P. maximus died where the temperature fell to below 28C, and acceptable levels of survival required temperatures higher than 48C. Other species of scallops also appear to be sensitive to
Ž .
low temperatures. About 50% of hatchery-reared bay scallops Argopecten irradians
Ž .
died when mean seawater winter temperature fell below 58C Barber and Davis, 1997 .
Ž .
Strand et al. 1993 have suggested that sensitivity to low temperatures is increased when salinity falls below 26 psu. At this salinity, mortalities of P. maximus greater than 50% were observed at 58C. This may be related to a lower tolerance to salinity stress at low temperatures, as a consequence of the lower condition index of the scallops at these
Ž .
temperatures Table 3 .
Ž . Ž .
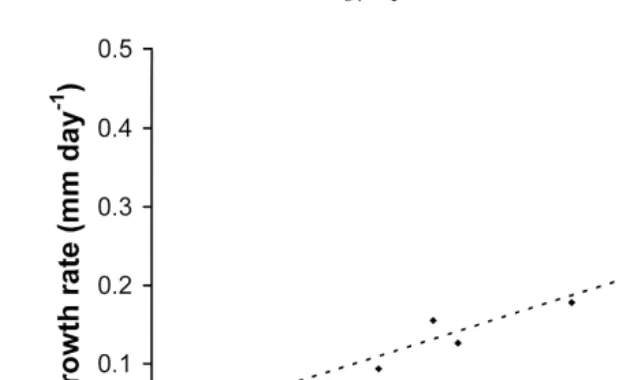
Wilson 1987 and Chauvaud et al. 1998 , from observations on the growth of 1 and 2 year old spat in Birterbuy Bay. Galway, Ireland and the Bay of Brest, France, respectively, have suggested that growth at cultivation sites is mainly regulated by water temperature, together with an effect of flow rate and salinity, rather than the amount of food available. Data from the laboratory studies, when compared with measurements of
Ž .
growth of hatchery-reared spat at UK cultivation sites Fig. 2 , support this idea. The
Ž y1.
Ž y1.
Fig. 2. Growth rates increase in shell height, mm day of 10–60 mm king scallops kept in pearl nets at
Ž
three field sites and measured monthly, compared with mean seawater temperature during the month five
. Ž
readings per day . The dashed line represents the regression of mean maximum growth rates with ‘full’
. Ž
rations in the laboratory experiments at the temperatures tested Growth rates0.0199=Temperaturey0.081;
.
F1, 8s74.9, P-0.0001 .
recorders placed in the pearl nets, and mean monthly values calculated. The sites were geographically separated, one on the south coast of England and the other in a sea loch on the west coast of Scotland. Salinity was not limiting, never falling below 30 psu at either site. The broken line on Fig. 2 represents the relationship between mean
Ž .
maximum growth rates with ‘full’ rations and temperature in the laboratory experi-ments. It can be seen that for any temperature, growth rates in the laboratory when food was not limiting can generally be used to predict growth rates at the cultivation sites, although there are exceptions. Some faster growth rates were recorded at higher temperatures. Scallop spat are capable of consuming much greater quantities of food
Ž .
than is normally required for growth at these temperatures Table 2 and it may be that under certain circumstances, the food value of the algae naturally available is exception-ally high. The lower growth rates observed indicate that a factor other than temperature can at times be severely limiting. This could be food availability, although the fact that growth rates were considerably lower than expected also suggests that this could be related to, for example, the effects of blooms of harmful dinoflagellates, which have
Ž .
been shown to inhibit growth of scallops Chauvaud et al., 1998 . However, there are no data to support this, and other factors recognised as being potentially limiting for growth in the sea could equally be responsible. For example, it has been suggested that the flow
Ž .
rate of the seawater current speed can limit the amount of suspended food available to
Ž .
There is very little information in the literature on the effect of temperature and ration on condition index of king scallop spat. The results obtained in this study are broadly similar to those from work on other species of scallops. Sea scallops, Placopecten
magellanicus, showed a reduced metabolic condition at temperatures less than 78C,
Ž .
manifest as significantly lower condition indices Kleiman et al., 1996 . Results from the present study also show that condition index is lower at temperatures that are higher than the range at which the food source is utilised most efficiently. This is presumably related to higher metabolic requirements restricting growth of the scallop meats in relation to increase in shell size. Food-limited growth gave lower condition indices at all
Ž .
temperatures and Rheault and Rice 1996 showed a similar effect in the bay scallop, A.
irradians irradians in a field study. They concluded that growth rates and condition
index are linearly correlated with the average chlorophyll ration consumed in a commercial aquaculture setting.
5. Conclusions
1. To rear scallops in a nursery, so that they maintain the highest condition index, best
Ž
growth rate is at 178C. At this temperature, a ration of 0.15 g organic weight of
. y1 Ž . y1.
algae g live weight of spat week is required.
2. Growth at any temperature is limited by the amount of algae that the scallops can efficiently consume at that temperature.
3. At cultivation sites, seawater temperature is probably the major growth-limiting factor. Sites where temperatures fall below 48C–58C for prolonged periods are not suitable for scallop cultivation.
Ž
4. Condition index of king scallop spat is reduced at extremes of temperatures below
.
108C and above 178C and at low food rations.
Acknowledgements
This work was carried out as part of research and development programmes on nursery cultivation of king scallops and on the environmental requirements for success-ful scallop cultivation funded by Fisheries II Division of the UK Ministry of Agriculture Fisheries and Food, the latter under the aquaculture LINK initiative.
References
( )
Ansell, A.D., Dao, J.C., Mason, J., 1991. Three European scallops: Pecten maximus, Chlamys Aequipecten
( ) Ž .
opercularis and C. Chlamys Õaria. In: Shumway, S. E. Ed. , Scallops: Biology, Ecology and Aquacul-ture. Developments in Aquaculture and Fisheries Science, Vol. 21, Elsevier, Amsterdam, Netherlands, pp. 715–738.
Barber, B.J., Davis, C.V., 1997. Growth and mortality of cultured bay scallops in the Damariscotta River,
Ž .
Beninger, G.P., Lucas, A., 1984. Seasonal variations in condition, reproductive activity and gross biochemical
Ž .
composition of two species of adult clam reared in a common habitat: Tapes decussatus L. Jeffreys and
Ž .
Tapes philippinarum Adams and Reeve . J. Exp. Mar. Biol. Ecol. 79, 19–37.
Brynjelsen, E., Strand, O., 1996. Test production of king scallop in intermediate culture — 1995–1996. Fisken Havet Havforskningsinstituttet 18, 34 pp., in Norwegian, with English abstract.
Buestel, D., Dao, J.C., 1979. Extensive aquaculture of the scallops Pecten maximus: experimental stocking results. Peche Marit. 1215, 361–365, in French.
Ž .
Chataigner, E.P.J, 1996. L’aquaculture de la coquille Saint-Jacques Pecten maximus : un complement pour la
Ž .
peche. Toulouse France, Ecole Natl. Veterinaire de Toulouse France , 117 pp.
Chauvaud, L., Thouzeau, G., Paulet, Y.M., 1998. Effects of environmental factors on the daily growth rate of
Ž .
Pecten maximus juveniles in the Bay of Brest France . J. Exp. Mar. Biol. Ecol. 227, 83–111.
Dao, J.C., Barret, J., Muzellec, M.L., 1994. Seed-recapture of the scallop, Pecten maximus, by commercial
Ž .
dredging in the Bay of Brest during 1991–92. In: Bourne, N.F., Bunting, B.L., Townsend, L.D. Eds. , Proceedings of the 9th International Pectinid Workshop, Vol. 2, 22–27 April 1993, Nanaimo, B.C., Canada, pp. 16–22.
Dare, P.J., Darby, C.D., Durance, J.A., Palmer, D.W., 1994. The distribution of scallops, Pecten maximus, in the English Channel and Celtic Sea in relation to hydrographic and substrate features affecting larval
Ž .
dispersal and settlement. In: Bourne, N.F., Bunting, B.L., Townsend, L.D. Eds. , Proceedings of the 9th International Pectinid Workshop, Vol. 1, 22–27 April 1993, Nanaimo, B.C., Canada, pp. 20–27. Delaunay, F., Marty, Y., Moal, J., Samain, J.F., 1993. The effect of monospecific algal diets on growth and
Ž .
fatty acid composition of Pecten maximus L. larvae. J. Exp. Mar. Biol. Ecol. 173, 163–179.
Duncan, P.F., Davies, P.S., Taylor, A.C., 1995. Some aspects of the post harvest physiology of the scallop
Ž .
Pecten maximus. In: Barret, J., Dao, J.C., Lubet, P. Eds. , Fisheries, Biology and Aquaculture of Pectinids. Proceedings of the 8th International Pectinid Workshop, 22–29 May 1991, Cherbourg, France, pp. 227–230.
Fleury, P.G., Mingant, C., Castillo, A., 1996. A preliminary study of the behaviour and vitality of reseeded juvenile Great Scallops, of three sizes in three seasons. Aquacult. Int. 4, 325–337.
Grall, J., Chauvaud, L., Thouzeau, G., Fifas, S., Glemarec, M., Paulet, Y.M., 1996. Distribution of Pecten
Ž . Ž .
maximus L. and Its Main Potential Competitors and Predators in the Bay of Brest France . C.R. Acad. Sci. Ser. 3, Sci. Vie. 319, pp. 931–937, in French, with English abstract.
Kleiman, S., Hatcher, B.G., Scheibling, R.E., 1996. Growth and content of energy reserves in juvenile sea scallops, Placopecten magellanicus, as a function of swimming frequency and water temperature in the laboratory. Mar. Biol. 124, 629–635.
Ž .
Laing, I., Psimopoulous, A., 1998. Hatchery cultivation of king scallop Pecten maximus juveniles with cultured and bloomed algae diets. Aquaculture 169, 55–68.
Ž . Ž
Millican, P.F., 1997. The hatchery rearing of king scallop Pecten maximus . CEFAS Centre for Environment
.
Fisheries and Aquaculture Science Publication, Lowestoft, Suffolk, UK, 40 pp.
Minchin, D., 1992. Biological observations on young scallops, Pecten maximus. J. Mar. Biol. Assoc. UK 72, 807–819.
Rheault, R.B., Rice, M.A., 1996. Food-limited growth and condition index in the eastern oyster, Crassostrea
Ž . Ž .
Õirginica Gmelin 1791 , and the bay scallop, Argopecten irradians irradians Lamarck 1819 . J. Shellfish Res. 15, 271–283.
Ž
Strand, O., Solberg, P.T., Andersen, K.K., Magnesen, T., 1993. Salinity tolerance of juvenile scallops Pecten
.
maximus L. at low temperature. Aquaculture 115, 169–179.
Ž .
Walne, P.R., 1974. Culture of Bivalve Molluscs: 50 Years’ Experience at Conwy. Fishing News Books , West Byfleet, 173 pp.
Wilson, J.H., 1987. Environmental parameters controlling growth of Ostrea edulis and Pecten maximus L. in suspended culture. Aquaculture 64, 119–131.