DSM GENERATION FROM HIGH RESOLUTION COSMO-SKYMED IMAGERY WITH
RADARGRAMMETRIC MODEL
P. Capaldo, M. Crespi, F. Fratarcangeli, A. Nascetti, F. Pieralice
Area di Geodesia e Geomatica - DICEA, Universit`a di Roma “La Sapienza”
(paola.capaldo, mattia.crespi, francesca.fratarcangeli, andrea.nascetti, francesca.pieralice)@uniroma1.it
Commission VII, WG VII/2
KEY WORDS:High Resolution SAR, Radargrammetry, COSMO-SkyMed, RPCs generation, DSM generation.
ABSTRACT:
The availability of new high resolution radar spaceborne sensors offers new interesting potentialities for the geomatics application: spatial and temporal change detection, features extraction, generation of Digital Surface (DSMs). As regards the DSMs generation from new high resolution data (as SpotLight imagery), the development and the accuracy assessment of method based on radargrammetric approach are topics of great interest and relevance. The aim of this investigation is the DSM generation from a COSMO-SkyMed Spotlight stereo pair with the radargrammetric technique. DSM generation procedure consists of two basic steps: the stereo pair orientation and the image matching. The suite for radargrammetric approach has been implemented in SISAR (Software per Immagini Satellitari ad Alta Risoluzione), a scientific software developed at the Geodesy and Geomatic Institute of the University of Rome “La Sapienza”. As regard the image matching the critical issue is the definition of a strategy to search the corresponding points; in SISAR software, an original matching procedure has been developed, based on a coarse-to-fine hierarchical solution with an effective combination of geometrical constrains and an Area Base Matching (ABM) algorithm.
1 INTRODUCTION
DSMs have large relevance in many engineering, land planning and environmental applications for a long time. An important part of the international research and development programs are related to the DSMs generation from satellite data, both optical and SAR. DSMs extraction from satellite stereo pair offers some advantages, among which low cost, speed of data acquisition and processing, availability of several commercial software and algo-rithms for data processing. In particular, the DSMs generation from SAR data offers the significant advantage of possible acqui-sition during the night and in presence of clouds.
Up to now, SAR imagery have been employed for the DSM ge-neration using mainly the interferometric approach; to this aim, even special mission have been set up, as the Shuttle Radar To-pography Mission (SRTM) or TanDEM-X mission, specially de-signed to yield elevation data on world scale. In the last years, thanks to the very high resolution imagery acquired by new sen-sors, as COSMO-SkyMed or TerraSAR-X, able to supply ima-gery with 1 m ground resolution, the radargrammetric approach became a valid alternative to generate DSMs from SAR data. In particular this method could be a resource to fill the gaps due to the lack of coherence in interferometric DSMs, in order to obtain the best (accurate and complete) product (Crosetto and Aragues, 1999).
The radargrammetric approach was first used in the 1950s; then, as mentioned, it was less and less used, due to the quite low re-solution of radar imagery in amplitude, if compared to their high resolution in phase. Only in the last decade some researchers have investigated the DSMs generation from very high resolution SAR data, for instance Raggam et al. (Raggam et al., 2010) studied the potentialities of TerraSAR-X, and Toutin and Chenier (Toutin and Chenier, 2009) studied the Radarsat-2 ones.
In analogy to photogrammetry, radargrammetry forms a stereo model for 3D measurement. Only the amplitude information of SAR imagery is used for radargrammetrics measurement, whereas
the interferometry uses the phase information. The gray tones of the image depend on several characteristics of the imaged sur-face, since the radar scene reflects a certain amount of radiation according to its geometrical and physical characteristics. The re-quired geometric configuration suited for radargrammetry is the acquisition of the target from two well different points of view with two different look angles and a base to height ratio ranging from 0.25 to 2 (Meric et al., 2009).
The orientation model for SAR imagery implemented in SISAR (Software per Immagini Satellitari ad Alta Risoluzione, deve-loped at the Geodesy and Geomatic Institute of the University of Rome La Sapienza) is based on the classical Range-Doppler equations proposed in the book of Leberl (Leberl, 1990); more-over a refinement of the orbital model have to be taken into ac-count to comply with and to exploit the potentialities of the novel high resolution (both in azimuth and in range). Using a set of Ground Control Points (GCPs), the corrections for some calibra-tion parameters, whose approximate values are supplied within the image metadata, are estimated, so that the orientation is ob-tained. As regard the image matching for DSM generation, an original procedure has been developed for SISAR, based on a coarse-to-fine hierarchical solution with an effective combination of geometrical constrains and an ABM algorithm.
Here is presented a DSM generated from a COSMO-SkyMed same-side stereo pair acquired in SpotLight mode over the area of Merano (Northern Italy). In the section 3 more details about the SISAR orientation model and the results of the stereo pair orien-tation are shown; the results obtained in the orienorien-tation step are representative of the geometric potentialities of SpotLight stereo pairs as regards 3D surface reconstruction, whereas the accuracy of the final product is strictly affected by the quality of the subse-quent matching procedure.
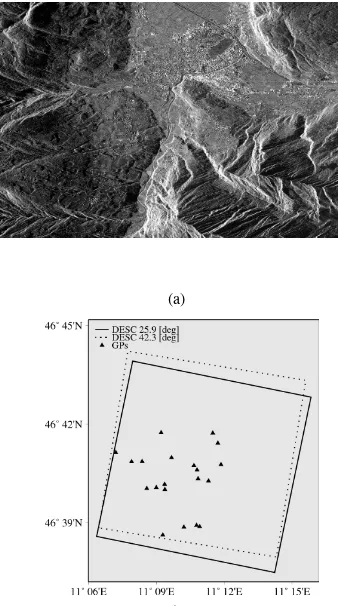
(a)
(b)
Figure 1: Merano Data set and COSMO-SkyMed SpotLight stereo pair
University Hannover, allowing for a full 3D DSM comparison to remove possible horizontal biases too, using as ground reference the LIDAR DTM by the “Provincia Autonoma di Bolzano” free available on-line.
2 COSMO-SKYMED IMAGERY AND ANCILLARY DATA
The available data for the experimentation is a COSMOSkyMed SpotLight stereo pair acquired over the area of Merano (Northern Italy). The images belongs to the Level 1A (SCS) category pro-ducts, that is focused data in complex format, in slant range and zero-Doppler projection. The area is heterogeneous, including an urban zone, the town of Merano, and a mountainous one; the height ranges from about 300 m to 2500 m (Figure 1a). The two scenes were acquired by two different COSMOSkyMed satellites (CSK1 and CSK2), with incidence angles of 25.9 and 42.3 de-grees respectively along an descending orbit, forming a same-side configuration stereo pair. The area covered by the stereo pair is approximately 10 Km x 10 Km wide. The stereo pair orienta-tion is based on 20 Ground Points (GPs) (Figure 1b), used both as GCPs and CPs too; horizontal coordinates are derived from cartography (scale 1:5000) whereas the heights comes from a LI-DAR Digital Terrain Model (mean elevation accuracy of 0.25 m and horizontal spacing 2.5 m), used also in the DSMs assessment; both these data are available for free on the website of the Provin-cia Autonoma di Bolzano (http://www.provinProvin-cia.bz.it/urbanistica- (http://www.provincia.bz.it/urbanistica-/cartografia/cartografia.asp).
3 THE RADARGRAMMETRIC ORIENTATION
MODEL
Radargrammetry technique performs a 3D reconstruction based on the determination of the sensor-object stereo model, in which the object position is computed by the intersection of two radar rays with two different look angles. The model is based on the two fundamental equations (1). The first equation of (1) repre-sents the general case of zero-Doppler projection: in zero-Doppler geometry the target is acquired on a heading that is perpendicular to the flying direction of satellite (Li et al., 2005); the second equation of (1) is the slant range constrain.
velocity in the local coordinate system (time dependent)
XS,YS,ZSare the coordinates of the satellite in the local
co-ordinate system (time dependent)
XP,YP,ZP are the coordinates of the generic Ground Control
Point (GCP) in the local coordinate system (time indepen-dent)
DSis the so-callednear range, a calibration parameter related
to the range measurements considered unknown (a quite ap-proximate value is available in the metadata)
CSis the column spacing
Iis the column position of point P on the image
The satellite orbit could be conveniently modelled with a circu-lar arc since the orbital arc, related to the image acquisition in Spotlight mode, is quite short (about 10 Km) and its parameters are estimated in a least squares adjustment using few orbital state vectors available in the image metadata.
The satellite position is related to the acquisition time of each line of the image, that can be computed using the acquisition
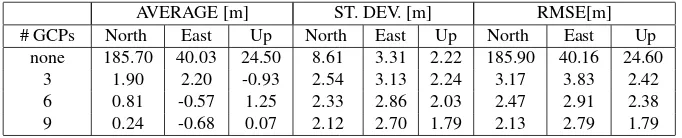
start-timeand thePRF, that is the sampling frequency in azimuth direction. Approximate values for this parameters are available in the metadata, but they have to be corrected to obtain the best accuarcy; in fact, as shown in Table 1, the level of accuracy achievable using only metadata information (without any GCP) is around 20 m both in elevation and in horizontal components; especially, in North direction, which is approximately coincident with azimuth direction, it is evident the effect of the inaccurate acquisitionstart-time. The third parameter that has to be cor-rected is thenear range, that is the main reason for the errors in East direction. Overall, the least squares solution of the orienta-tion problem is devoted to the estimaorienta-tion of correcorienta-tions of these three parameters (the acquisitionstart time, thePRFand thenear range).
AVERAGE [m] ST. DEV. [m] RMSE[m] # GCPs North East Up North East Up North East Up
none 185.70 40.03 24.50 8.61 3.31 2.22 185.90 40.16 24.60 3 1.90 2.20 -0.93 2.54 3.13 2.24 3.17 3.83 2.42 6 0.81 -0.57 1.25 2.33 2.86 2.03 2.47 2.91 2.38 9 0.24 -0.68 0.07 2.12 2.70 1.79 2.13 2.79 1.79
Table 1: Results of SISAR for Merano stereo pair using the radargrammetric rigorous model
t=start–time+ 1
P RF ·J (2)
To test the effectiveness of the new rigorous model implemented in SISAR, the stereo pair has been orientated varying the num-ber of GCPs and the model accuracy is analyzed, evaluating the average, the standard deviation and the RMSE computed over in-dependent Check Points (CPs) residuals, following the standard Hold-Out Validation procedure for accuracy assessment (Brovelli et al., 2008); the results are shown in Table 1. The accuracy level without GCPs is around 18 m in elevation and it decreases to 2.5 m with 3 GCPs; moreover the increase of GCPs number does not improve the accuracy remarkably.
4 IMAGE DENOISING
It is well known that the SAR imagery are affected by a high level of noise due to the inherent nature of radar backscatter. The largest source of noise in a SAR image is the speckle noise. The source of this noise is due to random interference between the coherent returns issued from the numerous scatterers present on a surface, on the scale of a wavelength of the incident radar. Speckle noise gives the SAR image a grainy appearance and pre-vents target recognition and texture analysis efficiently.
Before starting the matching procedure, an image preprocessing step to reduce speckle noise is required. In order to determine which adaptive image filters allow to get the best results in terms of DSMs accuracy, a series of tests were performed varying fil-ter type and window size. The following filfil-ters were used: Lee, Gamma Map, Frost, Median; the correlation window size has been changed from a (5 x 5) size to a (11 x 11) considering only odd sizes. The tests performed show that Gamma Map and Lee filters gives approximately the same results in term of RMSE va-lues, and the lowest are those for a (7 x 7) correlation window. Future investigations will be necessary to assess the potential of more sophisticated image denoising techniques, such as those based on wavelet or frequency domain transformation (Liu et al., 2009).
5 IMAGE MATCHING TECHNIQUE
The accuracy level of DSM is strictly related both to the ima-ge orientation and to the matching process. To obtain good stereo geometry, the optimum configuration for the radargrammetric ap-plication is when the target is observed in opposite-side view; however it causes large geometric and radiometric disparities hin-dering image matching. A good compromise is to use a same-side configuration stereo pair with a base to height ratio ranging from 0.25 to 2 in order to increase the efficiency in the matching procedure. It is well known that the matching process is the au-tomatic identification of pixels representing the same object in two or more images. Many different approaches to image mat-ching have been developed in recent years. The main step of image matching process is to define the matching entity, that is a
primitive compared with a primitive in other images, in order to identify correspondences among different images. According to the kind of primitives match, we can distinguish two basic tech-niques, the Area Base Matching (ABM) and the Feature Base Matching (FBM) (Nascetti, 2009) (Jacobsen, 2006). In ABM method, a small image window, composed of grey values, repre-sents the matching primitive and the main methods to assess simi-larity are cross-correlation and Least Squares Matching (LSM), whereas FBM uses, as main class of matching, basic features that are typically the easily distinguishable primitives in the input i-mages, like corners, edges, lines, etc.
These kind of strategies do not appear suited to manage the strong geometrical deformation (like foreshortening and layover) and the complex and noisy radiometry (speckle) of SAR imagery. Therefore, an original matching procedure has been developed. This matching method is based on a coarse-to-fine hierarchical solution with an effective combination of geometrical constrains and an ABM algorithm (Zhang and Gruen, 2006).
After an images preprocessing, the two images are resampled re-ducing at each pyramid level the original resolution. The cor-respondences between points in the two resampled images are computed by correlation function and finally a least-squares mat-ching refinement is performed to obtain more precise results. At each pyramid step, an intermediate DSM is extracted and it is modeled by the triangular irregular network (TIN) using a 2D Delauney triangulation method. A median filter based on Voronoi polygons is applied on DSM to reduce spikes. In this way the sur-face model is successively refined step by step going from a pyra-mid level to the following one, until the last step (corresponding to the original image resolution) and a final dense and accurate DSM is reconstructed. The advantage of this technique is that at lower resolution it is possible to detect larger structures, whereas at higher resolutions small details are progressively added to the coarse surface.
6 RESULTS: DSM GENERATION
In order to evaluate its potentiality, two different tiles were con-sidered (Figure 2a and 3a), with the purpose to reduce compu-tational cost and consequently long processing times due to the huge size of the image data. The image strips are selected in order to test the potentialities of radargrammetric approach in different morphological situations and in some difficult cases for automatic image matching.
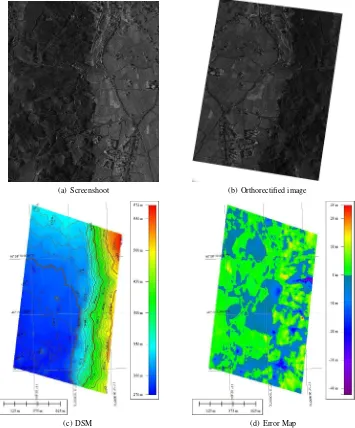
(a) Screenshoot (b) Orthorectified image
(c) DSM (d) Error Map
Figure 2: COSMO-SkyMed Tile 1 Analysis
the other hand a DTM is a filtered version of this surface, ob-tained by removing all the aforementioned features over the bare ground. For this reason part of the displayed differences between the two surfaces is due to the differences between these elements and the bare ground.
The area represented in Tile 1 (Figure 2c) is characterized by a steep rather forested area, which slopes down to a flatter ground where we can find open areas with poor texture and a small built-up zone. An histogram of the height differences is showed in Figure 4a, indicating a numerical range between -40 and +25 me-ters. A sample cut-off at the 95% probability level was done, so that the LE95 was evaluated, in order to leave out the outliers from the accuracy evaluation; then, the bias, the standard devi-ation and RMSE were computed (Table 2). The achieved mean accuracy is around 3.5 meters and appears consistent with the results of orientation; moreover, if open and forested areas are considered, the accuracy goes down and up to 2.0 and 4.3 me-ters respectively. A deeper investigation was carried out through a visual inspection of the error map (Figure 2d); yellow and red areas are matching failures probably caused by zone with poor texture; large positive height differences values (blue areas) are mainly due to the presence of narrow gorges, not correctly
recon-structed.
The area represented in Tile 2 (see Figure 3c) has been cho-sen because it contains some of the most common geometric di-stortions affecting a SAR image. In fact we have a relief affected by foreshortening and layover; foreshortening compresses fea-tures which are tilted toward the radar, furthermore, because of the layover, the top of the feature is displaced towards the radar from its true position on the ground, and it “lays over” the base of the feature. To see the effect of such distortions, an image of Tile 2 has been orthorectificated using the extracted DSM (see Figure 3b; during orthorectification process, layover and foreshortening situations are stretched back to their correct positions and pixels are stretched or smeared, creating areas in which the matching algorithm cannot find homologous points because of lack of
ra-Absolute Error [m]
Average St.Dev. RMSE LE95 # Points Tile 1 0.57 3.52 3.57 9.63 193852 Tile 2 -0.43 5.65 5.67 17.84 272846
(a) Screenshoot (b) Orthorectified image
(c) DSM (d) Error Map
Figure 3: COSMO-SkyMed Tile 2 Analysis
(a) Tile 1 (b) Tile 2
Figure 4: DZ Histogram
diometric information.
These areas are easily recognizable in the error map (Figure 3d; red zones) because they are characterized by the highest values of discrepancies DZ (about 30 m) between the generated DSM and the reference. Also, we can see the blue error zone, that are caused by the shadow of the Passirio river high banks.
In Table 2 the accuracy results of DSM generated starting from Tile 2 are shown. We can see that, due to the aformentioned matching problems, the RMSE grows up to 5.5 m much higher than in Tile 1. The use of more than two images acquired under different look angles, in order to reconstruct the terrain surface objects also in presence of occlusions, distortions and shadows could be an effective strategy to overcome these kinds of pro-blems (Raggam et al., 2010).
7 CONCLUSIONS AND FUTURE WORK
A new model for radargrammetric processing (orientation and DSM generation) of SAR stereo pairs was defined and imple-mented in the scientific software SISAR. An experiment was
car-ried out with a COSMO-SkyMed SpotLight stereo pair collected over the test site of Merano (Northern Italy).
The level of accuracy achievable using only metadata information is affected by a large bias, that is around 20 m both in elevation and in the horizontal components.
The vertical orientation accuracy is better than 2.5 m even with 3 GCPs, and the increase of GCPs number does not improve it remarkably. These results are representative of the geometric po-tentialities of the rigorous radargrammetric model, whereas the accuracy of the final DSM product is strictly affected by the qua-lity of the subsequent matching procedure.
Therefore, the image matching and the DSM generation have been performed in SISAR software and the resulting product has been analyzed.
In conclusion the developed radargrammetric approach (orienta-tion and DSM genera(orienta-tion) for COSMO-SkyMed SpotLight stereo pairs appears promising, especially considering that geometric potential of radar imagery is highly compromised by speckle noi-se and geometric distortions. Although results are encouraging, further tests and researches are needed, especially to improve the potentialities of the automatic matching procedure for DSMs generation in urban areas or in with more complex morphologies, accounting the possibility to joint process more than two images.
ACKNOWLEDGEMENTS
The COSMO-SkyMed stereo pairs was made available by e-Geos S.p.A., Rome (Italy), in the frame of a collaboration agreement; the Authors are indebted to e-Geos S.p.A. for this. Moreover the Authors thank Sysdeco Italia S.r.l. who supplied PCI Geomatica v. 10.3 software and Prof. K. Jacobsen for making available the DEMANAL software.
REFERENCES
Brovelli, M., Crespi, M., Fratarcangeli, F., Giannone, F. and Re-alini, E., 2008. Accuracy assessment of high resolution satellite imagery orientation by leave-one-out method. ISPRS Journal of Photogrammetry & Remote Sensing 63(4), pp. 427–440.
Crosetto, M. and Aragues, F. P., 1999. Radargrammetry and SAR interferometry for DEM generation: validation and data fusion. Proceedings of CEOS SAR Workshop, ESA-CNES, Toulouse, France.
Jacobsen, K., 2006. Digital Surface Models of city areas by very high resolution space imagery. Proceeding of the 1st EARSeL Workshop of the SIG Urban Remote Sensing.
Leberl, F. W., 1990. Radargrammetric image processing. Artec House, Norwood MA.
Li, Z., Zhu, Q. and Gold, C., 2005. Digital terrain modeling: principles and methodology. CRC Press, Florida, USA pp. 39– 51.
Liu, E., Liu, H., Zhang, Y. and Guo, Z., 2009. An Improved Method of Image Denoising Base on Stationary Wavelet. IEEE Global Congress on Intelligent Systems pp. 379–383.
Meric, S., Fayard, F. and Pottier, E., 2009. Radargrammetric SAR image processing. In: Pei-Gee Peter Ho (Eds.), Geoscience and Remote Sensing, Intech pp. 421–454.
Nascetti, A., 2009. A stereo image matching strategy based on corner detection and least squares refinement: algorithm imple-mentation in IDL development environment and testing over high resolution satellite imagery. Degree Thesis (not published).
Raggam, H., Gutjahr, K., Perko, R. and Schardt, M., 2010. As-sessment of the Stereo-Radargrammetric Mapping Potential of TerraSAR-X Multibeam Spotlight Data. IEEE Transactions on Geoscience and Remote Sensing.
Toutin, T. and Chenier, R., 2009. 3-D radargrammetric mod-eling of RADARSAT-2 Ultrafine Mode: preliminary results of the geometric calibration. IEEE Geoscience and Remote Sensing Letters.