REAL TIME INTEGRATION OF FIELD DATA INTO A GIS PLATFORM FOR THE
MANAGEMENT OF HYDROLOGICAL EMERGENCIES
M. Mangiameli, G. Mussumeci
a Dept. of Civil and Environmental Engineering, University of Catania, Italy
[email protected], [email protected]
KEY WORDS: GIS, Web GIS, Hydrogeological emergency, Civil Defense
ABSTRACT:
A wide series of events requires immediate availability of information and field data to be provided to decision-makers. An example is the necessity of quickly transferring the information acquired from monitoring and alerting sensors or the data of the reconnaissance of damage after a disastrous event to an Emergency Operations Center. To this purpose, we developed an integrated GIS and WebGIS system to dynamically create and populate via Web a database with spatial features. In particular, this work concerns the gathering and transmission of spatial data and related information to the desktop GIS so that they can be displayed and analyzed in real time to characterize the operational scenario and to decide the rescue interventions. As basic software, we used only free and open source: QuantumGIS and Grass as Desktop GIS, Map Server with PMapper application for the Web-Gis functionality and PostGreSQL/PostGIS as Data Base Management System (DBMS). The approach has been designed, developed and successfully tested in the management of GIS-based navigation of an autonomous robot, both to map its trajectories and to assign optimal paths. This paper presents the application of our system to a simulated hydrological event that could interest the province of Catania, in Sicily. In particular, assuming that more teams draw up an inventory of the damage, we highlight the benefits of real-time transmission of the information collected from the field to headquarters.
INTRODUCTION
The scenarios occurring after natural disasters, especially on the occasion of exceptional rainfall events in unstable areas, determine a series of questions that require immediate and highly reliable responses to the operators of Civil Defense so the complex machinery of the emergency management can quickly start.
Firstly, it is necessary to identify and circumscribe the damage on road infrastructures, required for all movements of men and equipment, and to determine the residual level of their
functionality; at the same time it is necessary to know “if”, “where” and “how much” people are in difficulty and,
consequently, to establish the priority of the most immediate assistance.
The analysis of the effects induced by calamities on the transport system clearly shows how the destruction or severe damage of even one element has serious consequences for all the territory. These include the impossibility to access the urban network, interruptions or overloading of part of the transport system or on other means of transport, delay in emergency services arriving to the scene of the calamity, etc.. The examination of the transport system and its functionality is thus really important for a wider evaluation of the territorial risk (Condorelli, Mussumeci, 2010; Cafiso et al., 2005; Mussumeci, Cafiso et al., 2004; D'Andrea et al., 2001). Only by having a clear idea of the status of the road network and the general framework of the damage and of the people in difficulty, it is indeed possible to start successfully rescue operations.
To get these answers, two possible actions can be undertaken: 1. starting mathematical simulations that can give probabilistic answers;
2. sending teams of surveyors to provide accurate and documented answers.
The two approaches are not mutually exclusive. On the contrary, they can be both usefully employed benefiting from the use of the geomatic technologies.
Certainly, in the immediate aftermath of the event, the simulation of the probable scenario, based on the event magnitude and on the conditions of vulnerability and exposure of the territory, can support the decision process.
The availability of a GIS platform aimed to the prediction and prevention of risk can support initial decisions on “where” and
“how” to direct first aid. At the same time, it is anyway
necessary to quickly start field surveys and send the information to the Operating Center. Even in this case, the availability of a GIS platform, suitable to acquire and process information from the field (Beni et al., 2007, Mostafavi et al., 2009, Famoso et al., 2012, Mangiameli et al., 2011b, Scianna, 2011), can be very useful to support decisions for the management of the rescue operations (Condorelli, Mussumeci, 2010).
Here we present a system that integrates GIS-Spatial DBMS-WebGIS architectures, based exclusively on free and open source technology, allowing to meet the needs of Civil Defense both in the forecasting/prevention of risk and in the operational phase of the emergency management.
GIS APPROACH FOR THE EVALUATION OF THE HYDROGEOLOGICAL RISK AND THE MANAGEMENT
OF EMERGENCIES
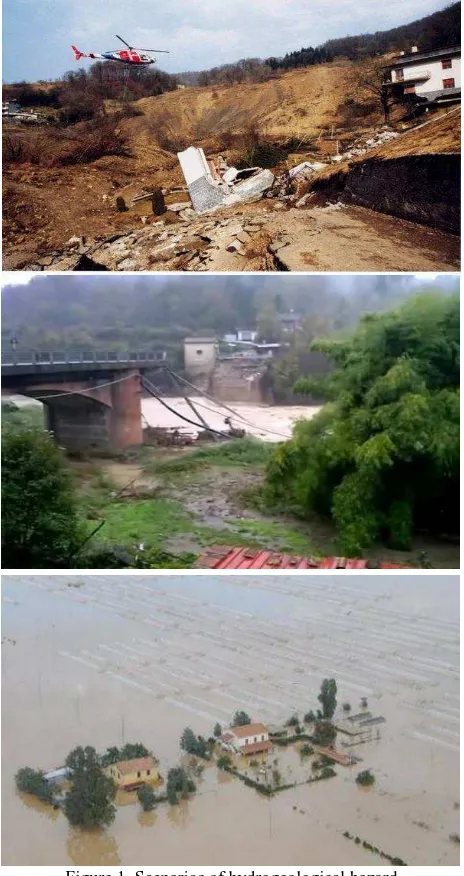
The hydrogeological risk is typically assessed in relation to three hazard scenarios (figure 1):
1. landslides, which depend on the local specificity (lithology, land use, etc.) and the propensity of the soil to collapse; 2. flood, which depends on the volume of water predictable for different return period;
3. overflow, caused by the failure of levees, dams collapse or exceptional rain.
Figure 1. Scenarios of hydrogeological hazard
The areas showing a high hazard can be identified even thanks to thermic and pluviometric data and to the inventory of collapsing structures.
The application of techniques of satellite remote sensing or the employ of direct aerial photogrammetry, also with Unmanned Aerial Systems (UAS), allows the recognition of the consequences of a calamitous event without any teams on the site for surveying. Thus, it is possible to supply in very short times to the Operational Center, all the geographic, territorial and environmental information that are fundamental for the
coordination of the rescue teams, to help the affected population and put the territory under safety conditions.
GIS applications could be also useful for the prevention planning of hydro-geological risk. The knowledge of geologic and lithologic cartography and of the most important mechanical parameter for soils makes possible to construct a slope map and to apply specific mathematical models to evaluate the security factor of slopes and, eventually, to calculate the expected displacements (Maugeri et al., 2010; Mussumeci, Condorelli et al., 2004). Another useful prevention activity is the inventory and the geometric survey of existing landslides in order to construct a GIS vector theme for useful overlaying with road network or built areas (D'Andrea et al., 2001).
Many experiences in analyzing and forecasting risks have been conducted in the laboratory of Geomatics of DICA in recent years. We have investigated the conditions of risk for the infrastructures and for the exposed populations in may areas of Sicily, as in the province of Enna (Cafiso et al., 2002), Siracusa (Condorelli et al., 2007) and Catania (Condorelli, Mussumeci, 2010; Maugeri et al. 2010; Mussumeci, Cafiso et al., 2004; Mussumeci, Condorelli et al. 2004; D'Andrea et al., 2001) . In particular, the implementation of simulation models in a proprietary GIS environment in all the territory of the province of Catania to estimate the hydrogeological risk due to exceptional rains or to the collapse of strategic dams, determined a series of scenarios for different return times (Cafiso et al., 2001).
In this work we propose the architecture of a specialized GIS platform, exclusively based on free and open source technologies, and its application in a simulated scenario due to exceptional rains and overflow of levees, which can determine floodings in large areas of the province of Catania.
Figure 2. Simulated scenario of flooding in the province of Catania (D'Andrea et al., 2001)
2.1 The integrated GIS - DBMS - WebGIS platform for emergency management
For the emergency management, we developed a platform that allows the real-time acquisition of data collected in the field and the immediate construction of damage and exposure maps, through which interventions of the Civil Defense can be managed and differentiated.
The application can be adopted in a wide series of events that require immediate availability of information and field data in a desktop GIS environment.
information collected in the field (Mangiameli et al., 2011, Mostafavi et al.,2012), is exclusively based on the integration of free and open source working environments that have been specifically customized for achieving the planned objectives. The Data Base Management System plays a central role both conceptually and structurally within the system. The information acquired in the field can be addressed to it remotely, over web or radio transmission, and populate the information base of the GIS.
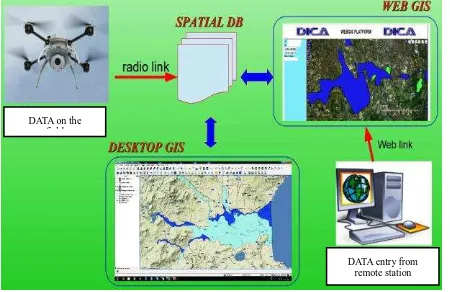
The Web-GIS platform can be thus used to dynamically create and populate a database with spatial features thanks to the possibility of transferring in real-time to the operating center, the information related to the reconnaissance of damage consequently to calamitous events or the acquisitions from monitoring and alerting sensors (figure 5).
In particular, the GIS architecture is composed by: a desktop GIS platform;
a Web-GIS platform; a spatial database.
The desktop GIS platform (figure 3) has been developed using QGIS 1.8.0-Lisboa integrated with Grass 6.4.
The Web-GIS platform has been constructed using Apache 2.2.10 as http server, MapServer 2.3.1 as geoserver, and PMapper for the Web-GIS graphic and tools (Famoso et al., 2012). We also used the OpenLayers platform, which is an open source javascript library to load, display and render maps on web pages, with no server-side dependencies, from multiple sources, like the public administrations Web Map Service (WMS) or Web Feature Service (WFS) and the commercial Google, Bing or OpenStreet maps. Thus OpenLayers can be seen as a rich source of geographic information, very efficient in terms of speed of acquisition and exploration of the data (Pirotti et al., 2011).
The platform has been customized by integrating the following features:
- customization of the graphics;
- customization of the zoom functionality; in particular, a zoom to full extension was inserted between the slider and the zoom navigator;
- a JavaScript/PHP application was implemented to digitize geometric primitives (points, lines and polylines) on the raster supports available in the WebGIS platform that can be managed as vector layers.
The spatial database has been developed using PostgreSQL with the PostGIS geographic extension that allows the creation and management of geodatabase perfectly connectable to GIS platforms, both desktop and Web-GIS side.
The basic structure has been modified by customizing and optimizing some aspects of the platform using different programming languages, such as PHP, HTML, SQL, and PHTML. The principal actions regard the augmentation of functionality and performance of the standard WebGIS environment, as:
- dynamic access to the database to upgrade and view the information;
- generation of the characterizing parameters of the spatial data; - enjoyment of the cartographic Web services (WMS, WFS, etc..);
- utilization of the query builder into the WebGIS;
- improvement of the performance of the editing and printing tools.
The most important aspect is the ability to remotely populate the geographical database, over the Web or radio link, and to make the data immediately available on the Desktop GIS to be processed and possibly to generate new vectorial themes. On the other hand, the platform allows to call up and display spatial data directly from the database.
Figure 3. Architecture of the integrated GIS platform
2.1 Database Structure
The DBMS used is PostgreSql with the geographical extension PostGIS that allows the creation of Geodatabase. This platform is available as free and open source technology and uses pgAdmin III as the user interface for the design, management and administration of the database.
To create a new geographic database inside the DBMS, it is necessary to create a "geometric” table to host, in addition to descriptive attributes, the positioning data observed in the field. Preliminarily, the spatial characteristics of the data should be clarified to make automatic and immediate the position on the cartographic reference. To this end, the geographical table, called "LatLong" in the developed and tested application, is characterized by a column "geom" that encloses, in an alphanumeric string generated with a PostGIS algorithm, the information related to the geometry associated to the data (point, line, polyline, ...), the spatial reference system and the number of spatial dimensions.
In particular, the geographic referencing system is entered with a numerical code called SRID (Spatial Reference System Identifier) available in the table "spatial_ref_sys" present within the spatial extension PostGIS.
The table as a whole contains an "id" attribute with the primary key constraint that uniquely identifies each record and the associate latitude, longitude, column "geom" and every descriptive attributes (figure 4).
Figure 4. Structure of the spatial DB
2.2 Dynamic data entry by Web
After the definition of the structure of the DB and the creation of the geometric table to host the spatial data, we inserted and updated in real time the data collected remotely.
in PHTML (Mangiameli et al., 2012). Once compiled the input mask, the item was properly georeferenced and made visible on a cartographic basis for immediately use in the GIS.
To transfer, in real- or near real-time, the data acquired in the field to the GeoDB, we developed a software application integrating three programming languages (PHP, SQL, PHTML), in order to import into the geometric table the entire listings of points acquired with GPS/GNSS receivers (figure 5). We remind that the php is a language that allows running command scripts on the database and well integrates with the html language to generate dynamic graphical interface. With our developed PHP code, it is possible to:
- open the connection to the spatial database and visualize its status;
- upload data into the database;
- generate the alphanumeric string that define the spatial position of surveyed points;
- close the connection to the spatial database.
Figure 5. Transfer of GPS coordinates into the DBMS
The connection to the database is set using a php command that contains User, Password and DB name. The connection takes advantage of the privacy and sharing properties of the DBMS. In this way the access to the DataBase can be controlled (Pirotti et al., 2011), authenticating the users and assigning, for different types, the actions they can perform on the data. The connection status is reported to the user via the message "connected" or "connection failed".
Insertion of data into the columns of the table is made using the SQL INSERT command, executable inside the php code, giving the name of the table and taking the geometric data from the text-box compiled in the input phase or from acquired files of coordinates.
In order to verify the correct insertion of the geometric data in the table, the developed PHP code includes a check on the proper execution of the SQL INSERT command and the result is displayed to the user through a video message "Keyed in coordinates" or "insertion failed". The input procedure generates in the geometric table an alphanumeric string that associates a unique geometry in space to each record.
To prevent uncontrolled access at the end of the work session, a
“disconnect” command from the DB was added in PHP code.
The command is automatically activated at the end of each stage of data entry and closes the connection to the DB, avoiding that the session remains unintentionally open and exposed to risks.
The user interface has been built in PHTML and can be accessed through the tools menu by a connection specially created in the WebGIS platform.
In summary, a HTML page has been structured, whose title is "insert date", andwhere the call to PHP and the text-boxes for the data input via Web are available. A specific form has been designed to link the text-boxes to the SQL commands inside the executable PHP code. To close the data entry and start the automatic generation of the geometric table, the command
“APPLY” was created.
To remotely use the software architecture, a WebGIS platform has been developed with the use of only free ed open source technologies:
- Apache 2.2.10, as http server; - MapServer 2.3.1, as geoserver; - PMapper, as WebGIS application.
The Web page has been customized with regard to the graphical layout and functionality, importing and integrating at software level plugins and tools of interest. It displays:
- a view (map area) in the center; - a legend of layers at the top right; - a reference map at the bottom right;
- a vertical toolbar containing typical navigation tools (zoom in, zoom out, pan, etc..) and advanced query (Identify, Select, etc.) at the right of the map area;
- a dropdown menu with print, download and data entry functionality.
The operator working on the field can select “Go to the DB” inside the menu and a Web page is available to upload new geographic records in the “LatLong” table. By the selection of the layer “GPS points from field” on the Web GIS legend, the new points are immediately referred to the geographic system and displayed on the video. The table can be dynamically populated with all data acquired on site and the operator at the control station can import that information on his QGIS desktop
platform by the “Add PostGIS layer” tool.
THE CASE STUDY
This work concerns, under the hypothesis of a flooding event in the lowland of Catania (Italy), the management of the interventions on field, for which a real-time acquisition of information is required in order to characterize the operational scenario and to determine the critical areas, the priority of intervention and the optimal paths to reach people in difficulty. The first step was to overlay the map of hazard on a current cartography or other geographic support (satellite images, orthophotos, DTM, ..) to check for interference of the scenario with the road infrastructures and the houses, especially those sparse, which could determine dangerous conditions of isolation for people.
To this end, using QGIS 1.8.0-Lisboa as Desktop GIS and its plugin OpenLayers, we have quickly imported the Bing Aerial with label and the Google physical maps as basic geographic support (figure 6).
Figure 6. Simulated scenario of flooding in GIS environment to individuate the potential condition of risk for people and infrastructures
This simulated scenario can usefully support both the planning of the first interventions and the sending of inspectors and surveyors to acquire true information on site and optimize the emergency management in the first hours after a calamity.
Figure 7. Potential risk for isolated buildings related to the predictable flooding scenario.
To this aim, it is possible to assume that various resources and technologies can be employed on the area affected by the event, ranging from teams of rescuers/detectors to means of transport by land or air, from amphibians to drones (figure 8).
Figure 8. Scheme of the architecture
In any case, each information is related to a spatial reference, which is always accompanied by strings of coordinates generally acquired with satellite positioning technologies, nowadays highly accurate thanks to RTK or NRTK facility
(Dardanelli et al., 2009; Namie et al., 2008). Hence it is needed to acquire the information of "position" into the database and any other information related to that position, which can be a form of damage compiled in the field or an image shot on site. We suppose that the operators of civil protection are equipped with GPS receivers and send via radio their position as NMEA strings to the spatial DB through the WebGIS platform. The information becomes immediately available on the Desktop GIS platform at a remote location, implementing an effective link "Field-Operations Center." This latter can thus receive in real time every information related to the team movements and to the territorial criticality to compose step by step, but without delay, the post event scenario.
The platform, successfully tested using an autonomous robot, import the tracking data of each team or mobile means sent to the field, the coordinates of points of interest (isolated houses with people in need, blocked roads, ...), the perimeter of flooded areas, and transfer information to the GeoDB, associating any acquired information (forms of damage detected, photographic images, ..) to its exact location to be immediately usable and analyzable on the DesktopGIS platform of the Operations Center.
4. CONCLUSIONS
We presented a platform that allows generating and populating a spatial DB from a remote station, by means of a dedicated WebGIS application that integrates functionalities for data management typical of the DesktopGIS environment. On the other hand, via Web data can be accessed with a direct connection to the DB, without necessarily importing a shapefile previously generated and saved in the desktop environment. The application is useful when it is necessary to transfer information in short times from the field to an operations center to be rapidly examined. This requirement is typical of the Operations Centre for the territorial emergency management. Its satisfaction can significantly reduce the time of acquisition of information from areas involved and can certainly help optimizing the use of men and available means to provide emergency assistance to affected populations.
References from Journals:
Cafiso, S., Cutrona, G., Mussumeci, G., 2002. Idrogeologia e rischio stradale nella gestione del rischio a Enna. Aspetti metodologici e operativi nell'analisi del rischio con il GIS. GEOMEDIA, vol. 04/2002, pp. 6-14, ISSN: 1128-8132.
Famoso, D., Mangiameli, M., Roccaro, P., Mussumeci, G., Vagliasindi, F.G.A., 2012. Asbetiform fibers in the Biancavilla site of national interest (Sicily, Italy): review of environmental data via GIS platforms. Reviews in Environmental Science and Bio-technology, ISSN: 1569-1705.
Mangiameli, M., Muscato G., Mussumeci, G., 2011a. Creazione e gestione dinamica di un geo-database da piattaforma Web-GIS open source. In: Geomatica: le radici del futuro. Tributo a Sergio Dequal e Riccardo Galetto. pp. 45-48, Torino-Pavia: Edizioni SIFET, ISBN: 88-901939-6-4.
Namie H., NishiKawa K., Sasano K., Fan C. and Yasuda A., 2008, Development of Network-Based RTK-GPS Positioning System Using FKP via a TV Broadcast in Japan, IEEE
Transactions on Broadcasting, 54(1), pp. 106-111.
DATA on the field
Pirotti, F., Guarnieri, A., Vettore, A., 2011. Collaborative Web-GIS design: a case study for road risk analysis and monitoring. Transactions in GIS 15(2), pp. 213-226.
Scianna, A., Cernigliaro, F., 2007. Metodologia GIS per la valutazione ambientale strategica, Geomedia 3.
References from Books:
Beni, LH., Mostafavi, MA., Pouliot, J., 2007. 3D Dynamic simulation within GIS in support of disaster management. Geomatics Solutions for Disaster Management Lecture Notes in Geoinformation and Cartography, pp. 165-184 .
Cafiso, S., Condorelli, A., Mussumeci, G., 2005. Functional analysis of the urban road network in seismical emergency. GIS application on Catania city. In: Seismic prevention of damage. A case study in a Mediterran city. Wit Transaction on State-of-the-art in Science and Engineering 8, pp. 393-408, WITpress, ISBN: 1-84564-004-7.
Condorelli, A., Mussumeci, G., 2010. GIS procedure to forecast and manage woodland fires. In: M. Konecny, S. Zlatanova, T.L. Bandrova Eds. Geographic Information and Cartography for Risk and Crisis Management. Towards better solutions. p. 103-111, Berlin, Heidelberg, Springer, ISBN: 978-3-642-03441-1, doi: 10.10007/978-3-642-03442-8.
Maugeri, M., Motta, E., Mussumeci, G., Raciti, E., 2010. GIS Techniques in the Evaluation of Pipeline Network Seismic Hazard. In: M. Konecny, S. Zlatanova, T.L. Bandrova Eds. Geographic Information and Cartography for Risk and Crisis Management. Towards better solutions. p. 143-154, Berlin, Heidelberg, Springer, ISBN: 978-3-642-03441-1, doi: 10.10007/978-3-642-03442-8.
Mostafavi MA., Bakillah M.,2012. Real time semantic interoperability in ad hoc networks of geospatial data sources: Challenges, achievements and perspectives. In: ISPRS Annals of the Photogrammetry, Remote Sensing and Spatial Information Sciences, Volume I-2, 2012 XXII ISPRS Congress, 25 August – 01 September 2012, Melbourne, Australia.
Mostafavi, MA., Beni, LH., Gavrilova, M., 2009. 3D dynamic scene surveillance and management using a 3D kinetic spatial data structure. Advanced Geographic Information Systems & Web Services, 2009. GEOWS '09. International Conference on, pp. 45-53 IEEE, E-ISBN: 978-0-7695-3527-2, doi: 10.1109/GEOWS.2009.15.
Mussumeci, G., Condorelli, A., Maugeri, M., Biondi, G., 2004. Earthquake-triggered landslide hazard in the Catania area . In: Risk Analysis IV. WIT Transactions on Ecology and the Environment, vol. 77, pp. 115-130, WIT Press, doi: 10.2495/RISK040111
References from Other Literature:
Condorelli, A., Mussumeci, G., Siligato, G., Storaci, C. 2007. Un SIT tematico per la modellazione del rischio idrogeologico. In: Convegno Nazionale SIFET 2007 "Dal rilevamento fotogrammetrico ai database topografici", SIFET, ISBN: 88-901939-4-8, Arezzo, 27-29 giugno 2007.
D'Andrea, A., Cafiso, S., Colombrita, R., Mussuumeci, G., Colombrtita, F., Condorelli, A., 2001. Un modello di GIS per la valutazione del rischio sulle infrastrutture stradali nelle
emergenze della protezione civile, pp. 1-170. In: Atti XI Convegno Nazionale della Società Italiana di Infrastrutture Viarie (SIIV).
Dardanelli G., Franco V., Lo Brutto M., (2009). Accuracy and reliability in NRTK GNSS. Convegno internazionale ENC-GNSS 2009 (European Navigation Conference - Global Navigation Satellite Systems 2009) Napoli, 3-6 maggio 2009, ISSN 1120-6977.
Mangiameli, M., Muscato, G., Mussumeci, G., 2012. Development of software procedures for assigning optimal paths to autonomous robots in open source GIS environment. In: Atti del Convegno MIMOS 2012. MIMOS: Movimento Italiano Modellazione e Simulazione, Roma, 9-11 ottobre 2012.
Mangiameli, M., Muscato, G., Mussumeci, G., 2011b. Creazione e gestione dinamica di un geo-database da piattaforma Web-GIS open source. In: Geomatica: le radici del futuro. Tributo a Sergio Dequal e Riccardo Galetto. pp. 45-48, Torino-Pavia:Edizioni SIFET, ISBN: 88-901939-6-4.
Mussumeci, G., Cafiso, S, Condorelli, A., Cutrona, G., 2004. A seisismic network reliability evaluation on GIS environment. A case of study on Catania province. In: 4th International Conference on Computer Simulation in Risk Analysis and Hazard Mitigation Rhodes. Rhodes (Greece), pp. 27 – 29 September 2004.