REHABILITATION CLOSURE CRITERIA ASSESSMENT USING HIGH RESOLUTION
PHOTOGRAMMETRICALLY DERIVED SURFACE MODELS
A. T. Fletcher a, *, P. D. Erskinea
a
CMLR, Sustainable Minerals Institute, University of Queensland 4072 Brisbane Queensland, Australia -
(andrew.fletcher, peter.erskine)@uq.edu.au
UAV-g 2013
KEY WORDS: Erosion gully, tree canopy, bare ground
ABSTRACT:
Relinquishment of mined land is unlikely to occur without compelling evidence that post mine landforms have a sustainable vegetation cover and represent a minimal liability to subsequent land users. Gully and rill erosion result in unstable landforms create unsafe landscapes for commonly targeted post mine land uses, such as grazing. The photogrammetric products of two small Unmanned Aerial Vehicle (UAV) platforms were compared as a means of delineating erosion gullies and comparing vegetation in rehabilitation at an open cut coal mine in the Bowen Basin, Queensland. Erosion gullies were clearly visible in both UAV products at 5cm resolution; however, target illumination and photogrammetric processing methods largely determined the ability to identify erosion from surface models. Individual tree canopies were clearly visible in both products, as were phenological traits such as leaf flushing and flowering. The high spatial resolution resulted in unreliable detection of tree crowns in both processing methods.
* Corresponding author. This is useful to know for communication with the appropriate person in cases with more than one author.
International Archives of the Photogrammetry, Remote Sensing and Spatial Information Sciences, Volume XL-1/W2, 2013 UAV-g2013, 4 – 6 September 2013, Rostock, Germany
1. INTRODUCTION
1.1 Background
Effective rehabilitation of mining disturbed landscapes must achieve safe, stable, non-polluting landforms that support self-sustaining vegetation (DEHP 2012). Demonstrating successful rehabilitation will require many years of detailed monitoring to be conducted (Koch and Hobbs 2007). On ground ecological assessments are commonly plot based and primarily assess vegetation cover and biodiversity, implicitly assuming that other more basic criteria such as stability, woody vegetation biodiversity, distribution, and density as well as pollution containment have been achieved. Common ecological plot methods often do not scale to landscape or catchment extents (Mayor and Bautista 2012). Routinely applied methods report, at most, an observer estimated categorical assessment of erosion and casual observations of potential pollution. As relinquishment requires demonstration of safety, stability, sustainability and pollution containment, monitoring will need to continue after mine closure when operational activities that provide resources for management intervention have ceased. Therefore cost-effective, timely and comprehensive information regarding a range of site condition indicators is essential to demonstrate rehabilitation success.
1.2 Problem statement
Modern open cut mining methods transform hundreds of square kilometres of landscape through destruction of geological strata by blasting, mixing and inversion. The spatial extents and chaotic nature of post mining substrates create significant problems for on-ground evaluation of rehabilitation. Generating confidence that rehabilitation activities have resulted in a low risk landscape for post mining uses is critical to mine lease closure.
1.3 Approach
Integration of remotely sensed spatial data with targeted on-ground observation may provide the confidence required by regulators and post mine land users. Miniaturisation of sensors, improvements in embedded computing and commercial scale production of radio control components has allowed rapid development of small UAVs. Computer vision techniques combined with high density data storage allows reconstruction of orthophoto mosaics and digital surface models from massively overlapping small format imagery (Strecha et. al. 2012). High resolution surface models generated from digital imagery collected by small UAV are capable of detailed monitoring of gully erosion location and progression (Marzolff et. al. 2011). High spatial resolutions may be applied to the identification of tree canopies effectively trading traditional multi/hyper-spectral information for analyses based on object detection (Hung et. al. 2012). Applying this methodology to potentially unstable post mined landforms, particularly during early establishment and following disturbance, will provide actionable information for remediation and supporting evidence necessary to meet mine closure requirements.
In this paper we examine the photogrammetric products of small UAV imagery developed by two independent platforms. We assess the ability of 5cm traditional colour imagery and derived surface models to detect erosion gullies and woody vegetation. The application of this imagery to the interpretation of field plot data is discussed.
2. METHODS
2.1 Site Description
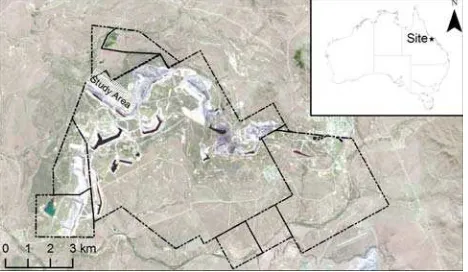
Collinsville Coal Mine in northern Queensland Australia (Figure 1) began operations in 1919 and currently operates as an open cut mine. Total disturbed land is approximately 3500ha with 1200ha claimed as rehabilitated. This rehabilitated area contains a variety of features, including bare ground, erosion gullies, grass and trees and a range of slopes, important to assessing rehabilitation outcomes. The study area included non-rehabilitation domains such as haul roads, ramps and spoil dumps that are typical features of mine sites. Locations of field monitoring plots were determined from previous rehabilitation monitoring reports, confirmed in the field and marked with survey paint prior to collection of imagery. This provided context, location and direct measurements of field condition for comparison with imagery products.
Figure 1. Site location (inset ) and study area (white hash) relative to mine lease extents.
2.2 Image Collection
Two independent image sets were collected within one week in August 2012 using two small UAV platforms covering a similar area of rehabilitation. Method One used a set of 793 images collected and processed using previously described methodology (Fletcher and Erskine, 2012). Method Two utilised a second set of 155 images collected using a Microdrone MD4-1000 carrying a Sony Alpha 900 DSLR 24.6Mp 28mm lens.
2.3 Photogrammetry
Method One used Pix4D photogrammetry software (Pix4D, Lausanne, Switzerland) while Method Two applied more traditional methods provided by Adamtech 3DM Professional (Adam Technology, Australia) photogrammetry software. Both products were produced at 5cm ground resolution as traditional colour photos. Four common ground control points were used to process the data sets to provide a direct comparison of the two methods. High resolution surface models were generated independently for a selected rehabilitation area (see Fig1). Difference in elevation for the surface models was measured by subtracting the results of Method One from Method Two using ArcInfo 3D Analyst (ESRI 2012).
3. RESULTS
Given a small number of common ground control points (4) elevation was reasonably consistent between the independently generated products (Fig 2). Mean difference in elevation
International Archives of the Photogrammetry, Remote Sensing and Spatial Information Sciences, Volume XL-1/W2, 2013 UAV-g2013, 4 – 6 September 2013, Rostock, Germany
between products was 0.9m which arose primarily from differences in photogrammetric detection of tree canopy and erosion gully features. Simple photogrammetry targets such as roads, spoil slopes and bare ground corresponded well between products. Trees and erosion gullies resulted in variable elevation estimations (Figure 2, top) with both methods variably detecting tree canopies.
Figure 2. (top) Elevation difference (m) raster for study area with mid-grey as close, features with higher elevations in Method One in black and white in Method Two. (bottom)
colour ortho mosaic generated by Method One.
Erosion gullies were clearly visible in both UAV products; however, gully depth was poorly correlated between the products (Fig 3). Method One generated a product where erosion gullies were more detailed than Method Two.
Figure 3. Erosion gully in study site area and corresponding surface elevations along transect (Method One grey, Method Two black).
4. DISCUSSION
4.1 Features Examined
Mine site rehabilitation is required to return the impacted land to a safe, stable, sustainable and non-polluting landform suitable for relinquishment to other land uses. This requires the landscape to have erosion, vegetation cover and resilience to natural climate variation similar to the surrounding landscape. Of primary concern to mining companies and regulators is the presence of erosion and absence of vegetation, particularly long lived structural species.
4.1.1 Erosion Gullies
Erosion monitoring at individual gully scales using hyper-spatial resolution UAVs imagery has been demonstrated to detect change (Marzolff et. al., 2011). In the current study, delineating gullies requiring reworking to meet closure criteria was the primary goal. However, future monitoring may be undertaken to demonstrate a lack of on-going erosion, which would require additional measured ground control of target features (Harwin and Lucieer, 2012, Marzolff et. al., 2011).
Measurement of erosion features is strongly influenced by illumination. Method Two imagery was collected in the late afternoon with heavy shadow reducing gully feature information and resulting in loss of feature detail. A key advantage of small UAS is the ability to operate at local site scales under cloud cover which eliminates shadow from imagery and may assist in surface measurement.
4.1.2 Trees and shrubs
The primary source of error in the current project was attributable to poor feature identification for tree canopies in both products. Smoothing functions applied by Method Two removed small trees and shrubs. Both products failed to capture all tree canopies and there was not a consistent pattern of detection. Where tree canopies were detected height estimates were consistent with field observations.
Photogrammetry of trees and shrubs is difficult for a number of reasons (Harwin and Lucieer 2012, Niethammer et. al. 2012) but may be improved for simple landscapes, such as developing mine rehabilitation sites, by applying some assumptions regarding the geometry of these targets (Hung et. al., 2012).
4.2 Application to Mine Rehabilitation
4.2.1 Product error sources
Method One relies on massive image overlap and redundancy with imagery collected on intersecting survey paths. This generates substantially greater numbers of images collected compared to the more traditional Method Two (790 vs 155). Some sections of Method Two show camera footprint associated variation in elevation. Minimising image number in the case of small UAV should be a lower priority given the goal of immediacy and sensor constraints.
Small UAS have the potential to improve coverage and confidence in the interpretation of rehabilitation outcomes. However, the inherent nature of UAV imagery, compact and lightweight sensors with wide fields of view carried by unstable platforms, gives rise to a range of photogrammetric errors (Turner et. al., 2012; Niethammer et. al., 2012) that are further complicated by difficult high resolution targets like vegetation (Harwin and Lucieer, 2012, Hung et. al., 2012). These
International Archives of the Photogrammetry, Remote Sensing and Spatial Information Sciences, Volume XL-1/W2, 2013 UAV-g2013, 4 – 6 September 2013, Rostock, Germany
difficulties are theoretically offset by spatial and temporal resolutions that are economically unattainable using traditional remote sensing platforms (Hung et. al., 2012).
4.2.2 Field Application
While mining rehabilitation has defined spatial extents, establishing ground control density sufficient for centimetre accuracy in photogrammetry (Harwin and Lucieer, 2012) will be infeasible as the area we report in this study would require >1000 RTK-GPS registered markers. In the current study, common ground control was limited to four markers distributed along two sides of the study area. While this is less than ideal, sub-metre agreement between products in this study indicates that, for the purposes of rehabilitation monitoring, effective ground control may be substantially less recommended (Harwin and Lucieer, 2012). Practical attainment of high accuracy levels in small UAV imagery will likely require a combination of direct georeferencing (Chiang et. al., 2012) and ground control.
Fixed monitoring plots covering minute fractions of a study area are routinely used in ecological assessment of natural ecosystems and have been extended to assessment of restoration and mine rehabilitation (Van Gorp and Erskine, 2011). However, soil stability, moisture infiltration and vegetation cover are highly scale dependent while plot measures are not robust to scaling (Mayor and Bautista, 2012).
The imagery collected in this study demonstrates the range of features directly applicable to rehabilitation assessment and interpretation with highly heterogeneous distributions that prevent effective extrapolation of plot results. In plot based assessments, other criteria, such as tree density, will rely on large multiplication factors while stability, safety and vegetation cover will lack confidence or ability to direct management actions due to restricted coverage.
4.3 Conclusions
The integration of spatial remote sensing products with on-ground observation will be essential for effective monitoring during establishment phase of rehabilitation, demonstration of rehabilitation progression and interpretation of monitoring plot data. A converged method reduces the need to make demonstrably inaccurate assumptions regarding rehabilitated landforms. It can also improve the quality of on-ground metrics by directly measuring inherently spatial features such as tree density, erosion and vegetation cover. This will allow field ecologists to better sample biodiversity and ecosystem function in a manner that captures site variability and provides confidence to all stakeholders.
Mining has no naturally analogous process and transforms landscapes drastically. The extreme heterogeneity of post mine substrates and geotechnical construction methods result in a chaotic landscape. Gaining confidence that rehabilitation has achieved its goals will require spatial information supported by on-ground measurements. Current small UAV platforms, sensors and software can provide information on erosion and vegetation cover at near real-time intervals. More nuanced ecological measures such as vegetation structure and composition require further research.
5. REFERENCES
Chiang, K., Tsai, M., and Chu, C., 2012. The development of an UAV borne direct georeferenced photogrammetric platform
for ground control point free applications. Sensors 12, pp9161-9180
Department of Environment and Heritage Protection
http://www.ehp.qld.gov.au/land/mining/pdf/guide-rehab-requirements-mining-em1122.pdf (19 November 2012)
ESRI (2012) ArcGIS Desktop: Release 10.1. Redlands, CA: Environmental Systems Research Institute.
Fletcher, A., T., and Erskine, P., D., 2012. Mapping of a rare plant species (Boronia deanei) using hyper-resolution remote sensing and concurrent ground observation. Ecological Management and Restoration 13, pp195-198
Harwin, S., and Lucieer, A., 2012. Assessing the accuracy of georeferenced point clouds produced via multi-view stereopsis from unmanned aerial vehicle (UAV) imagery. Remote Sensing 4, pp1573-1599
Hung, C., Bryson, M., and Sukkarieh, S., 2012. Multi-class predictive template for tree crown detection. ISPRS Journal of Photogrammetry and Remote Sensing 68, pp170-183
Koch, J., M., and Hobbs, R., J., 2007. Synthesis: Is Alcoa Successfully Restoring a Jarrah Forest Ecosystem after Bauxite Mining in Western Australia? Restoration Ecology 15, S137-S144
Marzolff, I., Ries, J., B., and Poesen, J., 2011. Short-term versus medium-term monitoring for detecting gully erosion variability in a Mediterranean environment. Earth Surface Processes and Landforms 36, pp1604-1623
Mayor, A., G., and Bautista, S., 2012. Multi-scale evaluation of soil functional indicators for the assessment of water and soil retention in Mediterranean semiarid landscapes. Ecological Indicators 20, pp332-336
Niethammer, U., James, M., R., Rothmund, S., Travelletti, J., and Joswig, M., 2012. UAV-based remote sensing of the Super-Sauze landslide: Evaluation and results. Engineering Geology 128, pp2-11
Strecha, C., Bronstein, A., M., Bronstein, M., M., and Fua, P. 2012. LDAHash: Improved matching with smaller descriptors. IEEE Transactions on Pattern Analysis and Machine Intelligence 34, pp66-78
Van Gorp, L., and Erskine, P., D., 2011. The influence of topsoil management on Stradbroke Island sand mine rehabilitation: implications for ecosystem recovery. Proceedings of the Royal Society of Queensland 117, pp377-389.
6. ACKNOWLEDGEMENTS
This research was partially funded by Xstrata Coal Queensland as part of a research program to improve the assessment and outcomes of mine rehabilitation. Method Two products were collected and provided by Helimetrex Pty Ltd as an adjunct to other UAV remote sensing for Collinsville Coal Mine.
International Archives of the Photogrammetry, Remote Sensing and Spatial Information Sciences, Volume XL-1/W2, 2013 UAV-g2013, 4 – 6 September 2013, Rostock, Germany